
![Lync Server Networking Guide
73
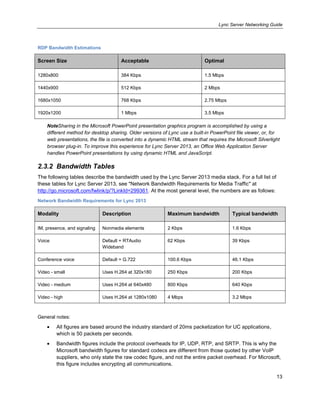
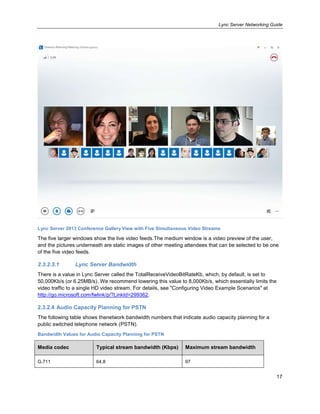
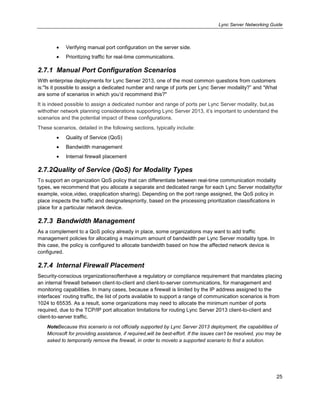
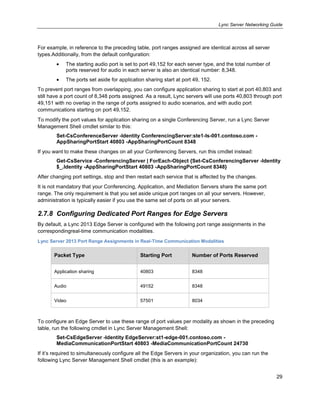
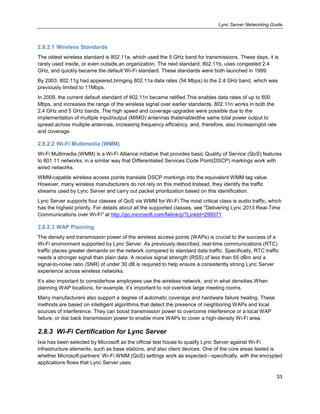
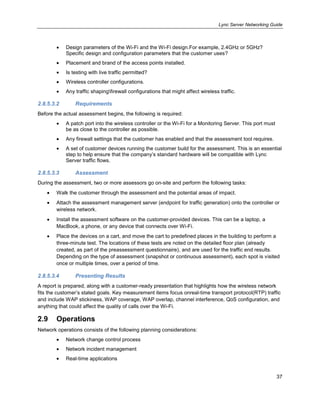
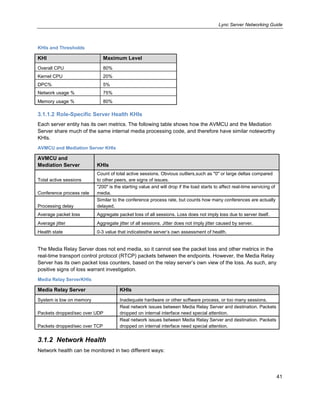
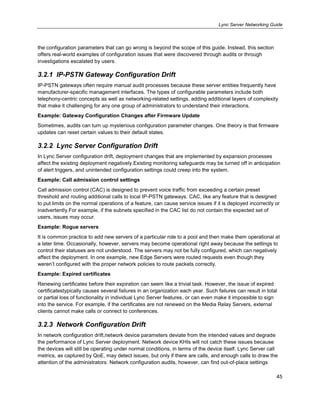
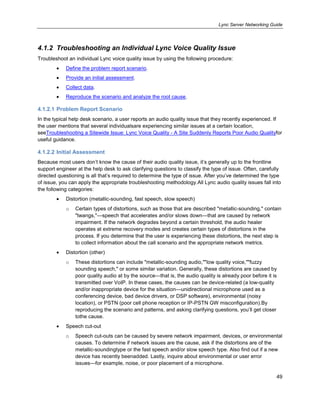
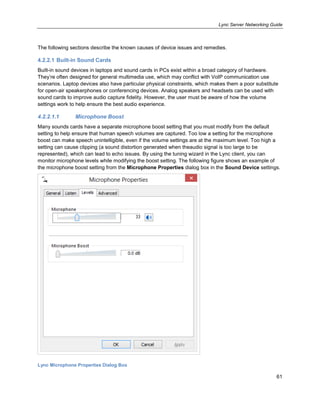
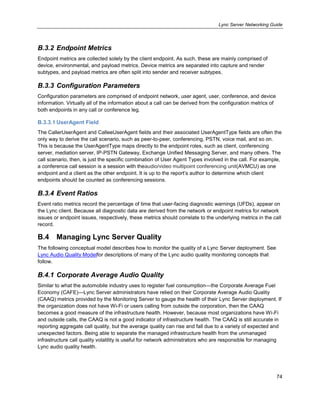
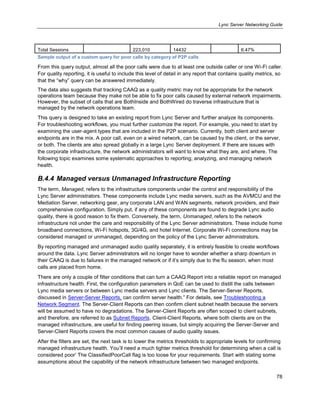
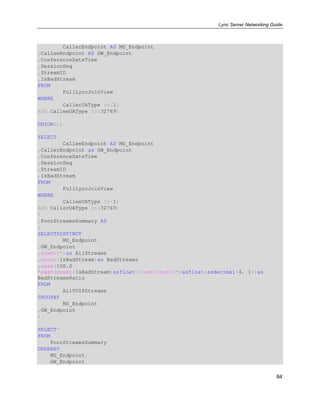
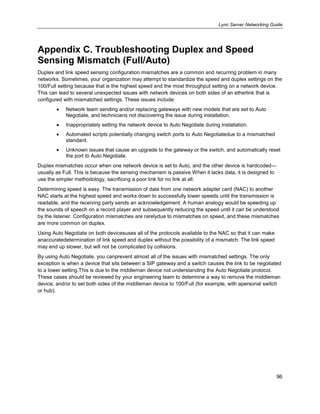
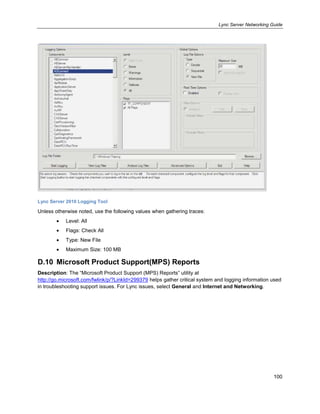
DECLARE @endTime DateTime='2013-1-15';
WITH MyLyncJoinView AS
(
SELECT
s.ConferenceDateTime as ConferenceDateTime
,s.StartTime as StartTime
,s.SessionSeq as SessionSeq
,a.StreamID as StreamID
,CallerUA.UAType AS CallerUAType
,CalleeUA.UAType AS CalleeUAType
,dbo.pIPIntToString(m.CallerSubnet)AS CallerSubnet
,dbo.pIPIntToString(m.CalleeSubnet)AS CalleeSubnet
FROM [Session] s WITH (NOLOCK)
INNERJOIN [MediaLine] AS m WITH (NOLOCK)ON
m.ConferenceDateTime = s.ConferenceDateTime
AND m.SessionSeq = s.SessionSeq
INNERJOIN [AudioStream] AS a WITH (NOLOCK)ON
a.MediaLineLabel = m.MediaLineLabel
and a.ConferenceDateTime = m.ConferenceDateTime
and a.SessionSeq = m.SessionSeq
INNERJOIN [UserAgent] AS CallerUA WITH (NOLOCK)ON
CallerUA.UserAgentKey = s.CallerUserAgent
INNERJOIN [UserAgent] AS CalleeUA WITH (NOLOCK)ON
CalleeUA.UserAgentKey = s.CalleeUserAgent
WHERE
s.StartTime >=(@beginTime)and s.StartTime <(@endTime)
)
SELECT * FROM MyLyncJoinView
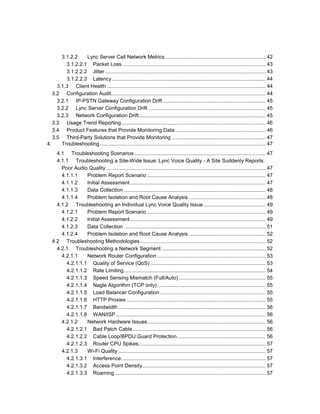
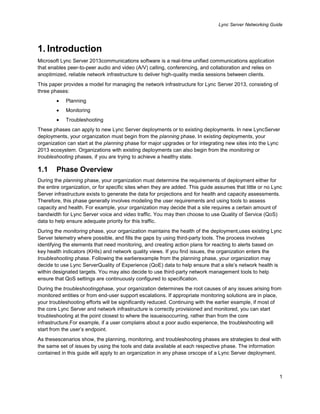
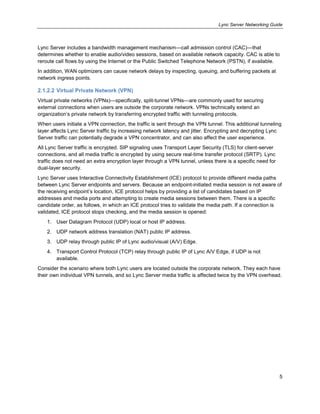
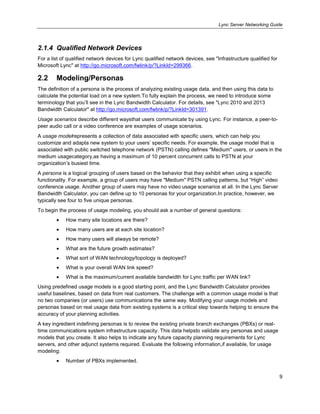
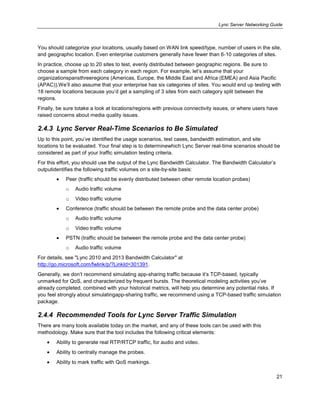
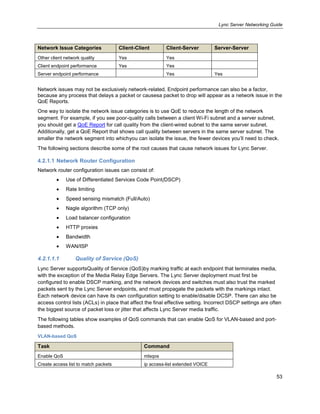
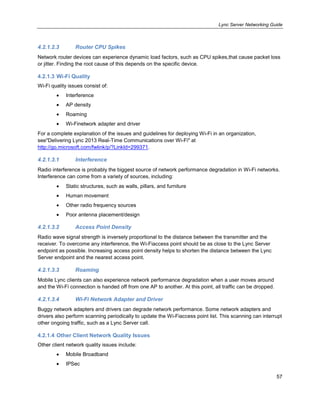
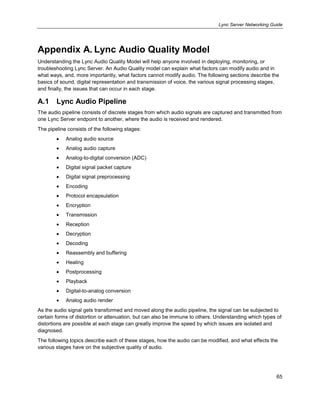
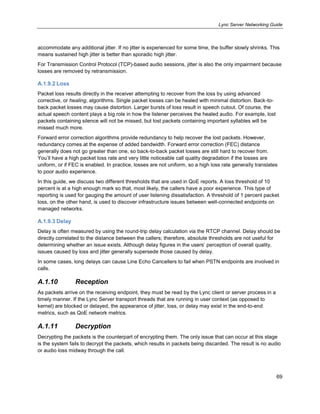
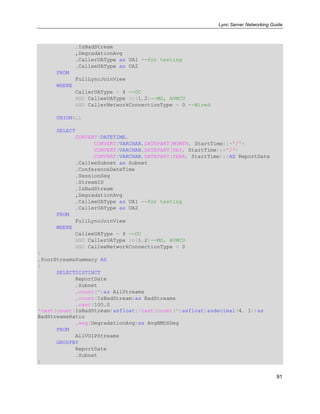
Note A best practice is highlighted in this query: the use of the ―WITH (NOLOCK)‖ clause in the table
JOIN statements. Because most reports are run against the production Monitoring Server, using the
―WITH (NOLOCK)‖ clause prevents any unnecessary performance degradations on the server. There is
no reason to expect updates to the records needed, so locking the tables should be avoided.
B.3 QoE Metrics Review
"Microsoft Lync Server 2010: Work Smart Guide for Monitoring Server Reports" at
http://go.microsoft.com/fwlink/p/?LinkId=301442 describes four categories of information collected by
QoE: end-to-end metrics, endpoint metrics, configuration parameters, and event ratios. These are
functional categories, meaning that they organize the metrics into groups based on how they can be used
for various monitoring and reporting workflows.
B.3.1 End-to-End Metrics
End-to-end metrics are named this because they are measured by the network from Lync Server
endpoints, whether server or client endpoints. They are comprised of packet loss, network jitter, and
delay, and various statistical and derivative metrics. Combined with configuration metrics, a variety of
monitoring scenarios can be created based on these end-to-end metrics.](https://image.slidesharecdn.com/networkingguidelyncserver-130615083542-phpapp02/85/Networking-guide-lync_server-81-320.jpg)
![Lync Server Networking Guide
80
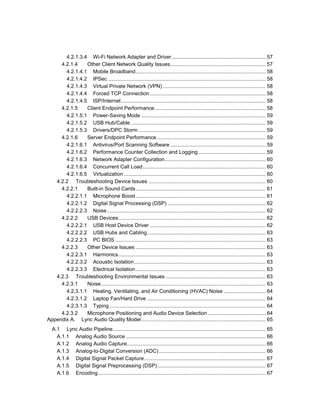
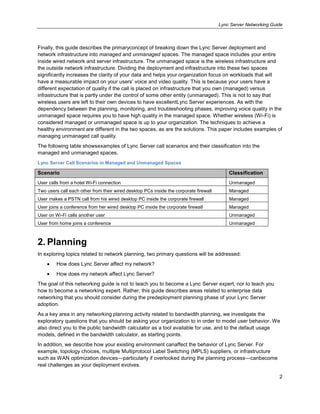
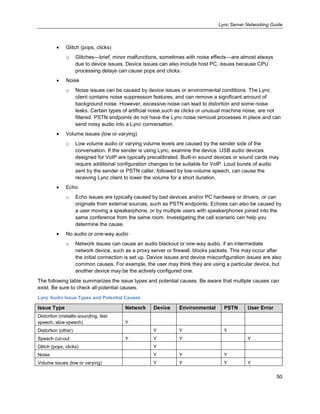
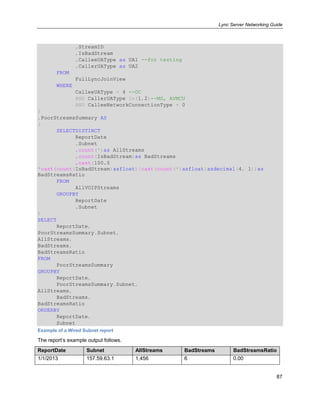
B.5.3 IP-PSTN Gateway
The IP-PSTN gateways have only one VoIP connection in the Lync Server deployment, and that is to the
Mediation Server. The gateways are useful for asserting the network path to the Mediation Server. If the
Mediation Servers are located in the data center and their paired gateways are in the site offices, the
WAN link can be asserted with the MS-GW Reports.
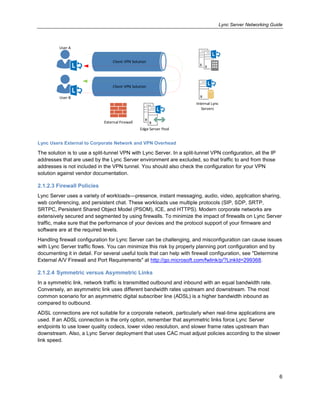
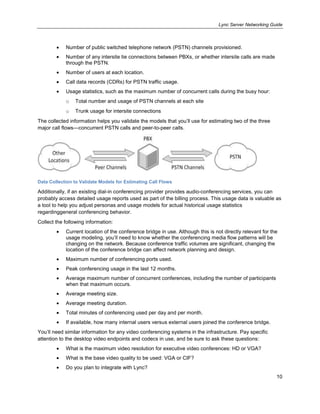
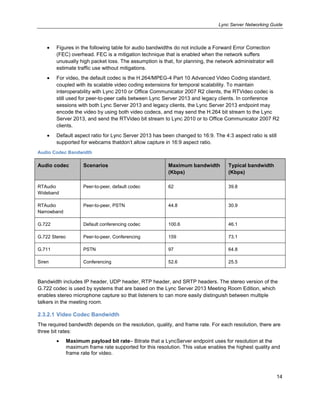
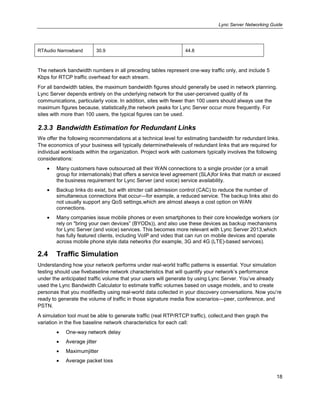
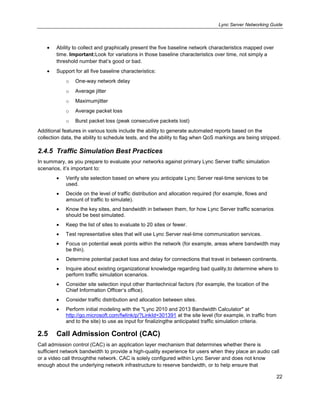
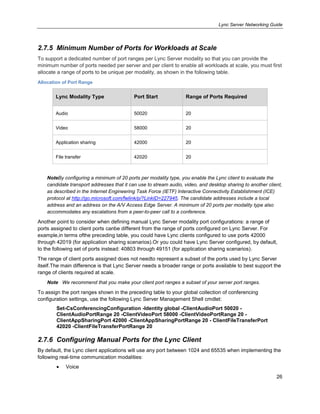
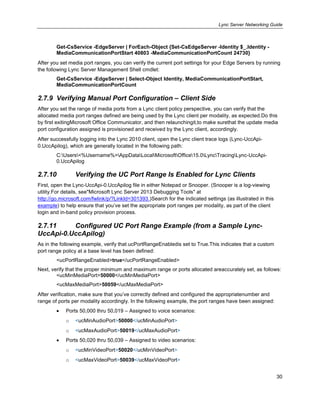
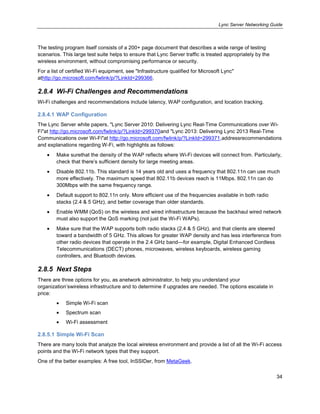
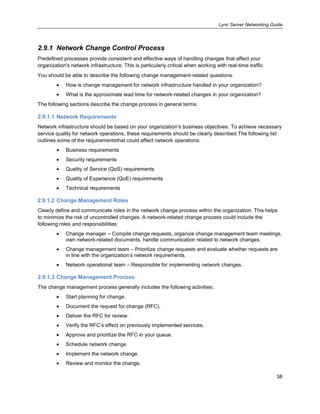
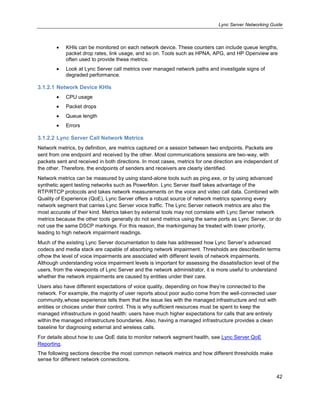
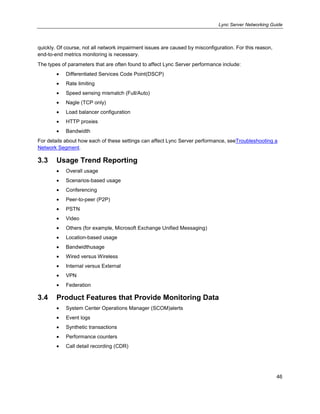
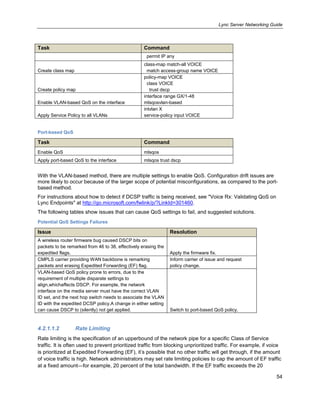
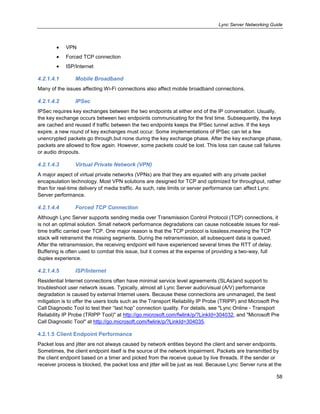
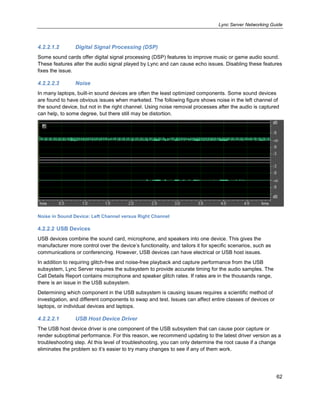
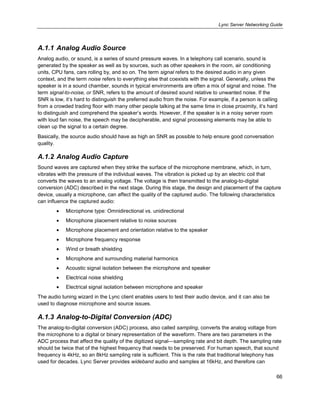
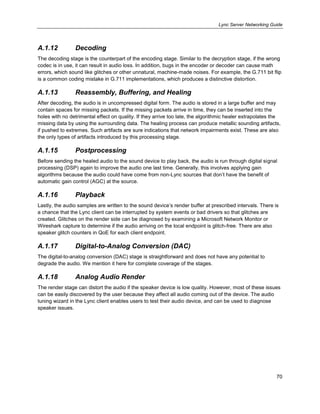
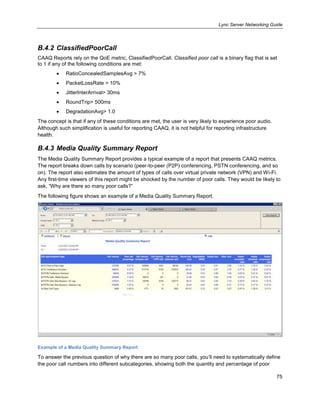
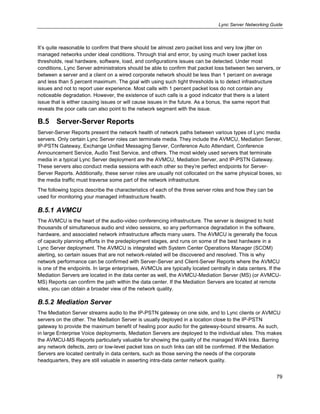
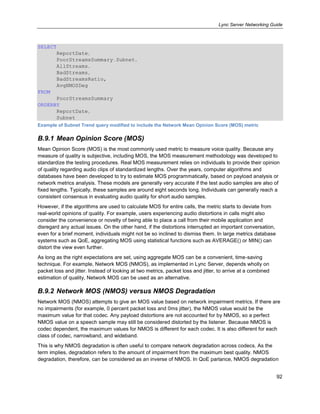
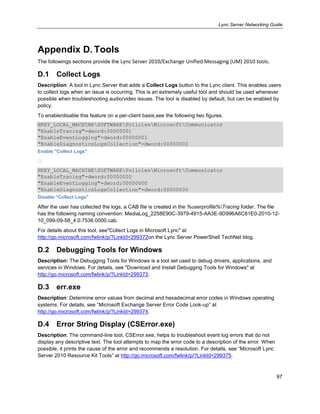
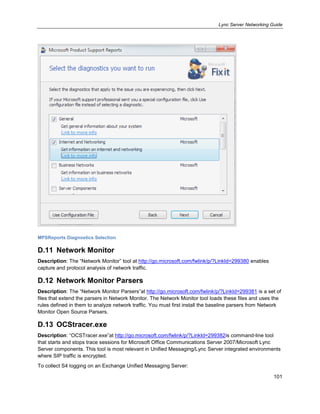
B.5.4 AVMCU-Mediation Server Report Example
The following example shows an AVMCU-MS Report.
USE QoEMetrics;
DECLARE @beginTime DateTime='2013-1-14';
DECLARE @endTime DateTime='2013-1-15';
WITH FullLyncJoinView AS
(
SELECT
s.ConferenceDateTime AS ConferenceDateTime
,s.StartTime AS StartTime
,s.SessionSeq AS SessionSeq
,a.StreamID AS StreamID
,CallerUA.UAType AS CallerUAType
,CalleeUA.UAType AS CalleeUAType
,CallerEP.Name AS CallerEndpoint
,CalleeEP.Name AS CalleeEndpoint
,(casewhen (PacketLossRate > .01 OR PacketLossRateMax > .05)
then 1 elsenullend)AS IsBadStream
FROM [Session] s WITH (NOLOCK)
INNERJOIN [MediaLine] AS m WITH (NOLOCK)ON
m.ConferenceDateTime = s.ConferenceDateTime
AND m.SessionSeq = s.SessionSeq
INNERJOIN [AudioStream] AS a WITH (NOLOCK)ON
a.MediaLineLabel = m.MediaLineLabel
and a.ConferenceDateTime = m.ConferenceDateTime
and a.SessionSeq = m.SessionSeq
INNERJOIN [UserAgent] AS CallerUA WITH (NOLOCK)ON
CallerUA.UserAgentKey = s.CallerUserAgent
INNERJOIN [UserAgent] AS CalleeUA WITH (NOLOCK)ON
CalleeUA.UserAgentKey = s.CalleeUserAgent
INNERJOIN [Endpoint] AS CallerEP WITH (NOLOCK)ON
CallerEP.EndpointKey = s.CallerEndpoint
INNERJOIN [Endpoint] AS CalleeEP WITH (NOLOCK)ON
CalleeEP.EndpointKey = s.CalleeEndpoint
WHERE
AND s.StartTime >=(@beginTime)AND s.StartTime <(@endTime)
and CallerUA.UAType in(1, 2)
and CalleeUA.UAType in(1, 2)
)
,AllVOIPStreams AS](https://image.slidesharecdn.com/networkingguidelyncserver-130615083542-phpapp02/85/Networking-guide-lync_server-88-320.jpg)
![Lync Server Networking Guide
83
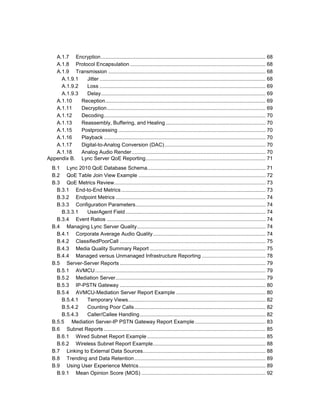
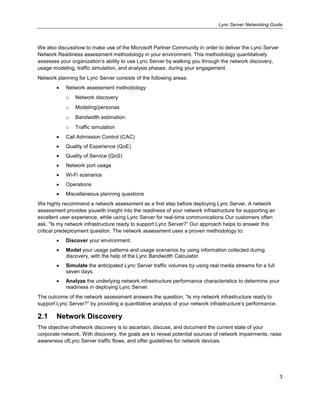
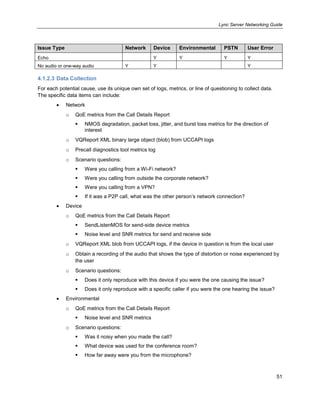
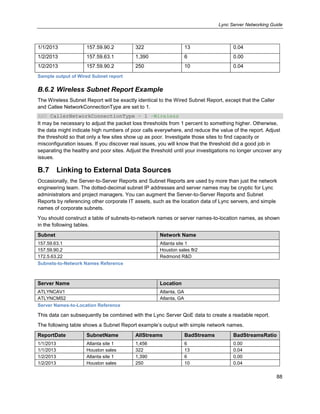
and User Agent Types, as well as for IP and subnet addresses, you can remap them to any of these
configuration parameters, as needed. The Subnet Reports (query) does exactly that—calls are
normalized to the subnet by location. In fact, the other endpoint is not even exposed, because you only
need to focus on the subnet in question.
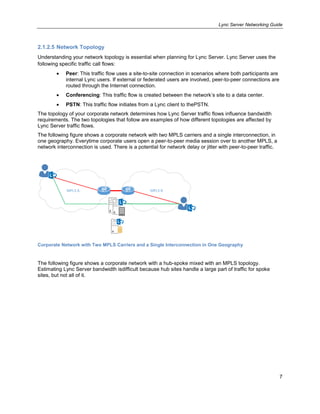
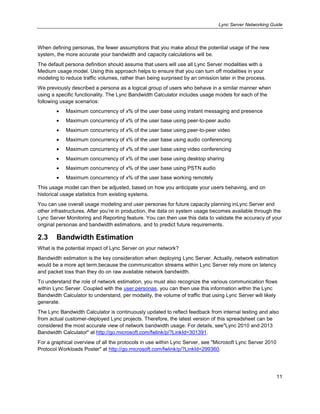
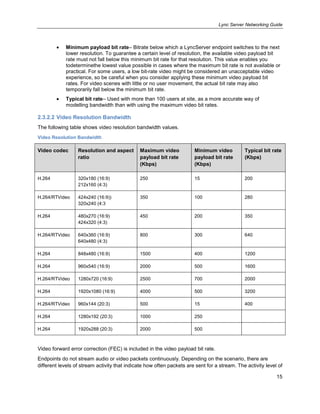
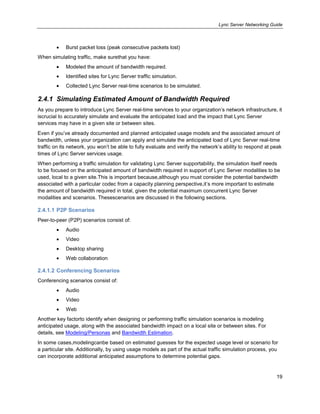
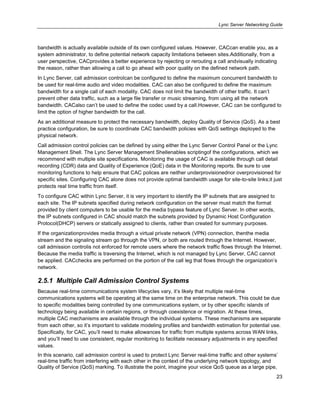
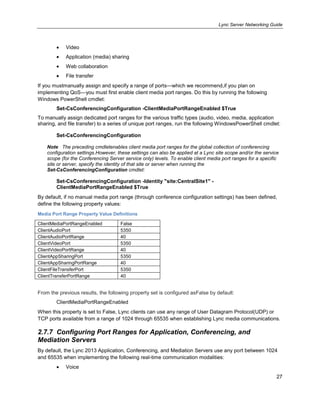
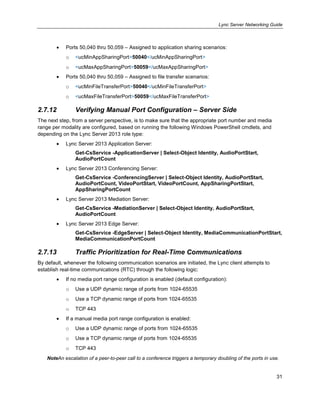
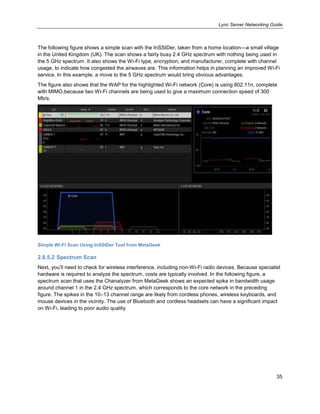
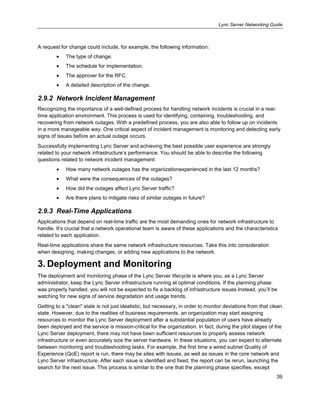
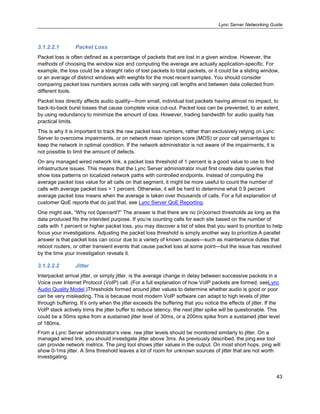
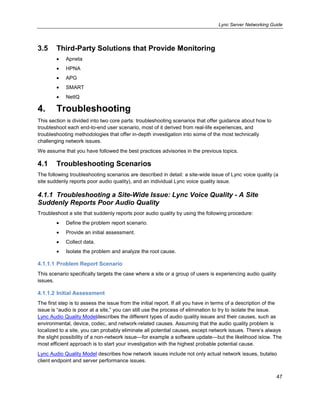
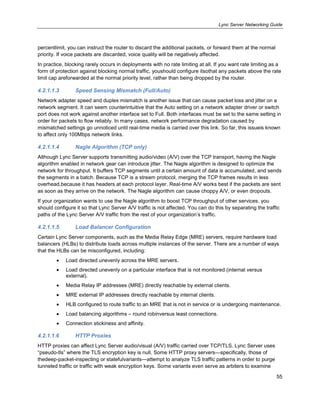
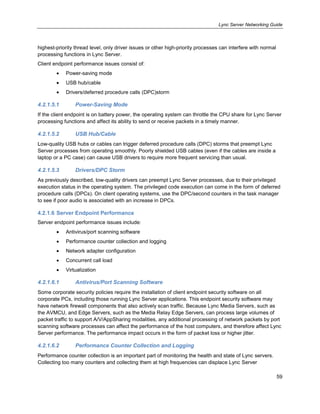
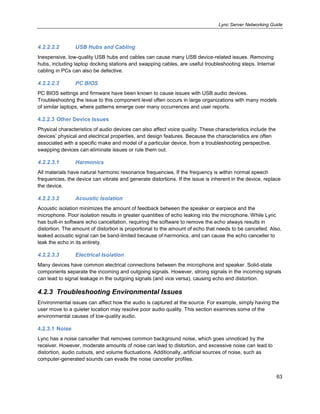
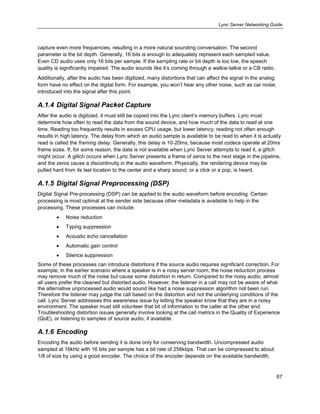
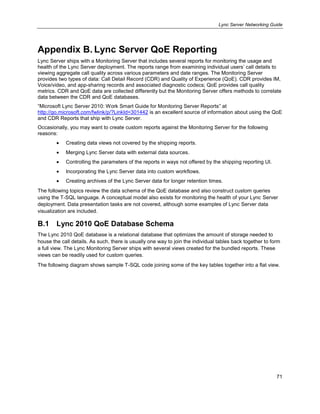
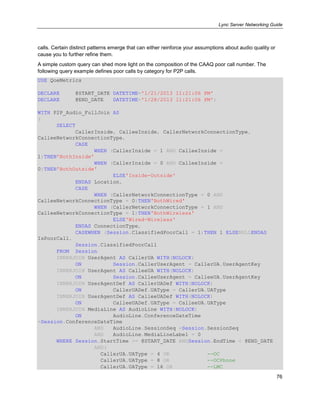
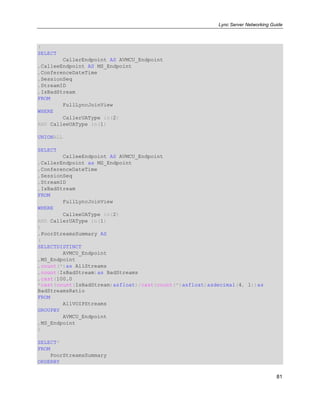
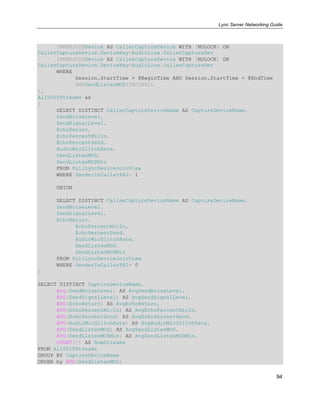
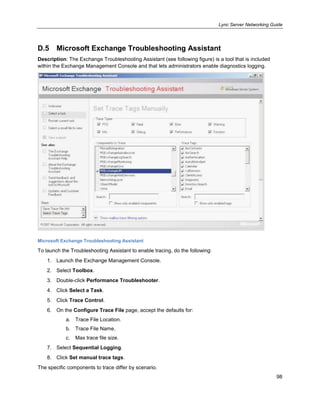
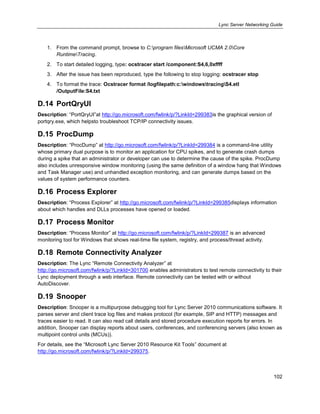
B.5.5 Mediation Server-IP PSTN Gateway Report Example
The following example shows a Mediation Server-IP PSTN Gateway Report.
USE QoEMetrics;
DECLARE @beginTime DateTime=‘1-1-2013';
DECLARE @endTime DateTime='2-1-2013';
WITH FullLyncJoinView AS
(
SELECT
s.ConferenceDateTime AS ConferenceDateTime
,s.StartTime AS StartTime
,s.SessionSeq AS SessionSeq
,a.StreamID AS StreamID
,CallerUA.UAType AS CallerUAType
,CalleeUA.UAType AS CalleeUAType
,CallerEP.Name AS CallerEndpoint
,CalleeEP.Name AS CalleeEndpoint
,(casewhen (PacketLossRate > .01 OR PacketLossRateMax > .05)
then 1 elsenullend)AS IsBadStream
FROM [Session] s WITH (NOLOCK)
INNERJOIN [MediaLine] AS m WITH (NOLOCK)ON
m.ConferenceDateTime = s.ConferenceDateTime
AND m.SessionSeq = s.SessionSeq
INNERJOIN [AudioStream] AS a WITH (NOLOCK)ON
a.MediaLineLabel = m.MediaLineLabel
and a.ConferenceDateTime = m.ConferenceDateTime
and a.SessionSeq = m.SessionSeq
INNERJOIN [UserAgent] AS CallerUA WITH (NOLOCK)ON
CallerUA.UserAgentKey = s.CallerUserAgent
INNERJOIN [UserAgent] AS CalleeUA WITH (NOLOCK)ON
CalleeUA.UserAgentKey = s.CalleeUserAgent
INNERJOIN [Endpoint] AS CallerEP WITH (NOLOCK)ON
CallerEP.EndpointKey = s.CallerEndpoint
INNERJOIN [Endpoint] AS CalleeEP WITH (NOLOCK)ON
CalleeEP.EndpointKey = s.CalleeEndpoint
WHERE
AND s.StartTime >=(@beginTime)AND s.StartTime <(@endTime)
and CallerUA.UAType in(1, 32769)
and CalleeUA.UAType in(1, 32769)
)
,AllVOIPStreams AS
(
SELECT](https://image.slidesharecdn.com/networkingguidelyncserver-130615083542-phpapp02/85/Networking-guide-lync_server-91-320.jpg)
![Lync Server Networking Guide
85
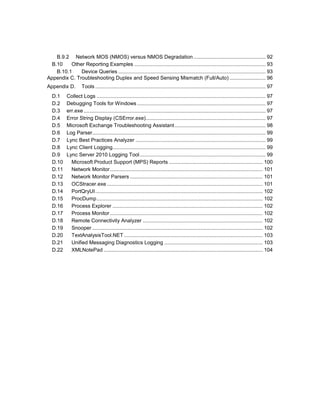
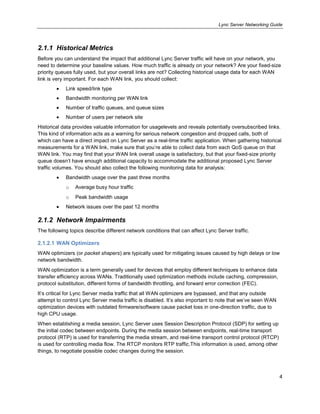
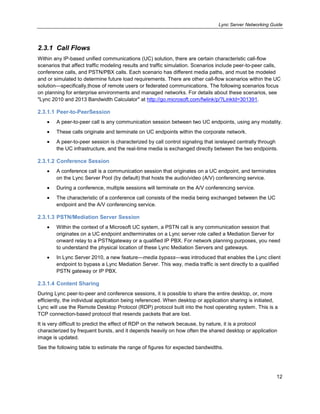
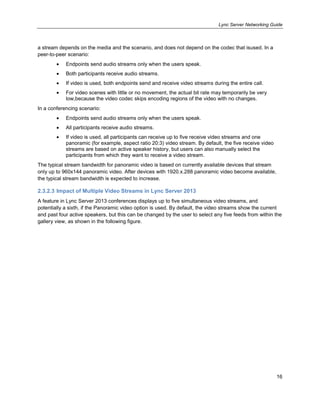
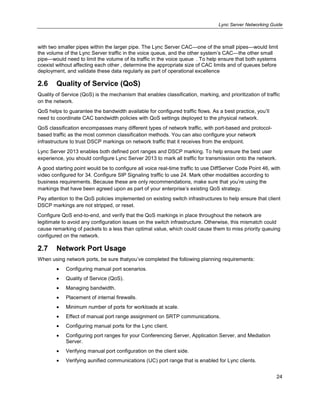
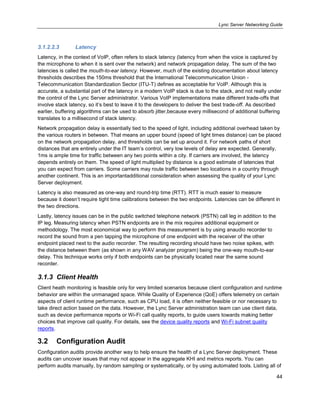
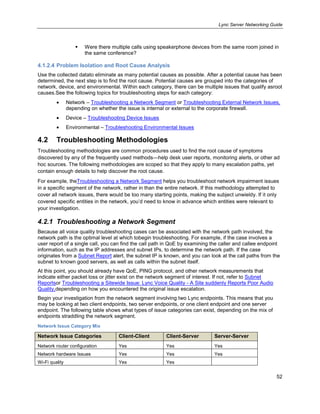
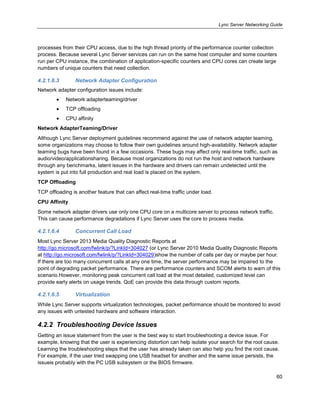
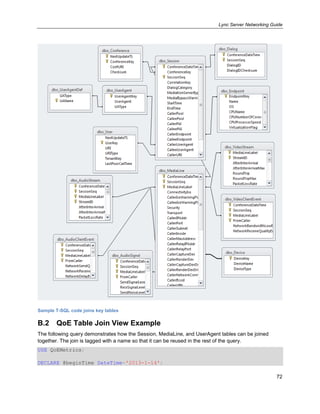
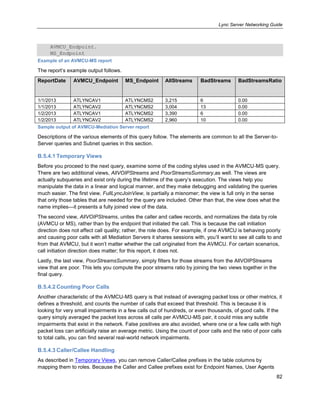
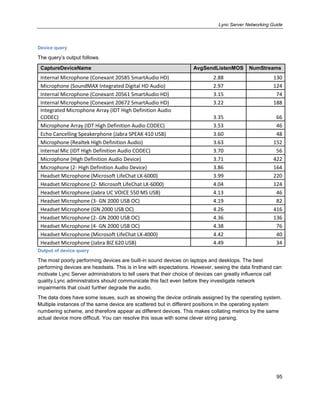
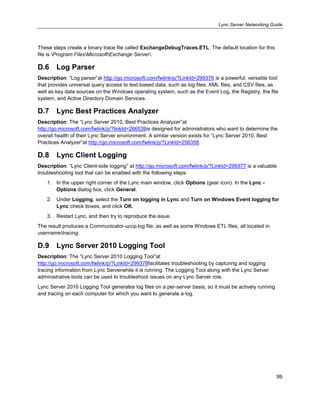
Example of a Mediation Server-IP PSTN Gateway report
The report’s example output follows.
ReportDate MS_Endpoint GW_Endpoint AllStreams BadStreams BadStreamsRatio
1/1/2013 ATLYNCMS2 ATLYNCMS2 1,279 6 0.00
1/1/2013 ATLYNCMS2 ATLYNCMS2 1,046 13 0.01
1/2/2013 ATLYNCMS2 ATLYNCMS2 1,340 6 0.00
1/2/2013 ATLYNCMS2 ATLYNCMS2 1,963 10 0.01
Sample output of Mediation Server-IP PSTN Gateway report
B.6 Subnet Reports
After the network and infrastructure health of the servers in a Lync Server data center has been
confirmed, you can monitor the health of individual user corporate subnets that terminate Lync A/V traffic.
Look only at calls between endpoints in a user subnet and a Lync media server. In other words, examine
only the conference calls and PSTN call logs between the client and the Mediation Server. Any degraded
network metrics can be attributed to the subnet or intermediaries in the path from the subnet to the Lync
media server.
The user subnets can be further divided into two types: wired subnets and wireless subnets. The division
is necessary because bundling wireless call metrics with wired call metrics creates too much noise. It’s
easy to assert that packet loss and jitter should be low from a wired client endpoint to a Lync Server
endpoint. After you’ve asserted wired subnet health, you can monitor any degraded network metrics in
wireless calls from the subnet that can be attributed to the wireless infrastructure of the site. This
systematic approach can produce strong, action-oriented troubleshooting workflows.
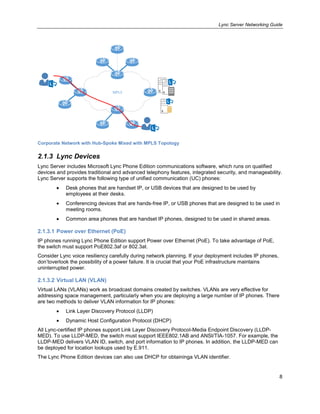
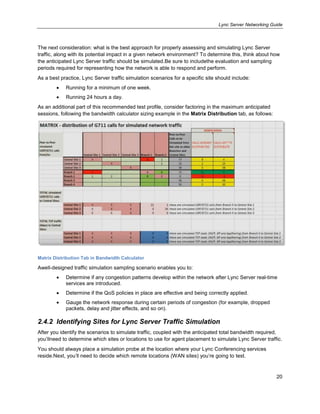
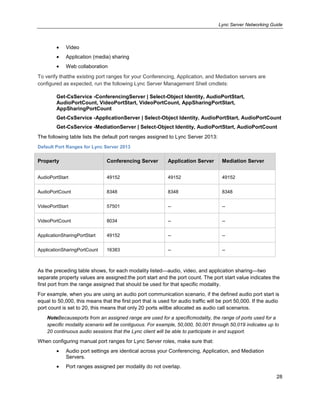
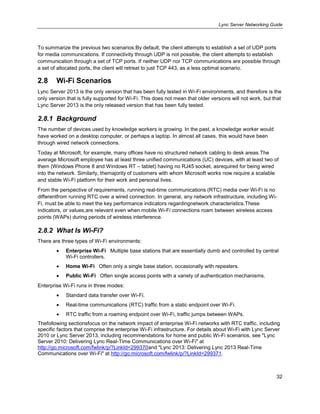
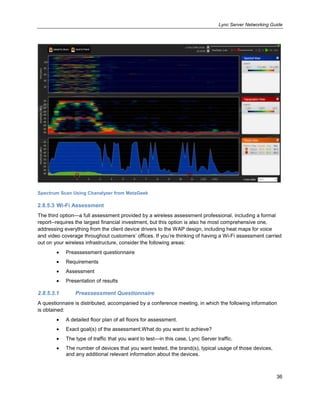
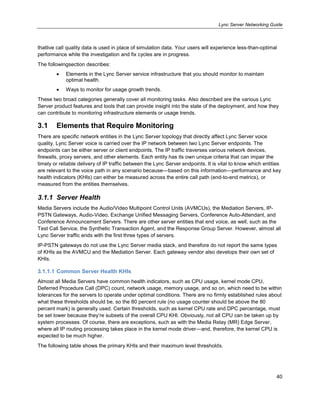
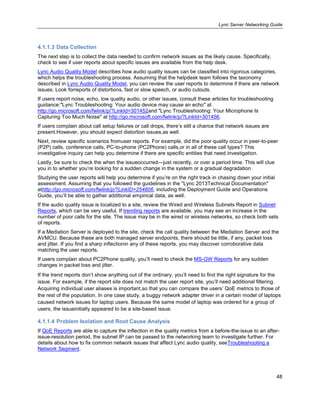
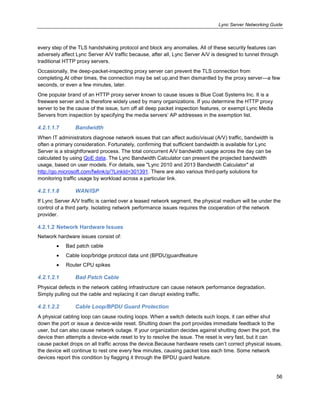
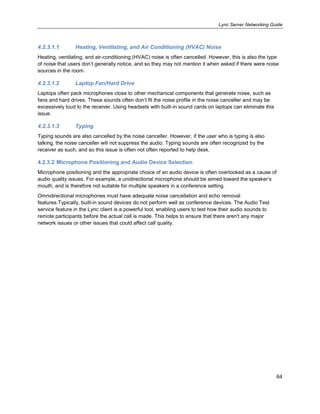
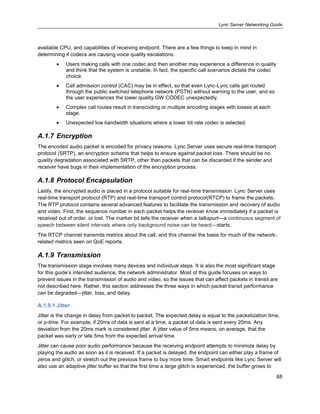
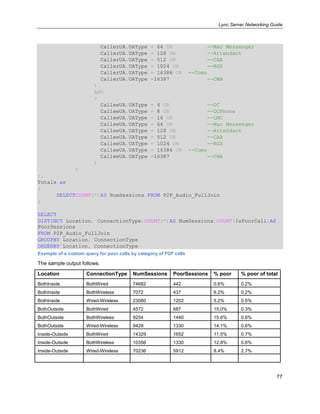
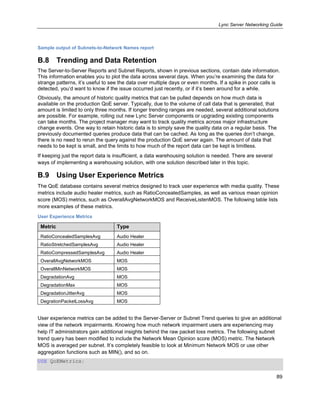
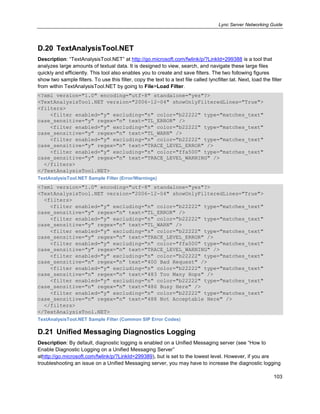
B.6.1 Wired Subnet Report Example
The following example shows a Wired Subnet Report.
USE QoEMetrics;
declare @beginTime datetime='2/1/2013';
declare @endTime datetime='1/1/2013';
WITH FullLyncJoinView AS
(
SELECT
s.ConferenceDateTime as ConferenceDateTime
,s.StartTime as StartTime
,s.SessionSeq as SessionSeq
,a.StreamID as StreamID
,CallerUA.UAType AS CallerUAType
,CalleeUA.UAType AS CalleeUAType
,m.CallerNetworkConnectionType AS CallerNetworkConnectionType
,m.CalleeNetworkConnectionType AS CalleeNetworkConnectionType
,dbo.pIPIntToString(m.CallerSubnet)AS CallerSubnet
,dbo.pIPIntToString(m.CalleeSubnet)AS CalleeSubnet
,(casewhen (PacketLossRate > .01 OR PacketLossRateMax > .05)then
1 elsenullend)AS IsBadStream
FROM [servername].[QoEMetrics].dbo.[Session] s WITH (NOLOCK)](https://image.slidesharecdn.com/networkingguidelyncserver-130615083542-phpapp02/85/Networking-guide-lync_server-93-320.jpg)
![Lync Server Networking Guide
86
INNERJOIN [servername].[QoEMetrics].dbo.[MediaLine] AS m WITH
(NOLOCK)ON
m.ConferenceDateTime = s.ConferenceDateTime
AND m.SessionSeq = s.SessionSeq
INNERJOIN [servername].[QoEMetrics].dbo.[AudioStream] AS A WITH
(NOLOCK)ON
a.MediaLineLabel = m.MediaLineLabel
and a.ConferenceDateTime = m.ConferenceDateTime
and a.SessionSeq = m.SessionSeq
INNERJOIN [servername].[QoEMetrics].dbo.UserAgent AS CallerUA
WITH (NOLOCK)ON
CallerUA.UserAgentKey = s.CallerUserAgent
INNERJOIN [servername].[QoEMetrics].dbo.UserAgent AS CalleeUA
WITH (NOLOCK)ON
CalleeUA.UserAgentKey = s.CalleeUserAgent
WHERE
s.StartTime >=(@beginTime)and s.StartTime <(@endTime)
and m.CallerInside = 1
and m.CalleeInside = 1
)
,AllVOIPStreams as
(
SELECT
CONVERT(DATETIME,
CONVERT(VARCHAR,DATEPART(MONTH, StartTime))+'/'+
CONVERT(VARCHAR,DATEPART(DAY, StartTime))+'/'+
CONVERT(VARCHAR,DATEPART(YEAR, StartTime)))AS ReportDate
,CallerSubnet As Subnet
,ConferenceDateTime
,SessionSeq
,StreamID
,IsBadStream
,CallerUAType as UA1 --for testing
,CalleeUAType as UA2
FROM
FullLyncJoinView
WHERE
CallerUAType = 4 --OC
AND CalleeUAType in(1,2)--MS, AVMCU
AND CallerNetworkConnectionType = 0 --Wired
UNIONALL
SELECT
CONVERT(DATETIME,
CONVERT(VARCHAR,DATEPART(MONTH, StartTime))+'/'+
CONVERT(VARCHAR,DATEPART(DAY, StartTime))+'/'+
CONVERT(VARCHAR,DATEPART(YEAR, StartTime)))AS ReportDate
,CalleeSubnet as Subnet
,ConferenceDateTime
,SessionSeq](https://image.slidesharecdn.com/networkingguidelyncserver-130615083542-phpapp02/85/Networking-guide-lync_server-94-320.jpg)
![Lync Server Networking Guide
90
declare @beginTime datetime='2/1/2013';
declare @endTime datetime='1/1/2013';
WITH FullLyncJoinView AS
(
SELECT
s.ConferenceDateTime as ConferenceDateTime
,s.StartTime as StartTime
,s.SessionSeq as SessionSeq
,a.StreamID as StreamID
,CallerUA.UAType AS CallerUAType
,CalleeUA.UAType AS CalleeUAType
,m.CallerNetworkConnectionType AS CallerNetworkConnectionType
,m.CalleeNetworkConnectionType AS CalleeNetworkConnectionType
,dbo.pIPIntToString(m.CallerSubnet)AS CallerSubnet
,dbo.pIPIntToString(m.CalleeSubnet)AS CalleeSubnet
,(casewhen (PacketLossRate > .01 OR PacketLossRateMax > .05)then
1 elsenullend)AS IsBadStream
,DegradationAvg
FROM [servername].[QoEMetrics].dbo.[Session] s WITH (NOLOCK)
INNERJOIN [servername].[QoEMetrics].dbo.[MediaLine] AS m WITH
(NOLOCK)ON
m.ConferenceDateTime = s.ConferenceDateTime
AND m.SessionSeq = s.SessionSeq
INNERJOIN [servername].[QoEMetrics].dbo.[AudioStream] AS a WITH
(NOLOCK)ON
a.MediaLineLabel = m.MediaLineLabel
and a.ConferenceDateTime = m.ConferenceDateTime
and a.SessionSeq = m.SessionSeq
INNERJOIN [servername].[QoEMetrics].dbo.UserAgent AS CallerUA
WITH (NOLOCK)ON
CallerUA.UserAgentKey = s.CallerUserAgent
INNERJOIN [servername].[QoEMetrics].dbo.UserAgent AS CalleeUA
WITH (NOLOCK)ON
CalleeUA.UserAgentKey = s.CalleeUserAgent
WHERE
s.StartTime >=(@beginTime)and s.StartTime <(@endTime)
and m.CallerInside = 1
and m.CalleeInside = 1
)
,AllVOIPStreams as
(
SELECT
CONVERT(DATETIME,
CONVERT(VARCHAR,DATEPART(MONTH, StartTime))+'/'+
CONVERT(VARCHAR,DATEPART(DAY, StartTime))+'/'+
CONVERT(VARCHAR,DATEPART(YEAR, StartTime)))AS ReportDate
,CallerSubnet As Subnet
,ConferenceDateTime
,SessionSeq
,StreamID](https://image.slidesharecdn.com/networkingguidelyncserver-130615083542-phpapp02/85/Networking-guide-lync_server-98-320.jpg)
![Lync Server Networking Guide
93
is represented by the DegradationAvg metric. The Avg suffix implies that the metric is an average of the
entire call.
B.10 Other Reporting Examples
The Server-Server and Subnet Trend queries previously described can provide views over the corporate
network segments. This leaves open other potential issue areas that can cause voice quality
impairments, such as poorly performing audio devices, or compromised home or public hotspots. The
following sections provide examples of QoE queries that can fill that gap.
B.10.1 Device Queries
The following query pulls all the devices used in calls in a 24-hour period. Similar devices are grouped
together, and the number of times they were used is tallied. The data is sorted by the SendListenMOS
metric. SendListenMOS is the payload MOS of the audio before the audio is sent on the network. This
means that the only factors that can contribute to the degradation of the audio are environmental or
device issues. With statistically large samples, you can rule out environmental effects, leaving device
issues as the main contributor of the degradation.
DECLARE @BeginTime as DateTime2 ='3/10/2013';
DECLARE @EndTime as DateTime2 =DATEADD(DAY, 1,@BeginTime);
USE QoEMetrics;
WITH FullLyncDeviceJoinView AS
(
SELECT
CallerCaptureDevice.DeviceName AS CallerCaptureDeviceName,
CalleeCaptureDevice.DeviceName as CalleeCaptureDeviceName,
SendNoiseLevel,
SendSignalLevel,
EchoReturn,
EchoPercentMicIn,
EchoPercentSend,
AudioMicGlitchRate,
SendListenMOS,
SendListenMOSMin,
SenderIsCallerPAI
FROM [Session]
INNERJOINMediaLine AS AudioLine WITH (NOLOCK) ON
AudioLine.ConferenceDateTime= Session.ConferenceDateTimeAND
AudioLine.SessionSeq= Session.SessionSeq
INNERJOINAudioStream WITH (NOLOCK) ON
AudioStream.ConferenceDateTime=AudioLine.ConferenceDateTimeAND
AudioStream.SessionSeq=AudioLine.SessionSeqAND
AudioStream.MediaLineLabel=AudioLine.MediaLineLabel
INNERJOINAudioSignal WITH (NOLOCK) ON
AudioSignal.ConferenceDateTime= Session.ConferenceDateTimeAND
AudioSignal.SessionSeq= Session.SessionSeqAND
AudioSignal.MediaLineLabel=AudioLine.MediaLineLabel](https://image.slidesharecdn.com/networkingguidelyncserver-130615083542-phpapp02/85/Networking-guide-lync_server-101-320.jpg)

This document provides a guide for planning, monitoring, and troubleshooting a network infrastructure to support Microsoft Lync Server 2013 communications software. It discusses phases for managing the network, including planning, deployment and monitoring, and troubleshooting. The planning phase involves tasks such as network discovery, modeling usage, estimating bandwidth needs, simulating traffic, and configuring quality of service, ports, and call admission control. The deployment and monitoring phase discusses elements to monitor like server health, network performance, and client health. It also addresses configuration auditing and trend reporting. The troubleshooting phase provides approaches for addressing issues at different scopes from site-wide to individual calls, and methodologies for troubleshooting various network, device, and environmental problems.


