Download to read offline


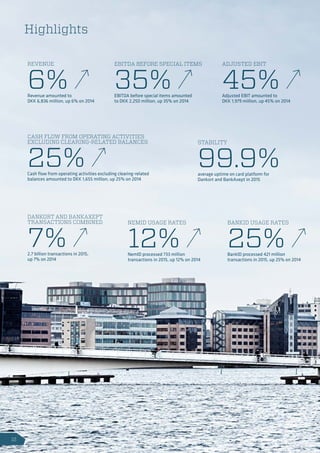


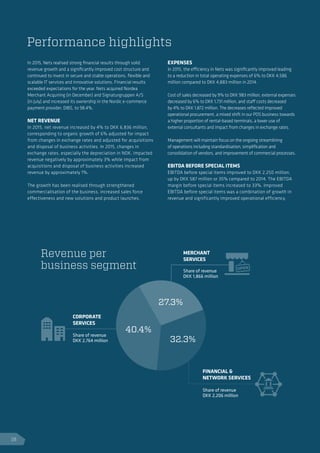


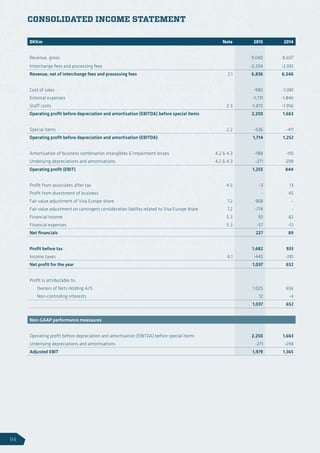


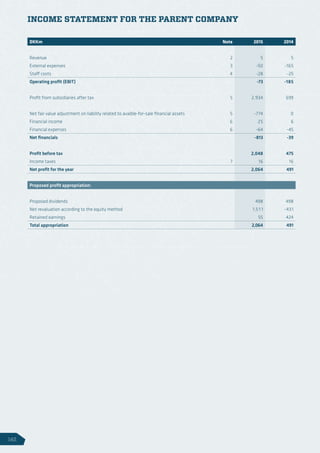


Nets realized strong financial results in 2015 through revenue growth and cost reductions. Net revenue increased 6% to DKK 6,836 million due to 6% organic growth. Expenses decreased due to improved operations. EBITDA before special items improved 35% to DKK 2,250 million and the margin increased to 33%. Adjusted EBIT increased 45% to DKK 1,979 million. Nets continued investing in operations and solutions while realizing growth and efficiencies.


![[WSO2Con EU 2017] Keynote: Digital Transformation in the Guise of a Regulatio...](https://cdn.slidesharecdn.com/ss_thumbnails/openbankingkeynoteseshikaedited-171107055615-thumbnail.jpg?width=640&height=640&fit=bounds)


![Noise Networks in Europe - Colin Nugent [en]](https://cdn.slidesharecdn.com/ss_thumbnails/colinnugenteng-110920044951-phpapp02-thumbnail.jpg?width=640&height=640&fit=bounds)


