Downloaded 162 times
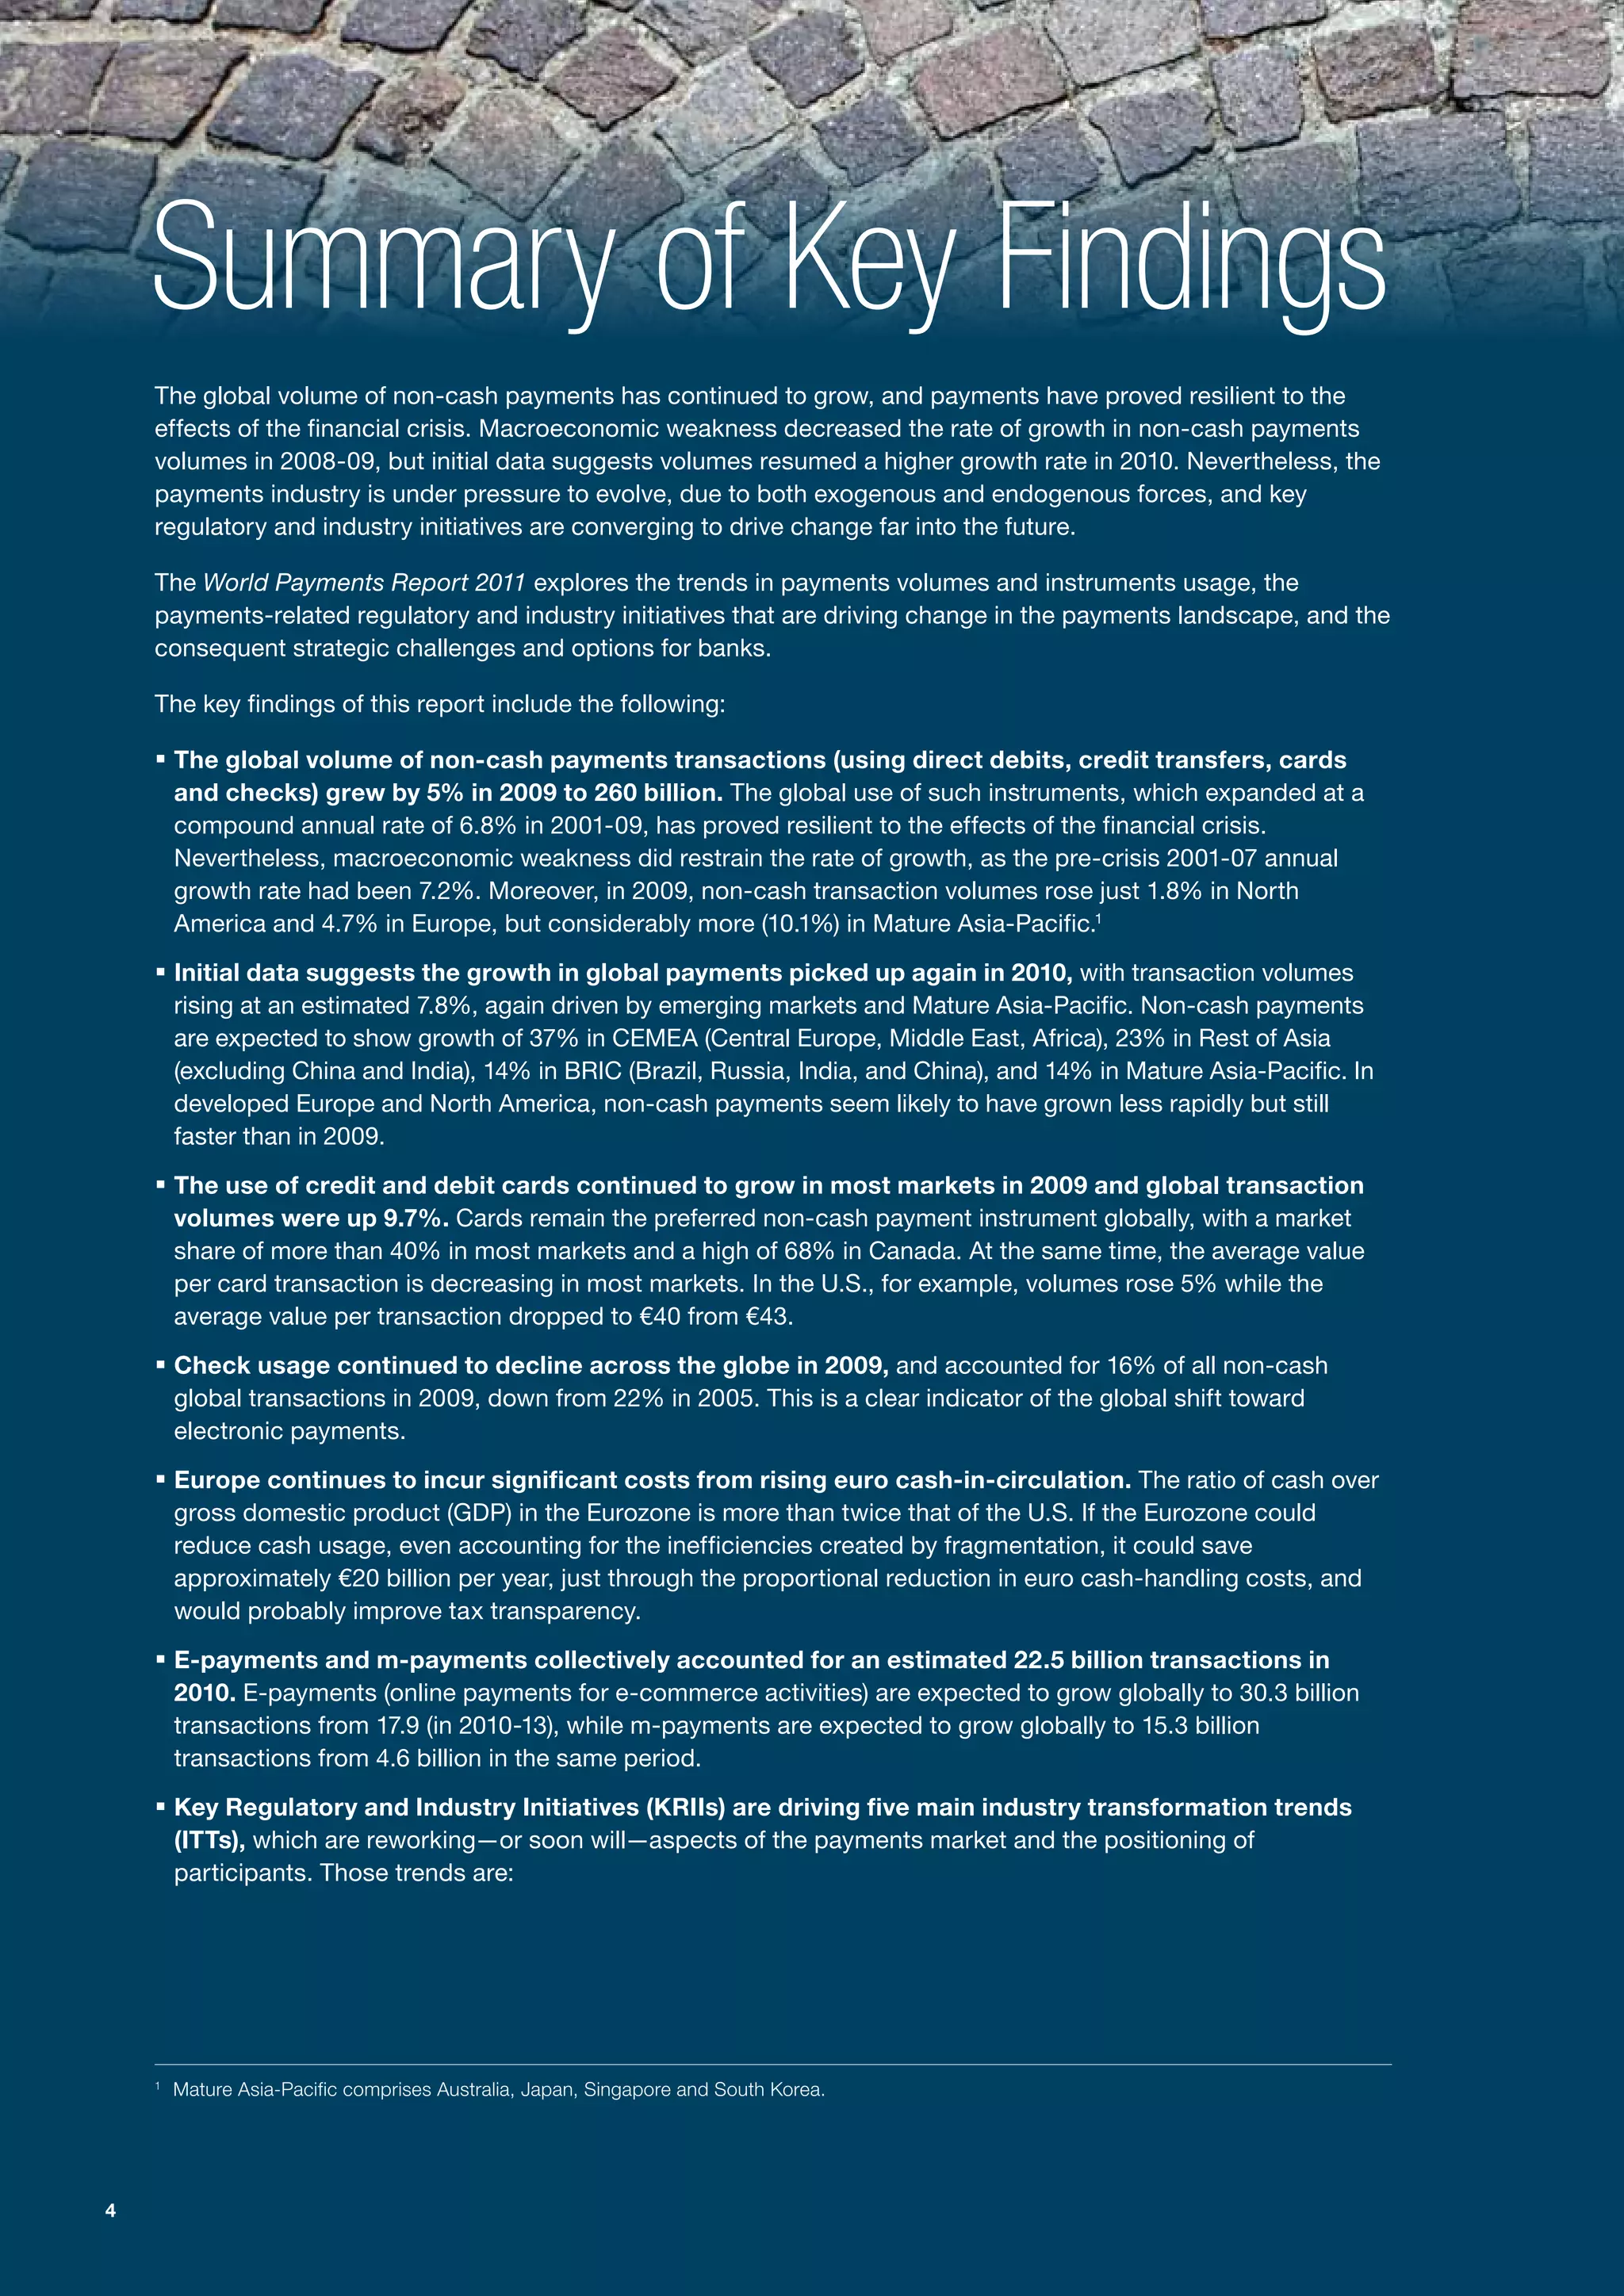


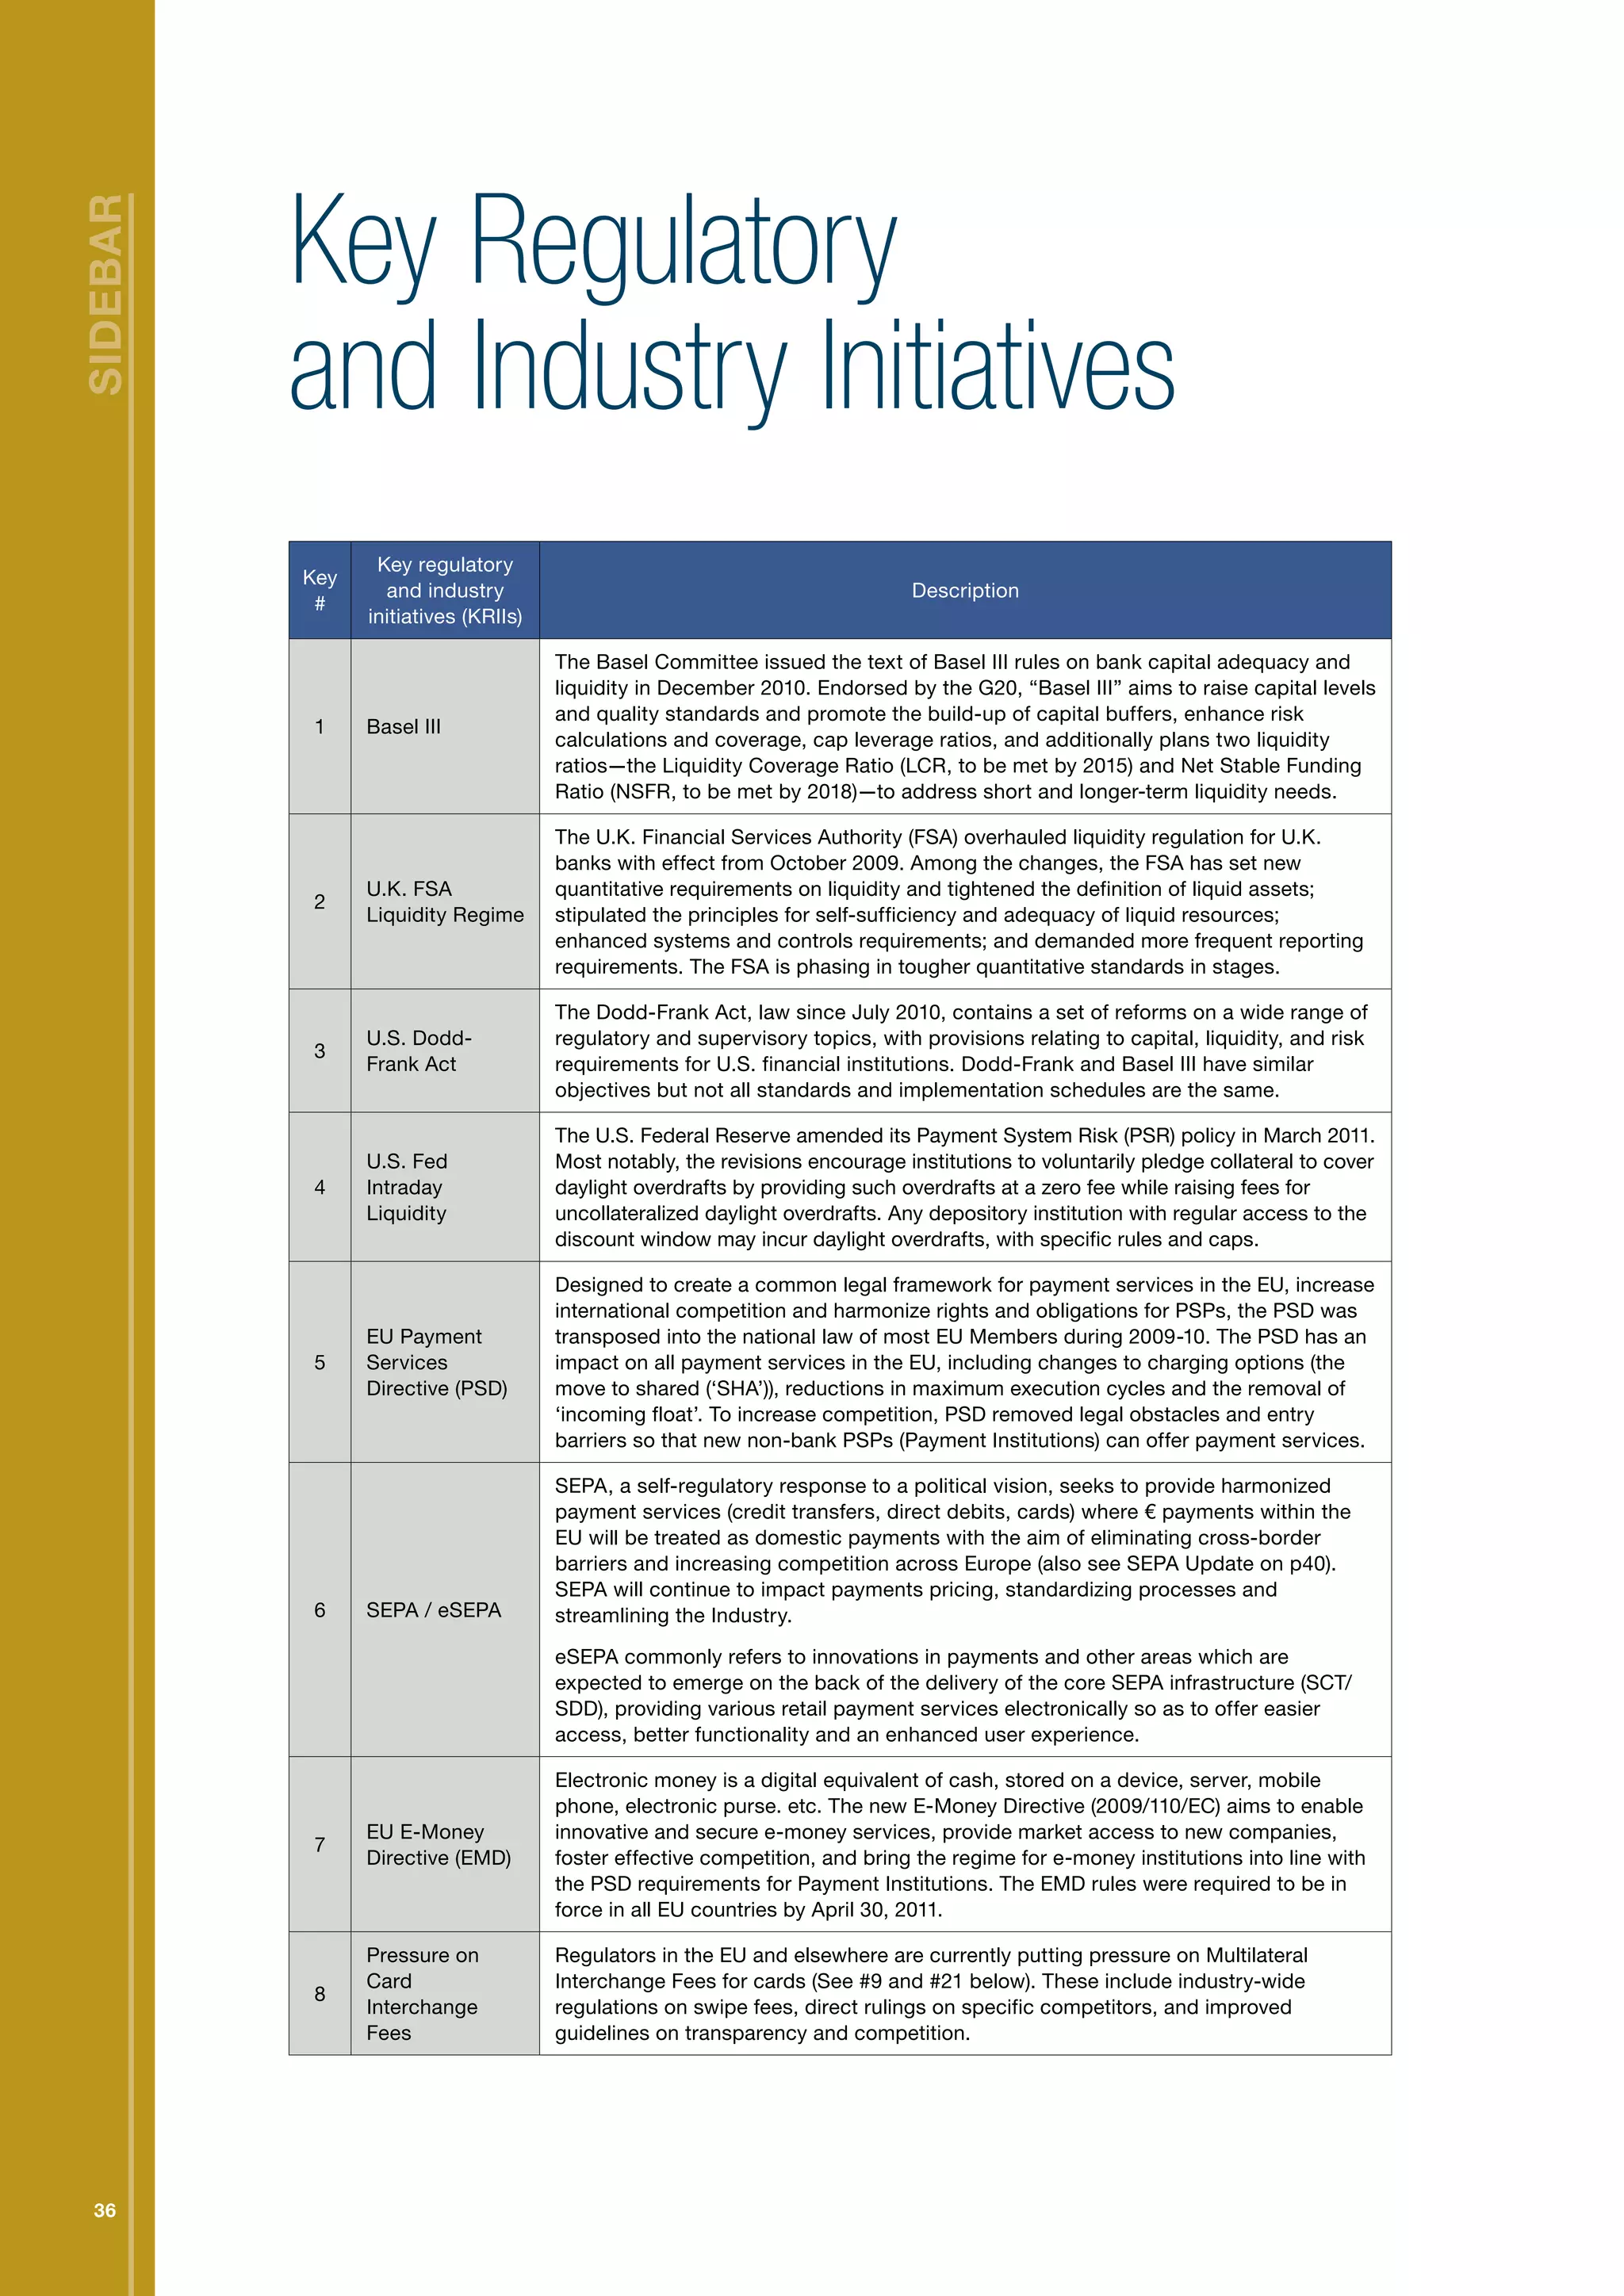
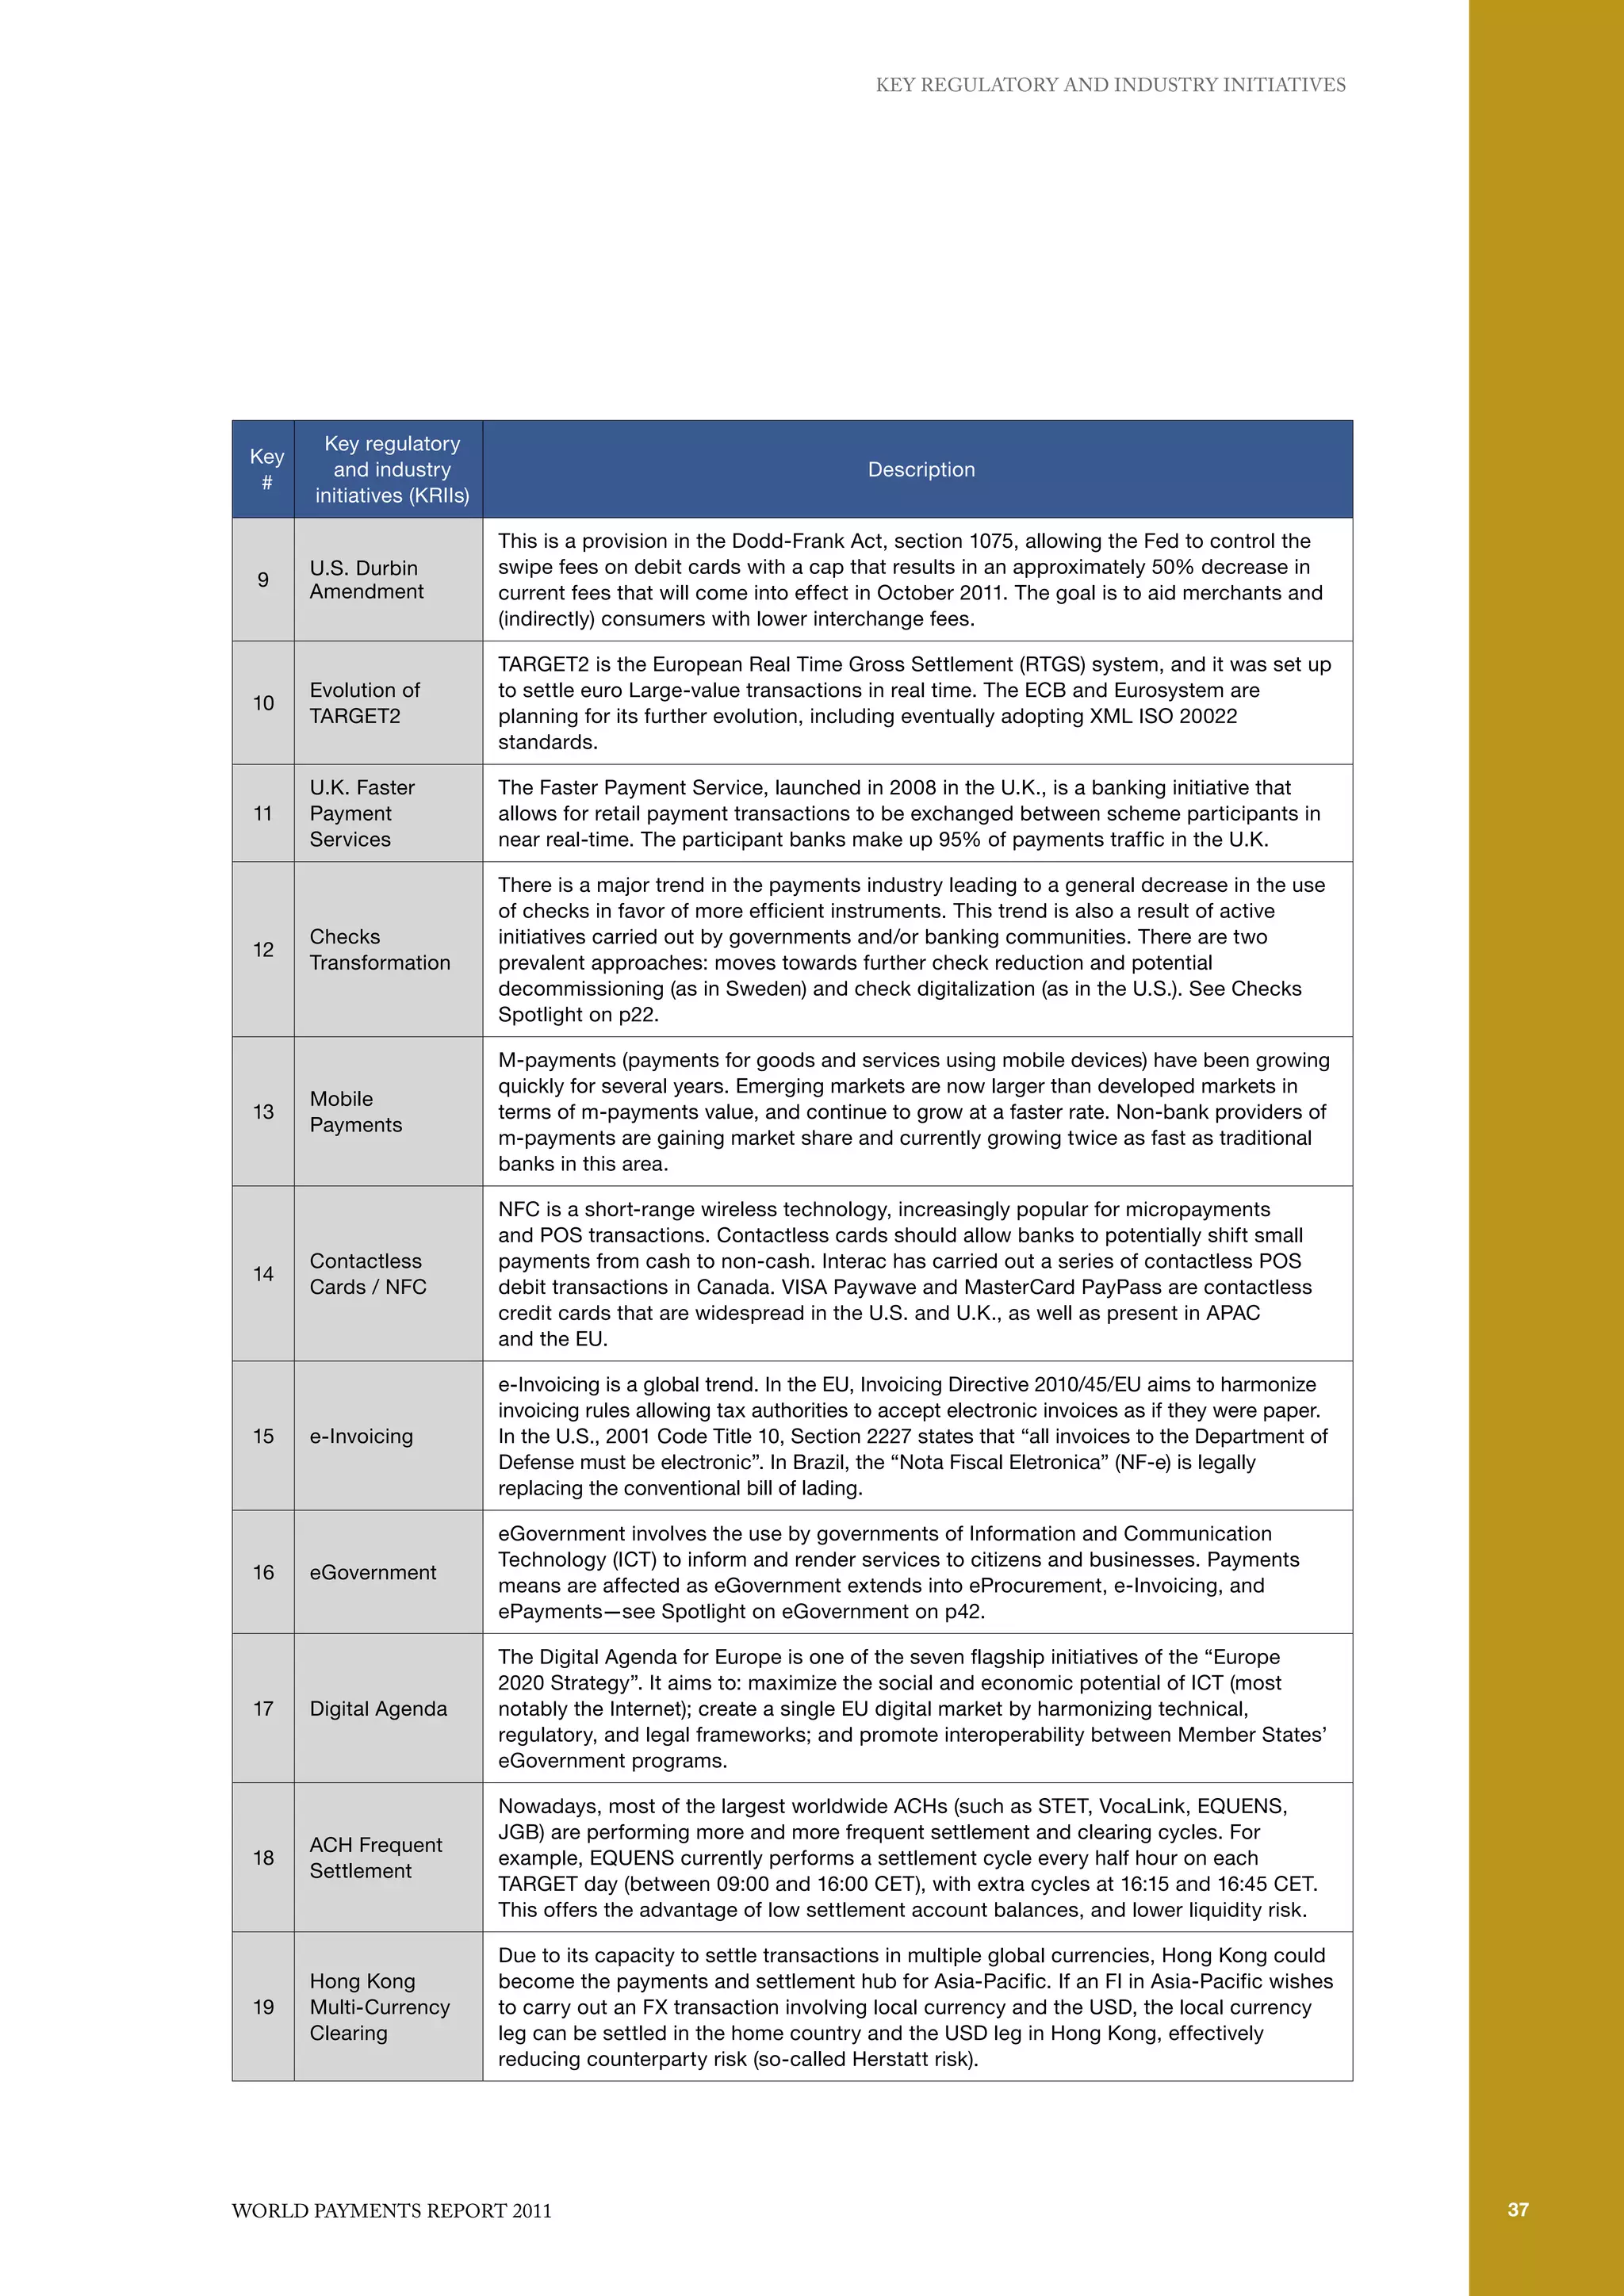
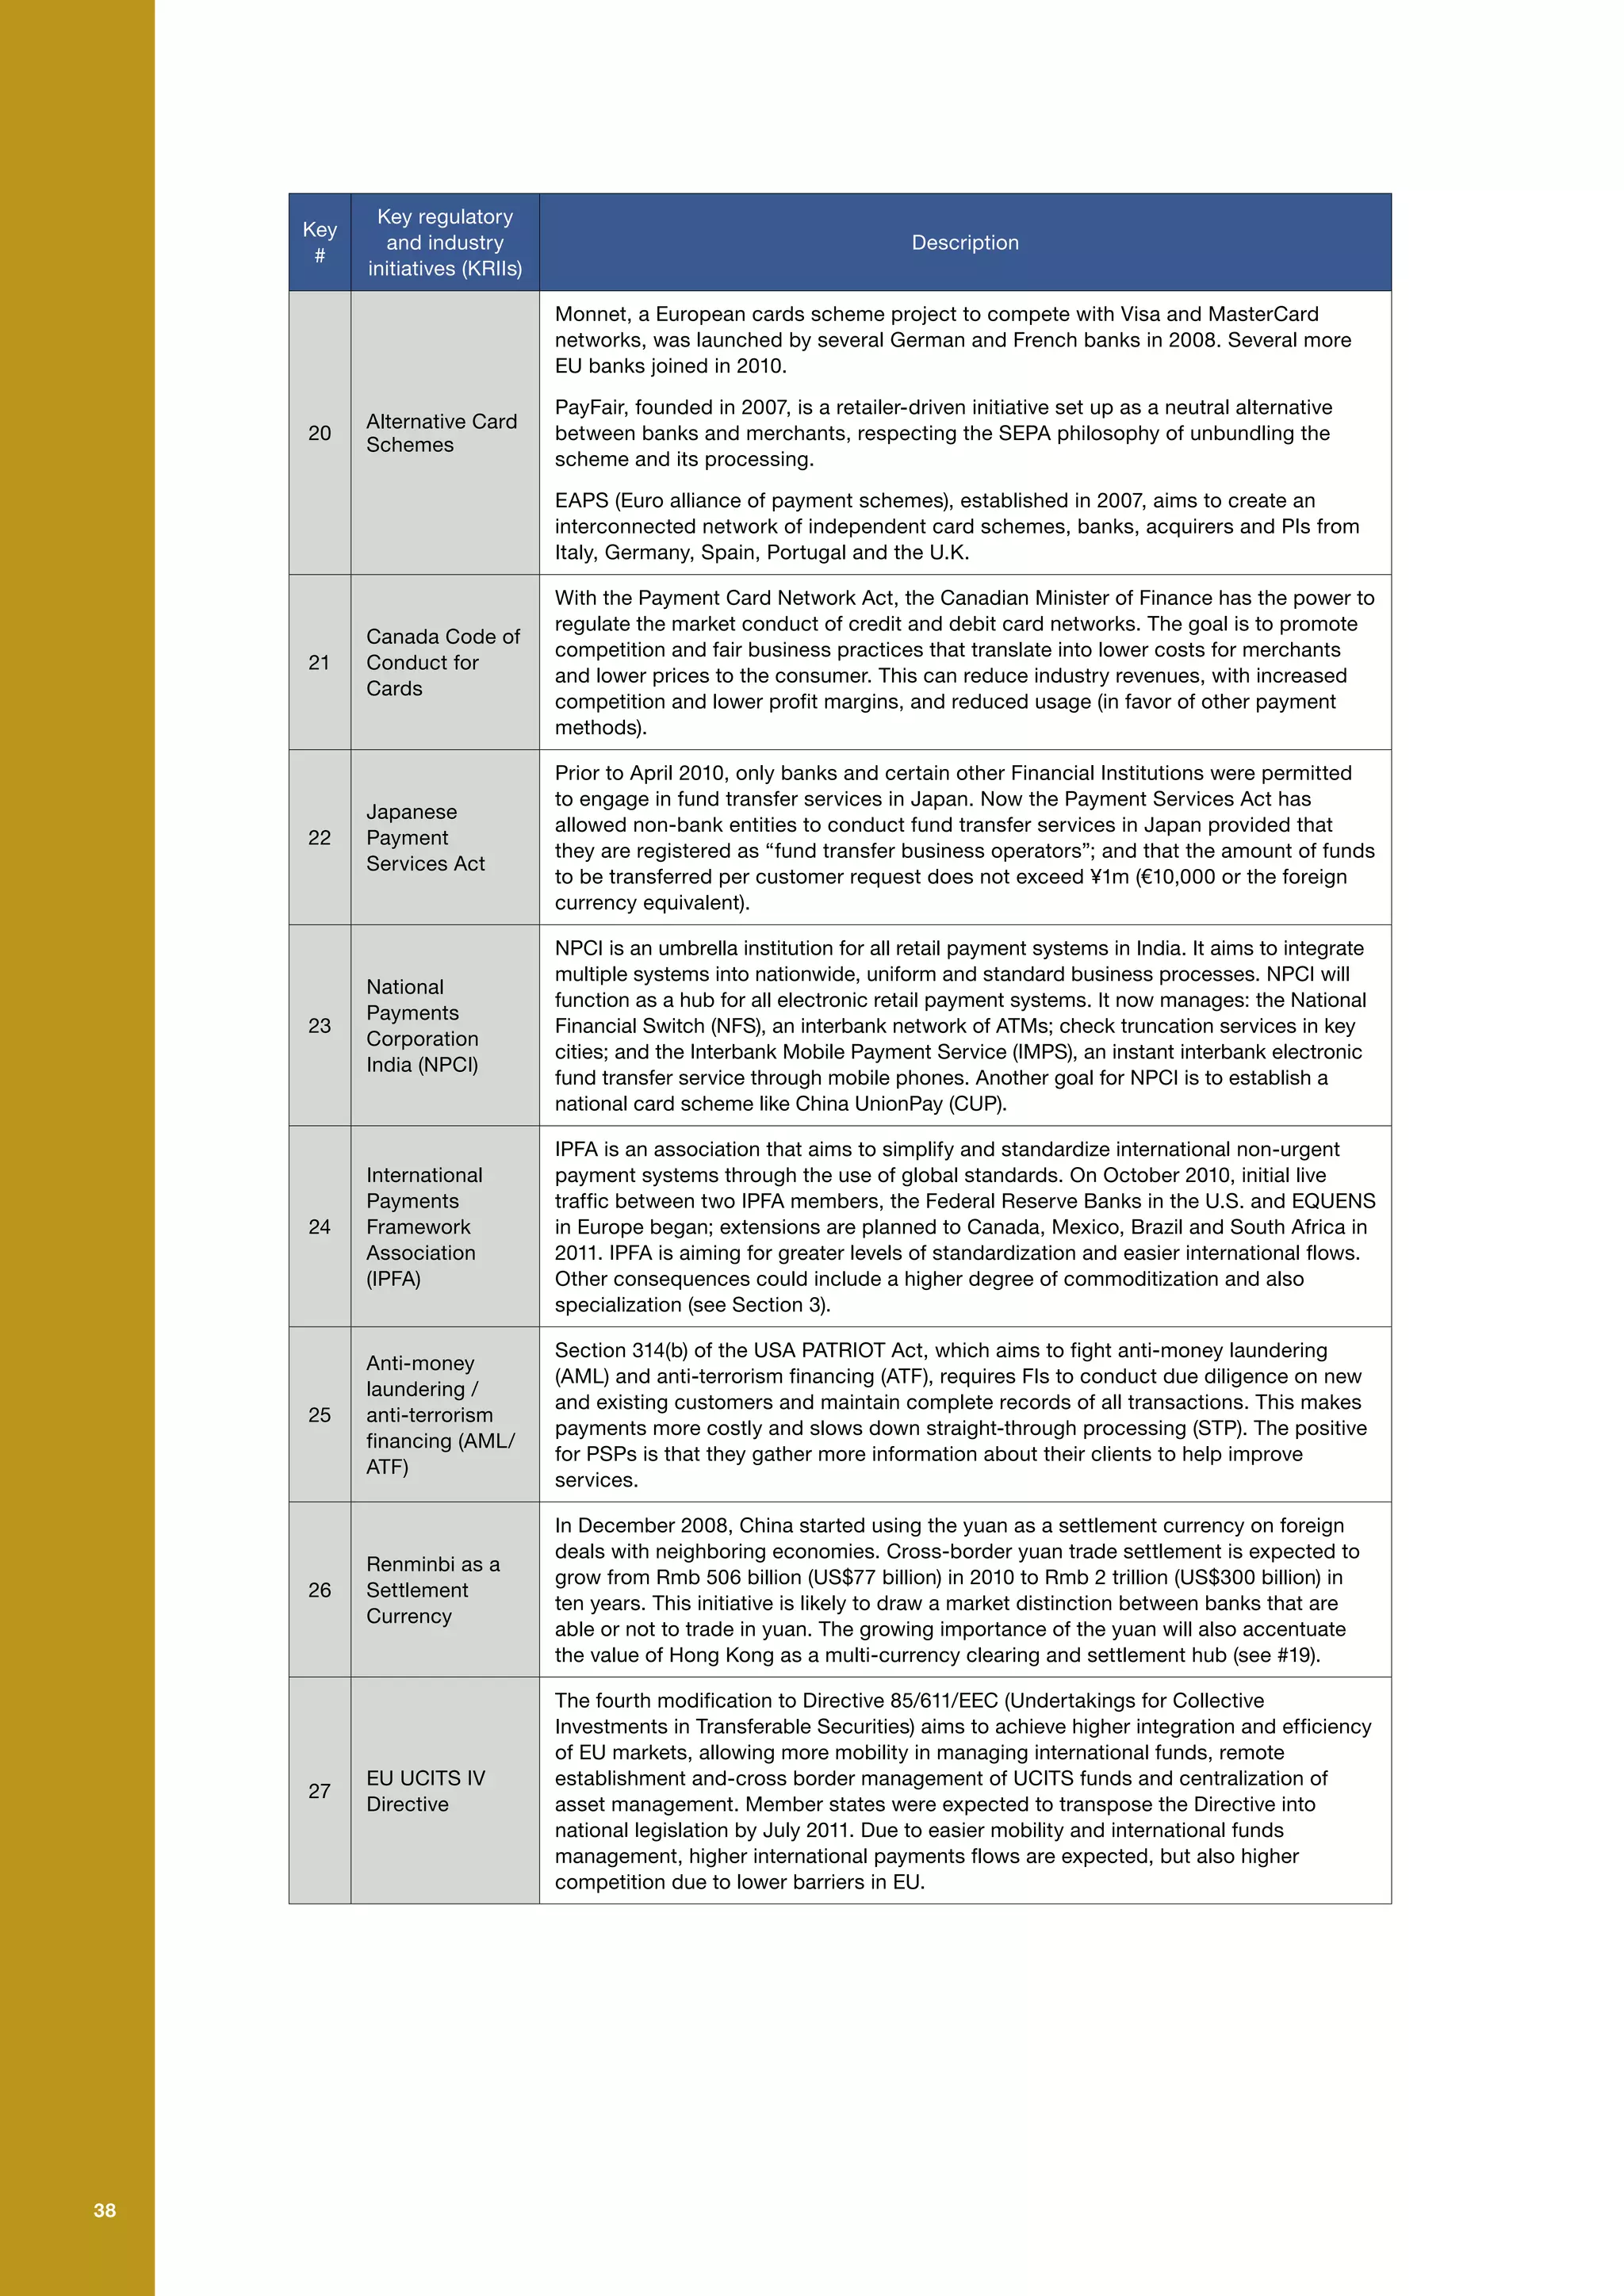
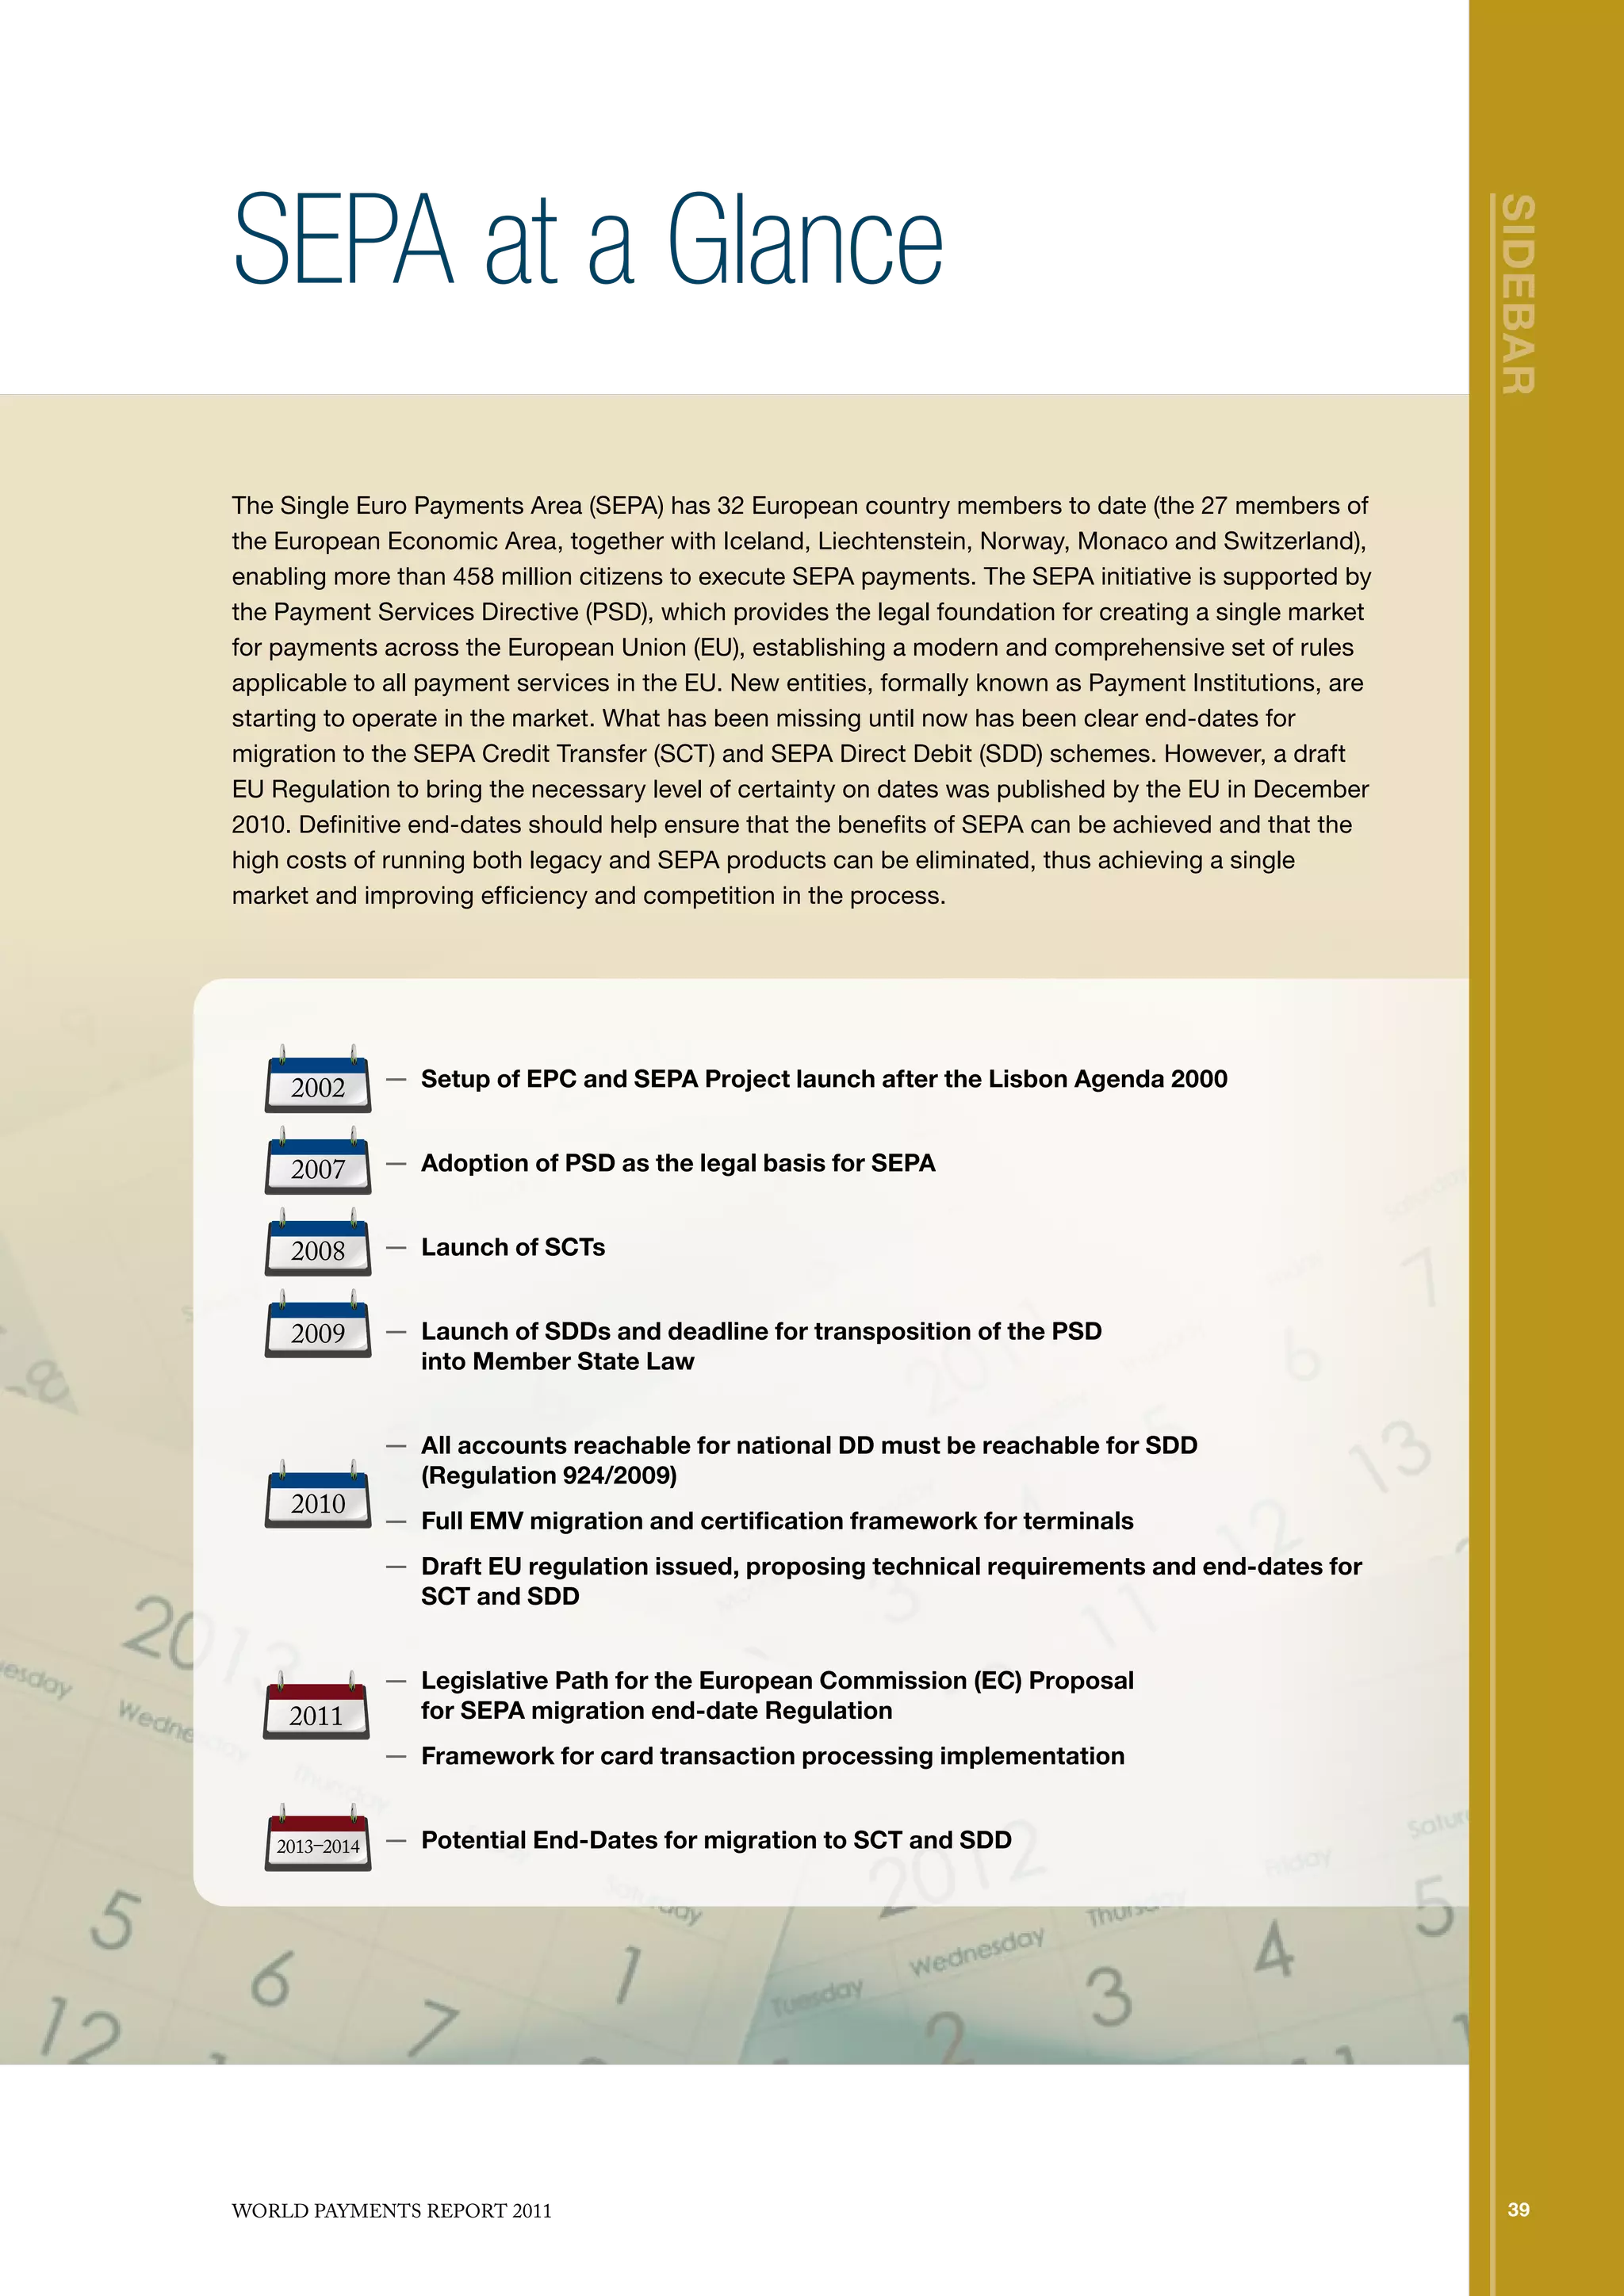


The document summarizes key findings from the World Payments Report 2011. It finds that global non-cash payments continued growing in 2009-2010, though at a slower rate during the economic crisis. Cards remain the most widely used non-cash instrument globally, while check usage is declining. Regulatory initiatives and industry standards are driving changes in the payments industry landscape around reducing systemic risk, increasing transparency, and standardizing processes. Emerging technologies also allow for specialization and innovation through tools like mobile payments.


![5.[63 76]analysis of the impact of interest rate on the net assets of multina...](https://cdn.slidesharecdn.com/ss_thumbnails/5-63-76analysisoftheimpactofinterestrateonthenetassetsofmultinationalbusinessinnigeria-111118181957-phpapp02-thumbnail.jpg?width=640&height=640&fit=bounds)


