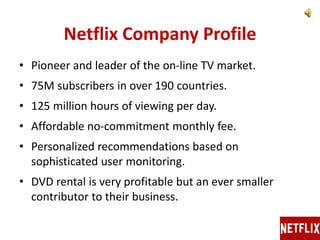
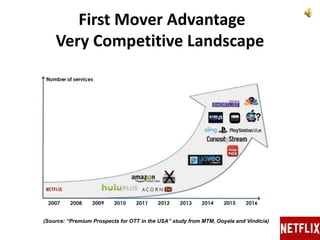
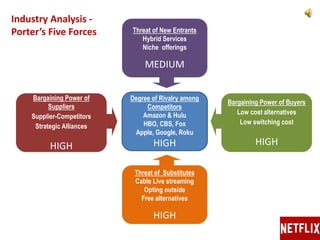
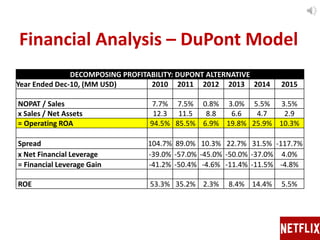
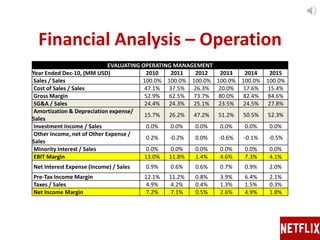
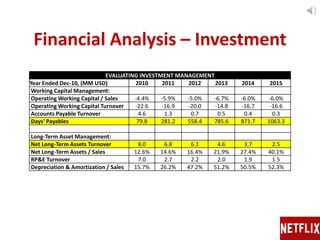
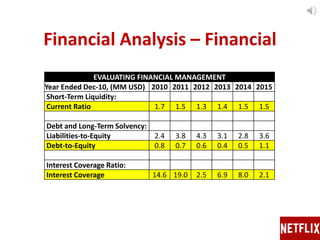
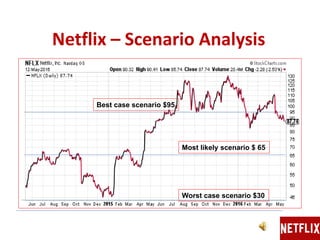
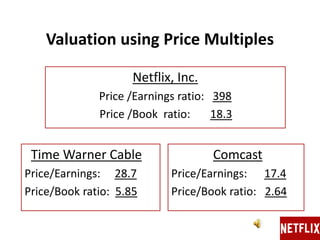
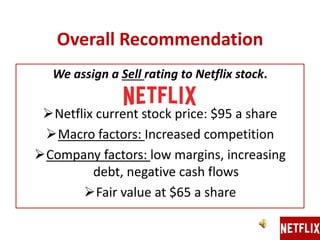
SlideShare a Scribd company logo
Analysis & Valuation
For MGMT E-2620, Prof. Dalko
TEAM - 10
Brian Schoenherr, Anirudh Udayashankar, Junyao Zhao, Alegra N Horne & Larry Montello
Netflix Company Profile
• Pioneer and leader of the on-line TV market.
• 75M subscribers in over 190 countries.
• 125 million hours of viewing per day.
• Affordable no-commitment monthly fee.
• Personalized recommendations based on
sophisticated user monitoring.
• DVD rental is very profitable but an ever smaller
contributor to their business.
First Mover Advantage
Very Competitive Landscape
(Source: “Premium Prospects for OTT in the USA” study from MTM, Ooyala and Vindicia)
Threat of New Entrants
Hybrid Services
Niche offerings
MEDIUM
Threat of Substitutes
Cable Live streaming
Opting outside
Free alternatives
HIGH
Bargaining Power of Buyers
Low cost alternatives
Low switching cost
HIGH
Bargaining Power of
Suppliers
Supplier-Competitors
Strategic Alliances
HIGH
Degree of Rivalry among
Competitors
Amazon & Hulu
HBO, CBS, Fox
Apple, Google, Roku
HIGH
Industry Analysis -
Porter’s Five Forces
Netflix Competitive Strategy
• 48% share, more than twice as big as the next
competitor (Amazon 20% and Hulu 10%).
• Differentiation Strategy: offering superior
content to the global video streaming market.
• Sophisticated monitoring capability to
understand their customers preferences and
select winning content.
Largest Opportunity for the US # 1 Online
TV provider is with the rest of the world
Netflix Corporate Strategy Analysis
• Three reportable segments: domestic streaming,
International streaming and Domestic DVD.
• Started with DVD rentals and built its knowledge of
(and tools to measure) winning content.
• Planned growth of customer base from 75M today to
150M by 2020.
• Primary investments:
– Global Expansion: Serving 190 countries world-wide
– $5B investment is developing their own content.
Strategy Analysis Conclusions
• Netflix is number 1 in video streaming and are
making investments to maintain their market
leadership.
• NFLX stock is trading at a very high premium over
what might be predicted with fundamental analysis.
This is typical of a market leader in a new emerging
high tech market.
• We predict Netflix will regress to the market growth
rate of 20% and face higher content and delivery
costs as they expand internationally.
Netflix – Accounting Analysis
• Revenue stream: Subscription fees only
– No advertising revenue
• Asset Recognition
– Library of DVD and streaming content
– Global network
– Mostly straight line amortization - discretionary
Netflix – Accounting Analysis
• Liabilities recognition: Subscription fees only
– Fixed costs for content licensing v/s variable subscription
fees; gross margin liabilities
– Future contracts of $6.1 billion – currently discussed, but
unaccounted for
– Growing international business – exchange rate volatility
• -$331 million impact in 2015
Netflix – Accounting Analysis
• Opinion
– Detailed MD&A
– Accounting reflective of:
• Future growth potential
• Inherent customer acquisition risks
• Impact of technological changes
Financial Analysis – Ratio Analysis
Overall Profitability
Year Ended 2010 2011 2012 2013 2014 2015
ROE 53.3% 35.2% 2.3% 8.4% 14.4% 5.5%
ROA 15.8% 7.4% 0.4% 2.1% 3.8% 1.2%
Financial Leverage 3.38 4.77 5.33 4.06 3.80 4.59
Sales and Net Income Growth
Year 2011 2012 2013 2014 2015
Sales Growth 48.2% 12.6% 21.2% 25.8% 23.2%
Net Income Growth 46.1% -92.4% 555.8% 137.3% -54.0%
Financial Analysis – DuPont Model
DECOMPOSING PROFITABILITY: DUPONT ALTERNATIVE
Year Ended Dec-10, (MM USD) 2010 2011 2012 2013 2014 2015
NOPAT / Sales 7.7% 7.5% 0.8% 3.0% 5.5% 3.5%
x Sales / Net Assets 12.3 11.5 8.8 6.6 4.7 2.9
= Operating ROA 94.5% 85.5% 6.9% 19.8% 25.9% 10.3%
Spread 104.7% 89.0% 10.3% 22.7% 31.5% -117.7%
x Net Financial Leverage -39.0% -57.0% -45.0% -50.0% -37.0% 4.0%
= Financial Leverage Gain -41.2% -50.4% -4.6% -11.4% -11.5% -4.8%
ROE 53.3% 35.2% 2.3% 8.4% 14.4% 5.5%
Financial Analysis – Operation
EVALUATING OPERATING MANAGEMENT
Year Ended Dec-10, (MM USD) 2010 2011 2012 2013 2014 2015
Sales / Sales 100.0% 100.0% 100.0% 100.0% 100.0% 100.0%
Cost of Sales / Sales 47.1% 37.5% 26.3% 20.0% 17.6% 15.4%
Gross Margin 52.9% 62.5% 73.7% 80.0% 82.4% 84.6%
SG&A / Sales 24.4% 24.3% 25.1% 23.5% 24.5% 27.8%
Amortization & Depreciation expense/
Sales
15.7% 26.2% 47.2% 51.2% 50.5% 52.3%
Investment Income / Sales 0.0% 0.0% 0.0% 0.0% 0.0% 0.0%
Other Income, net of Other Expense /
Sales
0.2% -0.2% 0.0% -0.6% -0.1% -0.5%
Minority Interest / Sales 0.0% 0.0% 0.0% 0.0% 0.0% 0.0%
EBIT Margin 13.0% 11.8% 1.4% 4.6% 7.3% 4.1%
Net Interest Expense (Income) / Sales 0.9% 0.6% 0.6% 0.7% 0.9% 2.0%
Pre-Tax Income Margin 12.1% 11.2% 0.8% 3.9% 6.4% 2.1%
Taxes / Sales 4.9% 4.2% 0.4% 1.3% 1.5% 0.3%
Net Income Margin 7.2% 7.1% 0.5% 2.6% 4.9% 1.8%
Financial Analysis – Investment
EVALUATING INVESTMENT MANAGEMENT
Year Ended Dec-10, (MM USD) 2010 2011 2012 2013 2014 2015
Working Capital Management:
Operating Working Capital / Sales -4.4% -5.9% -5.0% -6.7% -6.0% -6.0%
Operating Working Capital Turnover -22.6 -16.9 -20.0 -14.8 -16.7 -16.6
Accounts Payable Turnover 4.6 1.3 0.7 0.5 0.4 0.3
Days' Payables 79.8 281.2 558.4 785.6 871.7 1063.3
Long-Term Asset Management:
Net Long-Term Assets Turnover 8.0 6.8 6.1 4.6 3.7 2.5
Net Long-Term Assets / Sales 12.6% 14.6% 16.4% 21.9% 27.4% 40.1%
RP&E Turnover 7.0 2.7 2.2 2.0 1.9 1.5
Depreciation & Amortization / Sales 15.7% 26.2% 47.2% 51.2% 50.5% 52.3%
Financial Analysis – Financial
EVALUATING FINANCIAL MANAGEMENT
Year Ended Dec-10, (MM USD) 2010 2011 2012 2013 2014 2015
Short-Term Liquidity:
Current Ratio 1.7 1.5 1.3 1.4 1.5 1.5
Debt and Long-Term Solvency:
Liabilities-to-Equity 2.4 3.8 4.3 3.1 2.8 3.6
Debt-to-Equity 0.8 0.7 0.6 0.4 0.5 1.1
Interest Coverage Ratio:
Interest Coverage 14.6 19.0 2.5 6.9 8.0 2.1
Other Ratios
Year Ended Dec-10, (MM USD) 2010 2011 2012 2013 2014 2015
EBITDA Margin 28.7% 38.0% 48.6% 55.8% 57.8% 56.4%
Sustainable Growth Rate 53.3% 35.2% 2.3% 8.4% 14.4% 5.5%
Dividend policy: Netflix has not declared or paid any cash dividends, and has no
intention of paying cash dividends in the foreseeable future.
On July 14, 2015, Netflix exercised a 7:1 stock split in the form of a stock dividend
to all shareholders.
Financial Analysis – Other Ratios
(3,000)
(2,000)
(1,000)
0
1,000
2,000
3,000
4,000
5,000
6,000
7,000
8,000
FY 2010 FY 2011 FY 2012 FY 2013 FY 2014 FY 2015
Thousands
Revenue Operating Income Net income Free Cash Flow Net cash (used in) provided by operating activities
Cash Flow Analysis
Statement of Cash Flows
Year Ended Dec-10, (MM USD) 2010 2011 2012 2013 2014 2015
Net Income 160.85 226.13 17.15 112.40 266.80 122.64
After-tax net interest expense (income) 11.61 12.60 11.24 19.15 38.35 114.72
Non-operating losses (gains) -10.50 0.00 0.00 0.00 0.00 0.00
Long-term operating accruals -101.32 -1,487.96 -782.48 -808.22 -980.54 -2,207.38
Depreciation and amortization 340.07 839.62 1,702.08 2,241.68 2,781.80 3,547.05
Content expenses -441.39 -2,327.58 -2,484.56 -3,049.90 -3,762.34 -5,754.43
Operating cash flow before working capital investments $60.64 -$1,249.23 -$754.09 -$676.67 -$675.39 -$1,970.02
Net (investments in) or liquidation of operating working capital 227.37 1,579.55 788.09 793.65 730.22 1,335.30
Operating cash flow before investment in long-term assets $288.01 $330.32 $34.00 $116.98 $54.83 -$634.72
Net (investment in) or liquidation of operating long-term assets -116.09 -265.82 -245.91 -255.97 -42.87 -179.19
Free cash flow available to debt and equity $171.92 $64.50 -$211.91 -$138.99 $11.96 -$813.91
After-tax net interest expense (income) 11.61 12.60 11.24 19.15 38.35 114.72
Net debt (repayment) or issuance -1.78 195.98 -2.62 270.05 398.91 1,499.45
Free cash flow available to equity $158.53 $247.88 -$225.77 $111.91 $372.52 $570.82
Dividend (payments) 0.00 0.00 0.00 0.00 0.00 0.00
Net stock (repurchase), issuance, or other equity changes 49.78 219.56 3.66 124.56 67.62 95.61
Net increase (decrease) in cash balance $208.31 $467.44 -$222.11 $236.47 $440.14 $666.43
Baseline forecast –
Assumptions for current stock price $95.50
• Maintain sales growth > 25% per annum
• NOPAT Margin > 7.4% per annum
• Increase from 5.5 million subscribers (2015) to 15 million new
subscribers each year for 5 years.
•--------------------------------------------------------------------------------------------------------------------------------------------------------------------------------------------------------------------------------------------------
 Assumptions suggests Netflix can maintain its competitive
advantage in a very competitive industry.
 We think the current set of assumptions are unrealistic..
Netflix – Prospective Analysis
Netflix – Scenario Analysis
Best case scenario $95
Most likely scenario $ 65
Worst case scenario $30
Valuation using Price Multiples
Time Warner Cable
Price/Earnings: 28.7
Price/Book ratio: 5.85
Comcast
Price/Earnings: 17.4
Price/Book ratio: 2.64
Netflix, Inc.
Price /Earnings ratio: 398
Price /Book ratio: 18.3
Overall Recommendation
We assign a Sell rating to Netflix stock.
Netflix current stock price: $95 a share
Macro factors: Increased competition
Company factors: low margins, increasing
debt, negative cash flows
Fair value at $65 a share
The end…. Thank you.

More Related Content

What's hot

Netflix
Netflix Netflix
Netflix
Nova Granite
 
Netflix's Pricing Increase
Netflix's Pricing IncreaseNetflix's Pricing Increase
Netflix's Pricing Increase
Peggy Lim
 
Netflix Promotional Campaign
Netflix Promotional CampaignNetflix Promotional Campaign
Netflix Promotional Campaign
ashleyphenix
 
Strategy Analysis of NETFLIX
Strategy Analysis of NETFLIXStrategy Analysis of NETFLIX
Strategy Analysis of NETFLIX
Abhishek Sao
 
Netflix india
Netflix indiaNetflix india
Netflix india
abhishek trivedi
 
Netflix case study
Netflix case studyNetflix case study
Netflix case study
Lisandra Maioli
 
Netflix Business Model & Strategy
Netflix Business Model & StrategyNetflix Business Model & Strategy
Netflix Business Model & Strategy
Evgenii Gvozdev
 
Netflix Presentation
Netflix PresentationNetflix Presentation
Netflix Presentation
Laura Adkins
 
Netflix Case Presentation
Netflix Case PresentationNetflix Case Presentation
Netflix Case Presentation
Brett Miller
 
Netflix - Case Study
Netflix - Case StudyNetflix - Case Study
Netflix - Case Study
Srijan Dubey
 
Group case study assignment
Group case study assignmentGroup case study assignment
Group case study assignment
OlgaKovalchuk15
 
A Porter's Five Forces Analysis of Netflix
A Porter's Five Forces Analysis of NetflixA Porter's Five Forces Analysis of Netflix
A Porter's Five Forces Analysis of NetflixShannon Szabo-Pickering
 
The Netflix Marketing Plan Power Point
The Netflix Marketing Plan Power PointThe Netflix Marketing Plan Power Point
The Netflix Marketing Plan Power Point
Shawn McNail
 
Netflix International Business Strategy Plan
Netflix International Business Strategy PlanNetflix International Business Strategy Plan
Netflix International Business Strategy PlanIsabelle Smith
 
Netflix
NetflixNetflix
Netflix
Sapir Tal
 
Direct Marketing Netflix Presentation
Direct Marketing Netflix Presentation  Direct Marketing Netflix Presentation
Direct Marketing Netflix Presentation
JosephPapandrea
 

What's hot (20)

Netflix
Netflix Netflix
Netflix
 
Netflix's Pricing Increase
Netflix's Pricing IncreaseNetflix's Pricing Increase
Netflix's Pricing Increase
 
Netflix Promotional Campaign
Netflix Promotional CampaignNetflix Promotional Campaign
Netflix Promotional Campaign
 
Netflix Case Study
Netflix Case StudyNetflix Case Study
Netflix Case Study
 
Netflix Valuation
Netflix ValuationNetflix Valuation
Netflix Valuation
 
Strategy Analysis of NETFLIX
Strategy Analysis of NETFLIXStrategy Analysis of NETFLIX
Strategy Analysis of NETFLIX
 
Case Study Netflix
Case Study NetflixCase Study Netflix
Case Study Netflix
 
Netflix india
Netflix indiaNetflix india
Netflix india
 
Netflix case study
Netflix case studyNetflix case study
Netflix case study
 
Netflix Business Model & Strategy
Netflix Business Model & StrategyNetflix Business Model & Strategy
Netflix Business Model & Strategy
 
Netflix Presentation
Netflix PresentationNetflix Presentation
Netflix Presentation
 
Netflix Case Presentation
Netflix Case PresentationNetflix Case Presentation
Netflix Case Presentation
 
Netflix - Case Study
Netflix - Case StudyNetflix - Case Study
Netflix - Case Study
 
Group case study assignment
Group case study assignmentGroup case study assignment
Group case study assignment
 
Netflix
NetflixNetflix
Netflix
 
A Porter's Five Forces Analysis of Netflix
A Porter's Five Forces Analysis of NetflixA Porter's Five Forces Analysis of Netflix
A Porter's Five Forces Analysis of Netflix
 
The Netflix Marketing Plan Power Point
The Netflix Marketing Plan Power PointThe Netflix Marketing Plan Power Point
The Netflix Marketing Plan Power Point
 
Netflix International Business Strategy Plan
Netflix International Business Strategy PlanNetflix International Business Strategy Plan
Netflix International Business Strategy Plan
 
Netflix
NetflixNetflix
Netflix
 
Direct Marketing Netflix Presentation
Direct Marketing Netflix Presentation  Direct Marketing Netflix Presentation
Direct Marketing Netflix Presentation
 

Similar to NETFLIX Business Analysis & Valuation

FedEx Stock Presentation
FedEx Stock PresentationFedEx Stock Presentation
FedEx Stock PresentationAshwin Anant
 
Session 2 - Valuing a business
Session 2  - Valuing a businessSession 2  - Valuing a business
Session 2 - Valuing a business
Pontus Engstrom
 
4 q12 investor presentation
4 q12  investor presentation4 q12  investor presentation
4 q12 investor presentationBancoABCRI
 
Procter and Gamble Financial Report
Procter and Gamble Financial ReportProcter and Gamble Financial Report
Procter and Gamble Financial ReportElisa Reyes
 
Di Bacco Brochure Services PowerPoint
Di Bacco Brochure Services PowerPointDi Bacco Brochure Services PowerPoint
Di Bacco Brochure Services PowerPointJoe Mcgough
 
Google - Investment Analysis & Mgmt 120213 10pm v4 final
Google - Investment Analysis & Mgmt  120213 10pm v4 finalGoogle - Investment Analysis & Mgmt  120213 10pm v4 final
Google - Investment Analysis & Mgmt 120213 10pm v4 finalRichard Chan, MBA
 
P&g presentation
P&g presentationP&g presentation
P&g presentationElisa Reyes
 
Skyworks Presentation_Haley Large-Cap Fund
Skyworks Presentation_Haley Large-Cap FundSkyworks Presentation_Haley Large-Cap Fund
Skyworks Presentation_Haley Large-Cap Fund
Thao P Le
 
Skyworks
Skyworks Skyworks
Skyworks
Thao P Le
 
SFW - FOFA implications, Sum of parts valuation, possible acquirers
SFW - FOFA implications, Sum of parts valuation, possible acquirers SFW - FOFA implications, Sum of parts valuation, possible acquirers
SFW - FOFA implications, Sum of parts valuation, possible acquirers
George Gabriel
 
Financial services sector - implications of FOFA, possible acquires of SFW, S...
Financial services sector - implications of FOFA, possible acquires of SFW, S...Financial services sector - implications of FOFA, possible acquires of SFW, S...
Financial services sector - implications of FOFA, possible acquires of SFW, S...
George Gabriel
 
Sheet1NPV and IRR TemplateAssumptions & inputsrequired rate of re.docx
Sheet1NPV and IRR TemplateAssumptions & inputsrequired rate of re.docxSheet1NPV and IRR TemplateAssumptions & inputsrequired rate of re.docx
Sheet1NPV and IRR TemplateAssumptions & inputsrequired rate of re.docx
maoanderton
 
Excel Model of Trading Firm
Excel Model of Trading FirmExcel Model of Trading Firm
Excel Model of Trading Firm
Flevy.com Best Practices
 
Final Presentation Insight-2
Final Presentation Insight-2Final Presentation Insight-2
Final Presentation Insight-2Carl Schiro
 

Similar to NETFLIX Business Analysis & Valuation (20)

FedEx Stock Presentation
FedEx Stock PresentationFedEx Stock Presentation
FedEx Stock Presentation
 
Session 2 - Valuing a business
Session 2  - Valuing a businessSession 2  - Valuing a business
Session 2 - Valuing a business
 
1 h13 hci_eng
1 h13 hci_eng1 h13 hci_eng
1 h13 hci_eng
 
4 q12 investor presentation
4 q12  investor presentation4 q12  investor presentation
4 q12 investor presentation
 
09. lbo of aeropostale (deb sahoo)
09. lbo of aeropostale (deb sahoo)09. lbo of aeropostale (deb sahoo)
09. lbo of aeropostale (deb sahoo)
 
Procter and Gamble Financial Report
Procter and Gamble Financial ReportProcter and Gamble Financial Report
Procter and Gamble Financial Report
 
Di Bacco Brochure Services PowerPoint
Di Bacco Brochure Services PowerPointDi Bacco Brochure Services PowerPoint
Di Bacco Brochure Services PowerPoint
 
CAT_Equity Research
CAT_Equity ResearchCAT_Equity Research
CAT_Equity Research
 
Google - Investment Analysis & Mgmt 120213 10pm v4 final
Google - Investment Analysis & Mgmt  120213 10pm v4 finalGoogle - Investment Analysis & Mgmt  120213 10pm v4 final
Google - Investment Analysis & Mgmt 120213 10pm v4 final
 
P&g presentation
P&g presentationP&g presentation
P&g presentation
 
Cowen
CowenCowen
Cowen
 
Skyworks Presentation_Haley Large-Cap Fund
Skyworks Presentation_Haley Large-Cap FundSkyworks Presentation_Haley Large-Cap Fund
Skyworks Presentation_Haley Large-Cap Fund
 
Skyworks
Skyworks Skyworks
Skyworks
 
RJ
RJRJ
RJ
 
02. lbo of micron technologies (deb sahoo)
02. lbo of micron technologies (deb sahoo)02. lbo of micron technologies (deb sahoo)
02. lbo of micron technologies (deb sahoo)
 
SFW - FOFA implications, Sum of parts valuation, possible acquirers
SFW - FOFA implications, Sum of parts valuation, possible acquirers SFW - FOFA implications, Sum of parts valuation, possible acquirers
SFW - FOFA implications, Sum of parts valuation, possible acquirers
 
Financial services sector - implications of FOFA, possible acquires of SFW, S...
Financial services sector - implications of FOFA, possible acquires of SFW, S...Financial services sector - implications of FOFA, possible acquires of SFW, S...
Financial services sector - implications of FOFA, possible acquires of SFW, S...
 
Sheet1NPV and IRR TemplateAssumptions & inputsrequired rate of re.docx
Sheet1NPV and IRR TemplateAssumptions & inputsrequired rate of re.docxSheet1NPV and IRR TemplateAssumptions & inputsrequired rate of re.docx
Sheet1NPV and IRR TemplateAssumptions & inputsrequired rate of re.docx
 
Excel Model of Trading Firm
Excel Model of Trading FirmExcel Model of Trading Firm
Excel Model of Trading Firm
 
Final Presentation Insight-2
Final Presentation Insight-2Final Presentation Insight-2
Final Presentation Insight-2
 

Recently uploaded

State of ICS and IoT Cyber Threat Landscape Report 2024 preview
State of ICS and IoT Cyber Threat Landscape Report 2024 previewState of ICS and IoT Cyber Threat Landscape Report 2024 preview
State of ICS and IoT Cyber Threat Landscape Report 2024 preview
Prayukth K V
 
Knowledge engineering: from people to machines and back
Knowledge engineering: from people to machines and backKnowledge engineering: from people to machines and back
Knowledge engineering: from people to machines and back
Elena Simperl
 
PHP Frameworks: I want to break free (IPC Berlin 2024)
PHP Frameworks: I want to break free (IPC Berlin 2024)PHP Frameworks: I want to break free (IPC Berlin 2024)
PHP Frameworks: I want to break free (IPC Berlin 2024)
Ralf Eggert
 
Assuring Contact Center Experiences for Your Customers With ThousandEyes
Assuring Contact Center Experiences for Your Customers With ThousandEyesAssuring Contact Center Experiences for Your Customers With ThousandEyes
Assuring Contact Center Experiences for Your Customers With ThousandEyes
ThousandEyes
 
Search and Society: Reimagining Information Access for Radical Futures
Search and Society: Reimagining Information Access for Radical FuturesSearch and Society: Reimagining Information Access for Radical Futures
Search and Society: Reimagining Information Access for Radical Futures
Bhaskar Mitra
 
Key Trends Shaping the Future of Infrastructure.pdf
Key Trends Shaping the Future of Infrastructure.pdfKey Trends Shaping the Future of Infrastructure.pdf
Key Trends Shaping the Future of Infrastructure.pdf
Cheryl Hung
 
Software Delivery At the Speed of AI: Inflectra Invests In AI-Powered Quality
Software Delivery At the Speed of AI: Inflectra Invests In AI-Powered QualitySoftware Delivery At the Speed of AI: Inflectra Invests In AI-Powered Quality
Software Delivery At the Speed of AI: Inflectra Invests In AI-Powered Quality
Inflectra
 
Mission to Decommission: Importance of Decommissioning Products to Increase E...
Mission to Decommission: Importance of Decommissioning Products to Increase E...Mission to Decommission: Importance of Decommissioning Products to Increase E...
Mission to Decommission: Importance of Decommissioning Products to Increase E...
Product School
 
Slack (or Teams) Automation for Bonterra Impact Management (fka Social Soluti...
Slack (or Teams) Automation for Bonterra Impact Management (fka Social Soluti...Slack (or Teams) Automation for Bonterra Impact Management (fka Social Soluti...
Slack (or Teams) Automation for Bonterra Impact Management (fka Social Soluti...
Jeffrey Haguewood
 
From Daily Decisions to Bottom Line: Connecting Product Work to Revenue by VP...
From Daily Decisions to Bottom Line: Connecting Product Work to Revenue by VP...From Daily Decisions to Bottom Line: Connecting Product Work to Revenue by VP...
From Daily Decisions to Bottom Line: Connecting Product Work to Revenue by VP...
Product School
 
Builder.ai Founder Sachin Dev Duggal's Strategic Approach to Create an Innova...
Builder.ai Founder Sachin Dev Duggal's Strategic Approach to Create an Innova...Builder.ai Founder Sachin Dev Duggal's Strategic Approach to Create an Innova...
Builder.ai Founder Sachin Dev Duggal's Strategic Approach to Create an Innova...
Ramesh Iyer
 
LF Energy Webinar: Electrical Grid Modelling and Simulation Through PowSyBl -...
LF Energy Webinar: Electrical Grid Modelling and Simulation Through PowSyBl -...LF Energy Webinar: Electrical Grid Modelling and Simulation Through PowSyBl -...
LF Energy Webinar: Electrical Grid Modelling and Simulation Through PowSyBl -...
DanBrown980551
 
GraphRAG is All You need? LLM & Knowledge Graph
GraphRAG is All You need? LLM & Knowledge GraphGraphRAG is All You need? LLM & Knowledge Graph
GraphRAG is All You need? LLM & Knowledge Graph
Guy Korland
 
Empowering NextGen Mobility via Large Action Model Infrastructure (LAMI): pav...
Empowering NextGen Mobility via Large Action Model Infrastructure (LAMI): pav...Empowering NextGen Mobility via Large Action Model Infrastructure (LAMI): pav...
Empowering NextGen Mobility via Large Action Model Infrastructure (LAMI): pav...
Thierry Lestable
 
Designing Great Products: The Power of Design and Leadership by Chief Designe...
Designing Great Products: The Power of Design and Leadership by Chief Designe...Designing Great Products: The Power of Design and Leadership by Chief Designe...
Designing Great Products: The Power of Design and Leadership by Chief Designe...
Product School
 
Dev Dives: Train smarter, not harder – active learning and UiPath LLMs for do...
Dev Dives: Train smarter, not harder – active learning and UiPath LLMs for do...Dev Dives: Train smarter, not harder – active learning and UiPath LLMs for do...
Dev Dives: Train smarter, not harder – active learning and UiPath LLMs for do...
UiPathCommunity
 
DevOps and Testing slides at DASA Connect
DevOps and Testing slides at DASA ConnectDevOps and Testing slides at DASA Connect
DevOps and Testing slides at DASA Connect
Kari Kakkonen
 
IOS-PENTESTING-BEGINNERS-PRACTICAL-GUIDE-.pptx
IOS-PENTESTING-BEGINNERS-PRACTICAL-GUIDE-.pptxIOS-PENTESTING-BEGINNERS-PRACTICAL-GUIDE-.pptx
IOS-PENTESTING-BEGINNERS-PRACTICAL-GUIDE-.pptx
Abida Shariff
 
GenAISummit 2024 May 28 Sri Ambati Keynote: AGI Belongs to The Community in O...
GenAISummit 2024 May 28 Sri Ambati Keynote: AGI Belongs to The Community in O...GenAISummit 2024 May 28 Sri Ambati Keynote: AGI Belongs to The Community in O...
GenAISummit 2024 May 28 Sri Ambati Keynote: AGI Belongs to The Community in O...
Sri Ambati
 
Unsubscribed: Combat Subscription Fatigue With a Membership Mentality by Head...
Unsubscribed: Combat Subscription Fatigue With a Membership Mentality by Head...Unsubscribed: Combat Subscription Fatigue With a Membership Mentality by Head...
Unsubscribed: Combat Subscription Fatigue With a Membership Mentality by Head...
Product School
 

Recently uploaded (20)

State of ICS and IoT Cyber Threat Landscape Report 2024 preview
State of ICS and IoT Cyber Threat Landscape Report 2024 previewState of ICS and IoT Cyber Threat Landscape Report 2024 preview
State of ICS and IoT Cyber Threat Landscape Report 2024 preview
 
Knowledge engineering: from people to machines and back
Knowledge engineering: from people to machines and backKnowledge engineering: from people to machines and back
Knowledge engineering: from people to machines and back
 
PHP Frameworks: I want to break free (IPC Berlin 2024)
PHP Frameworks: I want to break free (IPC Berlin 2024)PHP Frameworks: I want to break free (IPC Berlin 2024)
PHP Frameworks: I want to break free (IPC Berlin 2024)
 
Assuring Contact Center Experiences for Your Customers With ThousandEyes
Assuring Contact Center Experiences for Your Customers With ThousandEyesAssuring Contact Center Experiences for Your Customers With ThousandEyes
Assuring Contact Center Experiences for Your Customers With ThousandEyes
 
Search and Society: Reimagining Information Access for Radical Futures
Search and Society: Reimagining Information Access for Radical FuturesSearch and Society: Reimagining Information Access for Radical Futures
Search and Society: Reimagining Information Access for Radical Futures
 
Key Trends Shaping the Future of Infrastructure.pdf
Key Trends Shaping the Future of Infrastructure.pdfKey Trends Shaping the Future of Infrastructure.pdf
Key Trends Shaping the Future of Infrastructure.pdf
 
Software Delivery At the Speed of AI: Inflectra Invests In AI-Powered Quality
Software Delivery At the Speed of AI: Inflectra Invests In AI-Powered QualitySoftware Delivery At the Speed of AI: Inflectra Invests In AI-Powered Quality
Software Delivery At the Speed of AI: Inflectra Invests In AI-Powered Quality
 
Mission to Decommission: Importance of Decommissioning Products to Increase E...
Mission to Decommission: Importance of Decommissioning Products to Increase E...Mission to Decommission: Importance of Decommissioning Products to Increase E...
Mission to Decommission: Importance of Decommissioning Products to Increase E...
 
Slack (or Teams) Automation for Bonterra Impact Management (fka Social Soluti...
Slack (or Teams) Automation for Bonterra Impact Management (fka Social Soluti...Slack (or Teams) Automation for Bonterra Impact Management (fka Social Soluti...
Slack (or Teams) Automation for Bonterra Impact Management (fka Social Soluti...
 
From Daily Decisions to Bottom Line: Connecting Product Work to Revenue by VP...
From Daily Decisions to Bottom Line: Connecting Product Work to Revenue by VP...From Daily Decisions to Bottom Line: Connecting Product Work to Revenue by VP...
From Daily Decisions to Bottom Line: Connecting Product Work to Revenue by VP...
 
Builder.ai Founder Sachin Dev Duggal's Strategic Approach to Create an Innova...
Builder.ai Founder Sachin Dev Duggal's Strategic Approach to Create an Innova...Builder.ai Founder Sachin Dev Duggal's Strategic Approach to Create an Innova...
Builder.ai Founder Sachin Dev Duggal's Strategic Approach to Create an Innova...
 
LF Energy Webinar: Electrical Grid Modelling and Simulation Through PowSyBl -...
LF Energy Webinar: Electrical Grid Modelling and Simulation Through PowSyBl -...LF Energy Webinar: Electrical Grid Modelling and Simulation Through PowSyBl -...
LF Energy Webinar: Electrical Grid Modelling and Simulation Through PowSyBl -...
 
GraphRAG is All You need? LLM & Knowledge Graph
GraphRAG is All You need? LLM & Knowledge GraphGraphRAG is All You need? LLM & Knowledge Graph
GraphRAG is All You need? LLM & Knowledge Graph
 
Empowering NextGen Mobility via Large Action Model Infrastructure (LAMI): pav...
Empowering NextGen Mobility via Large Action Model Infrastructure (LAMI): pav...Empowering NextGen Mobility via Large Action Model Infrastructure (LAMI): pav...
Empowering NextGen Mobility via Large Action Model Infrastructure (LAMI): pav...
 
Designing Great Products: The Power of Design and Leadership by Chief Designe...
Designing Great Products: The Power of Design and Leadership by Chief Designe...Designing Great Products: The Power of Design and Leadership by Chief Designe...
Designing Great Products: The Power of Design and Leadership by Chief Designe...
 
Dev Dives: Train smarter, not harder – active learning and UiPath LLMs for do...
Dev Dives: Train smarter, not harder – active learning and UiPath LLMs for do...Dev Dives: Train smarter, not harder – active learning and UiPath LLMs for do...
Dev Dives: Train smarter, not harder – active learning and UiPath LLMs for do...
 
DevOps and Testing slides at DASA Connect
DevOps and Testing slides at DASA ConnectDevOps and Testing slides at DASA Connect
DevOps and Testing slides at DASA Connect
 
IOS-PENTESTING-BEGINNERS-PRACTICAL-GUIDE-.pptx
IOS-PENTESTING-BEGINNERS-PRACTICAL-GUIDE-.pptxIOS-PENTESTING-BEGINNERS-PRACTICAL-GUIDE-.pptx
IOS-PENTESTING-BEGINNERS-PRACTICAL-GUIDE-.pptx
 
GenAISummit 2024 May 28 Sri Ambati Keynote: AGI Belongs to The Community in O...
GenAISummit 2024 May 28 Sri Ambati Keynote: AGI Belongs to The Community in O...GenAISummit 2024 May 28 Sri Ambati Keynote: AGI Belongs to The Community in O...
GenAISummit 2024 May 28 Sri Ambati Keynote: AGI Belongs to The Community in O...
 
Unsubscribed: Combat Subscription Fatigue With a Membership Mentality by Head...
Unsubscribed: Combat Subscription Fatigue With a Membership Mentality by Head...Unsubscribed: Combat Subscription Fatigue With a Membership Mentality by Head...
Unsubscribed: Combat Subscription Fatigue With a Membership Mentality by Head...
 

NETFLIX Business Analysis & Valuation

  • 1. Analysis & Valuation For MGMT E-2620, Prof. Dalko TEAM - 10 Brian Schoenherr, Anirudh Udayashankar, Junyao Zhao, Alegra N Horne & Larry Montello
  • 2. Netflix Company Profile • Pioneer and leader of the on-line TV market. • 75M subscribers in over 190 countries. • 125 million hours of viewing per day. • Affordable no-commitment monthly fee. • Personalized recommendations based on sophisticated user monitoring. • DVD rental is very profitable but an ever smaller contributor to their business.
  • 3. First Mover Advantage Very Competitive Landscape (Source: “Premium Prospects for OTT in the USA” study from MTM, Ooyala and Vindicia)
  • 4. Threat of New Entrants Hybrid Services Niche offerings MEDIUM Threat of Substitutes Cable Live streaming Opting outside Free alternatives HIGH Bargaining Power of Buyers Low cost alternatives Low switching cost HIGH Bargaining Power of Suppliers Supplier-Competitors Strategic Alliances HIGH Degree of Rivalry among Competitors Amazon & Hulu HBO, CBS, Fox Apple, Google, Roku HIGH Industry Analysis - Porter’s Five Forces
  • 5. Netflix Competitive Strategy • 48% share, more than twice as big as the next competitor (Amazon 20% and Hulu 10%). • Differentiation Strategy: offering superior content to the global video streaming market. • Sophisticated monitoring capability to understand their customers preferences and select winning content.
  • 6. Largest Opportunity for the US # 1 Online TV provider is with the rest of the world
  • 7. Netflix Corporate Strategy Analysis • Three reportable segments: domestic streaming, International streaming and Domestic DVD. • Started with DVD rentals and built its knowledge of (and tools to measure) winning content. • Planned growth of customer base from 75M today to 150M by 2020. • Primary investments: – Global Expansion: Serving 190 countries world-wide – $5B investment is developing their own content.
  • 8. Strategy Analysis Conclusions • Netflix is number 1 in video streaming and are making investments to maintain their market leadership. • NFLX stock is trading at a very high premium over what might be predicted with fundamental analysis. This is typical of a market leader in a new emerging high tech market. • We predict Netflix will regress to the market growth rate of 20% and face higher content and delivery costs as they expand internationally.
  • 9. Netflix – Accounting Analysis • Revenue stream: Subscription fees only – No advertising revenue • Asset Recognition – Library of DVD and streaming content – Global network – Mostly straight line amortization - discretionary
  • 10. Netflix – Accounting Analysis • Liabilities recognition: Subscription fees only – Fixed costs for content licensing v/s variable subscription fees; gross margin liabilities – Future contracts of $6.1 billion – currently discussed, but unaccounted for – Growing international business – exchange rate volatility • -$331 million impact in 2015
  • 11. Netflix – Accounting Analysis • Opinion – Detailed MD&A – Accounting reflective of: • Future growth potential • Inherent customer acquisition risks • Impact of technological changes
  • 12. Financial Analysis – Ratio Analysis Overall Profitability Year Ended 2010 2011 2012 2013 2014 2015 ROE 53.3% 35.2% 2.3% 8.4% 14.4% 5.5% ROA 15.8% 7.4% 0.4% 2.1% 3.8% 1.2% Financial Leverage 3.38 4.77 5.33 4.06 3.80 4.59 Sales and Net Income Growth Year 2011 2012 2013 2014 2015 Sales Growth 48.2% 12.6% 21.2% 25.8% 23.2% Net Income Growth 46.1% -92.4% 555.8% 137.3% -54.0%
  • 13. Financial Analysis – DuPont Model DECOMPOSING PROFITABILITY: DUPONT ALTERNATIVE Year Ended Dec-10, (MM USD) 2010 2011 2012 2013 2014 2015 NOPAT / Sales 7.7% 7.5% 0.8% 3.0% 5.5% 3.5% x Sales / Net Assets 12.3 11.5 8.8 6.6 4.7 2.9 = Operating ROA 94.5% 85.5% 6.9% 19.8% 25.9% 10.3% Spread 104.7% 89.0% 10.3% 22.7% 31.5% -117.7% x Net Financial Leverage -39.0% -57.0% -45.0% -50.0% -37.0% 4.0% = Financial Leverage Gain -41.2% -50.4% -4.6% -11.4% -11.5% -4.8% ROE 53.3% 35.2% 2.3% 8.4% 14.4% 5.5%
  • 14. Financial Analysis – Operation EVALUATING OPERATING MANAGEMENT Year Ended Dec-10, (MM USD) 2010 2011 2012 2013 2014 2015 Sales / Sales 100.0% 100.0% 100.0% 100.0% 100.0% 100.0% Cost of Sales / Sales 47.1% 37.5% 26.3% 20.0% 17.6% 15.4% Gross Margin 52.9% 62.5% 73.7% 80.0% 82.4% 84.6% SG&A / Sales 24.4% 24.3% 25.1% 23.5% 24.5% 27.8% Amortization & Depreciation expense/ Sales 15.7% 26.2% 47.2% 51.2% 50.5% 52.3% Investment Income / Sales 0.0% 0.0% 0.0% 0.0% 0.0% 0.0% Other Income, net of Other Expense / Sales 0.2% -0.2% 0.0% -0.6% -0.1% -0.5% Minority Interest / Sales 0.0% 0.0% 0.0% 0.0% 0.0% 0.0% EBIT Margin 13.0% 11.8% 1.4% 4.6% 7.3% 4.1% Net Interest Expense (Income) / Sales 0.9% 0.6% 0.6% 0.7% 0.9% 2.0% Pre-Tax Income Margin 12.1% 11.2% 0.8% 3.9% 6.4% 2.1% Taxes / Sales 4.9% 4.2% 0.4% 1.3% 1.5% 0.3% Net Income Margin 7.2% 7.1% 0.5% 2.6% 4.9% 1.8%
  • 15. Financial Analysis – Investment EVALUATING INVESTMENT MANAGEMENT Year Ended Dec-10, (MM USD) 2010 2011 2012 2013 2014 2015 Working Capital Management: Operating Working Capital / Sales -4.4% -5.9% -5.0% -6.7% -6.0% -6.0% Operating Working Capital Turnover -22.6 -16.9 -20.0 -14.8 -16.7 -16.6 Accounts Payable Turnover 4.6 1.3 0.7 0.5 0.4 0.3 Days' Payables 79.8 281.2 558.4 785.6 871.7 1063.3 Long-Term Asset Management: Net Long-Term Assets Turnover 8.0 6.8 6.1 4.6 3.7 2.5 Net Long-Term Assets / Sales 12.6% 14.6% 16.4% 21.9% 27.4% 40.1% RP&E Turnover 7.0 2.7 2.2 2.0 1.9 1.5 Depreciation & Amortization / Sales 15.7% 26.2% 47.2% 51.2% 50.5% 52.3%
  • 16. Financial Analysis – Financial EVALUATING FINANCIAL MANAGEMENT Year Ended Dec-10, (MM USD) 2010 2011 2012 2013 2014 2015 Short-Term Liquidity: Current Ratio 1.7 1.5 1.3 1.4 1.5 1.5 Debt and Long-Term Solvency: Liabilities-to-Equity 2.4 3.8 4.3 3.1 2.8 3.6 Debt-to-Equity 0.8 0.7 0.6 0.4 0.5 1.1 Interest Coverage Ratio: Interest Coverage 14.6 19.0 2.5 6.9 8.0 2.1
  • 17. Other Ratios Year Ended Dec-10, (MM USD) 2010 2011 2012 2013 2014 2015 EBITDA Margin 28.7% 38.0% 48.6% 55.8% 57.8% 56.4% Sustainable Growth Rate 53.3% 35.2% 2.3% 8.4% 14.4% 5.5% Dividend policy: Netflix has not declared or paid any cash dividends, and has no intention of paying cash dividends in the foreseeable future. On July 14, 2015, Netflix exercised a 7:1 stock split in the form of a stock dividend to all shareholders. Financial Analysis – Other Ratios
  • 18. (3,000) (2,000) (1,000) 0 1,000 2,000 3,000 4,000 5,000 6,000 7,000 8,000 FY 2010 FY 2011 FY 2012 FY 2013 FY 2014 FY 2015 Thousands Revenue Operating Income Net income Free Cash Flow Net cash (used in) provided by operating activities Cash Flow Analysis
  • 19. Statement of Cash Flows Year Ended Dec-10, (MM USD) 2010 2011 2012 2013 2014 2015 Net Income 160.85 226.13 17.15 112.40 266.80 122.64 After-tax net interest expense (income) 11.61 12.60 11.24 19.15 38.35 114.72 Non-operating losses (gains) -10.50 0.00 0.00 0.00 0.00 0.00 Long-term operating accruals -101.32 -1,487.96 -782.48 -808.22 -980.54 -2,207.38 Depreciation and amortization 340.07 839.62 1,702.08 2,241.68 2,781.80 3,547.05 Content expenses -441.39 -2,327.58 -2,484.56 -3,049.90 -3,762.34 -5,754.43 Operating cash flow before working capital investments $60.64 -$1,249.23 -$754.09 -$676.67 -$675.39 -$1,970.02 Net (investments in) or liquidation of operating working capital 227.37 1,579.55 788.09 793.65 730.22 1,335.30 Operating cash flow before investment in long-term assets $288.01 $330.32 $34.00 $116.98 $54.83 -$634.72 Net (investment in) or liquidation of operating long-term assets -116.09 -265.82 -245.91 -255.97 -42.87 -179.19 Free cash flow available to debt and equity $171.92 $64.50 -$211.91 -$138.99 $11.96 -$813.91 After-tax net interest expense (income) 11.61 12.60 11.24 19.15 38.35 114.72 Net debt (repayment) or issuance -1.78 195.98 -2.62 270.05 398.91 1,499.45 Free cash flow available to equity $158.53 $247.88 -$225.77 $111.91 $372.52 $570.82 Dividend (payments) 0.00 0.00 0.00 0.00 0.00 0.00 Net stock (repurchase), issuance, or other equity changes 49.78 219.56 3.66 124.56 67.62 95.61 Net increase (decrease) in cash balance $208.31 $467.44 -$222.11 $236.47 $440.14 $666.43
  • 20. Baseline forecast – Assumptions for current stock price $95.50 • Maintain sales growth > 25% per annum • NOPAT Margin > 7.4% per annum • Increase from 5.5 million subscribers (2015) to 15 million new subscribers each year for 5 years. •--------------------------------------------------------------------------------------------------------------------------------------------------------------------------------------------------------------------------------------------------  Assumptions suggests Netflix can maintain its competitive advantage in a very competitive industry.  We think the current set of assumptions are unrealistic.. Netflix – Prospective Analysis
  • 21. Netflix – Scenario Analysis Best case scenario $95 Most likely scenario $ 65 Worst case scenario $30
  • 22. Valuation using Price Multiples Time Warner Cable Price/Earnings: 28.7 Price/Book ratio: 5.85 Comcast Price/Earnings: 17.4 Price/Book ratio: 2.64 Netflix, Inc. Price /Earnings ratio: 398 Price /Book ratio: 18.3
  • 23. Overall Recommendation We assign a Sell rating to Netflix stock. Netflix current stock price: $95 a share Macro factors: Increased competition Company factors: low margins, increasing debt, negative cash flows Fair value at $65 a share

Editor's Notes

  1. Netflix offers content on a subscription basis only, and does not derive any advertising revenue (as does most of the industry). One key measure of Netflix’s success is its vast library of streaming and DVD content, which can currently be accessed globally. This is represented as current and non-current content assets on the balance sheet – and we agree with this practice – as the content earns future cash flows for the company. While the individual contracts for titles is impossible to determine, Netflix amortizes the content assets (licensed and produced) in “Cost of Revenues” on the Consolidated Statements of Operations. The amortization period typically ranges from six months to five years. The rate of amortization is discretionary to management, and a potential red flag with future growth in content assets.
  2. While Netflix’s revenues are variable per the number of user subscriptions, the contracts for streaming licenses are fixed – which gives rise to gross margin liabilities which we should be watchful for. Currently about $6.1 billion of future streaming assets and corresponding liabilities are not included on the balance sheet, as viewers cannot access them as yet. We believe this is correct, as it would have otherwise artifitially inflated the size of the balance sheet, with no gain to net operating assets. With a growing international business segment, we should also account for Forex volatility, as all revenues net are translated into USD for accounting purposes.
  3. In analyzing the financial statements we found that Management discussions are extremely detailed regarding all inherent risks to the future growth of the company - both in terms of customer acquisition and technological advancements - and has proven to be reliable in representing the business in the correct light, allowing investors to make calculated assumptions about opportunities on hand. We concur with Netflix’s claims to manage balance sheet to lower blended cost of capital over time, while maintaining financial flexibility.
  4. Netflix’s sales growth has been more than 20% each year except 2012. The high growth is due to the rapid growth of new subscribers globally, but the company’s ROE is significantly decreased.
  5. The declined in ROE is due to the decline of operating ROA. Netflix significantly increased their assets in the form of building and content library, and the growth rate of asset outpaced the growth rate of sales, result in the low asset turnover. IN the meantime, The NOPAT margin is also decreased because of the increased operating and content expenses. The dupont also shows that Netflix has negative gains from its financial activities, but the trend is increasing shows that they become more efficient with the use of debt.
  6. Using the top-down analysis to evaluate Netflix’s operating management, we see that Netflix increased their efficiency in procurement of contents and production process represented by decreasing rate of COGS, but the profits are offset by the high operating costs mainly from SG&A, amortization and depreciation expenses. The high SG&A expenses on the other hand shows that Netflix is competing on a differentiation strategy.
  7. For the investment analysis, the working capital management has improved in the form of longer Days Payable. But the net Long-term Asset turnover is decreased because of increase in contents assets as well as infrastructures.
  8. Netflix has increased the use of debt to support their business expansion. By the end of 2015, the company has the debt over equity ratio of 1.1,but shows good liquidity and interest coverage ratio.
  9. by adding back depreciation and amortization, the EBITA Margin indicates the high profitability of Netflix’s business, and a sustainable growth rate of 5.5% at the end of 2015.