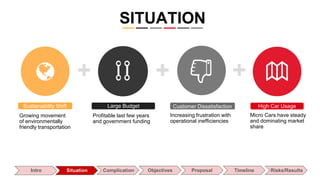
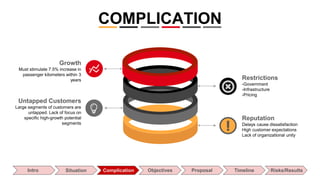
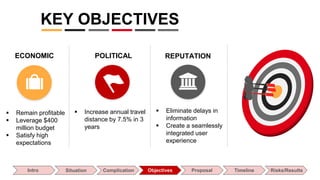
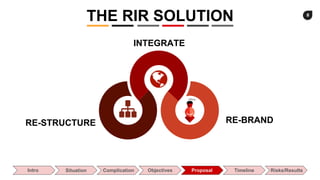
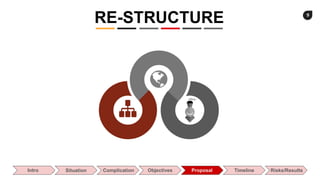
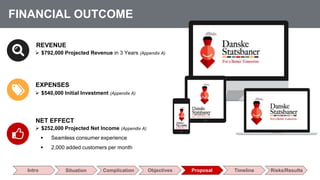
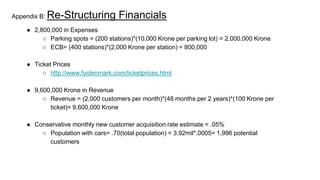
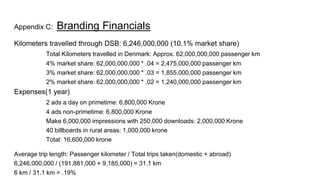
Intro Situation Complication Objectives Proposal Timeline Risks/Results
Introduction
Situation Analysis
Agenda
Intro Situation Complication Objectives Proposal Timeline Risks/Results
Solution
Intro Situation Complication Objectives Proposal Timeline Risks/Results
Agenda
Timeline
Risks and Assumptions
Wrap-Up
Daniel
Marzec
● Sophomore
● Computer Engineering
Intro Situation Complication Objectives Proposal Timeline Risks/Results
Drew
Pinkerton
● Sophomore
● Supply Chain Management
Prajwal
Chandrashekar
● Freshmen
● Mechanical Engineering
Josiah
Mooney
● Sophomore
● Needed a team
OUR TEAM
+ +
Growing movement
of environmentally
friendly transportation
Sustainability Shift
Profitable last few years
and government funding
Large Budget
Increasing frustration with
operational inefficiencies
Customer Dissatisfaction
Micro Cars have steady
and dominating market
share
High Car Usage
Intro Situation Complication Objectives Proposal Timeline Risks/Results
+
SITUATION
Restrictions
-Government
-Infrastructure
-Pricing
Untapped Customers
Large segments of customers are
untapped. Lack of focus on
specific high-growth potential
segments
Reputation
Delays cause dissatisfaction
High customer expectations
Lack of organizational unity
Growth
Must stimulate 7.5% increase in
passenger kilometers within 3
years
COMPLICATION
Intro Situation Complication Objectives Proposal Timeline Risks/Results
KEY OBJECTIVES
Intro Situation Complication Objectives Proposal Timeline Risks/Results
 Eliminate delays in
information
 Create a seamlessly
integrated user
experience
 Increase annual travel
distance by 7.5% in 3
years
 Remain profitable
 Leverage $400
million budget
 Satisfy high
expectations
REPUTATIONPOLITICALECONOMIC
8
Commerce Slides
RE-BRAND
INTEGRATE
RE-STRUCTURE
THE RIR SOLUTION
Intro Situation Complication Objectives Proposal Timeline Risks/Results
9
Commerce Slides
RE-STRUCTURE
Intro Situation Complication Objectives Proposal Timeline Risks/Results
Create new parking spots in
each of the 200 least used
stations
Parking
Pricing
RE-STRUCTURE
Intro Situation Complication Objectives Proposal Timeline Risks/Results
Decrease prices for all non-
peak hours
Safety
Reassure customers about
changes done to assure
safety
11
Commerce SlidesIntro Situation Complication Objectives Proposal Timeline Risks/Results
RE-STRUCTURING STRATEGY 1: PARKING
Create at least 30 new parking
spots in each of the 200 least used
stations
Intro Situation Complication Objectives Proposal Timeline Risks/Results
Motivated Non-User segment 702000 people
50% acquisition of segment in 10 years 351000 people
60 customers per spot 5850 spots
Stations with lowest traffic/most 200 stations
29.25 spots/station
Daily spendable parking tickets for
customers.
RE-STRUCTURING STRATEGY 1: PARKING
13
Commerce SlidesIntro Situation Complication Objectives Proposal Timeline Risks/Results
RE-STRUCTURING STRATEGY 2: PRICING
Decrease prices for S-train for all
times around the rush hours
Intro Situation Complication Objectives Proposal Timeline Risks/Results
Continue removing the number of
“products” offered
RE-STRUCTURING STRATEGY 2: PRICING
Intro Situation Complication Objectives Proposal Timeline Risks/Results
Emergency Call Systems placed
strategically throughout the stations
Immediate Customer Safety
alerts sent through the app
RE-STRUCTURING STRATEGY 3: SAFETY
EXPENSES
REVENUE
 20,000 Krone per parking lot
 Conservative Emergency Call Box price estimate
 $406,000 Projected Expenses in 2 Years (Appendix B)
NET EFFECT
FINANCIAL ANALYSIS
Intro Situation Complication Objectives Proposal Timeline Risks/Results
 Conservative New Customer Acqusition Estimate
 $1,392,000 in Additional Revenue in 2 years (Appendix B)
 New Customer Acquisition
 $986,000 Projected Net Income in 2 Years
17
Commerce Slides
INTEGRATE
Intro Situation Complication Objectives Proposal Timeline Risks/Results
Multiple apps required
Inaccurate and late reports
Limited functionality
Overall lack of integration
Current State
Commerce Slides
Simple User
Interface
Design
Easier Point of
Service with 24/7
Support
Service
Trip planner and
seat reservations
Plan
Store Frequent Routes and get updates on timing
Bus and Taxi service integration
Immediate safety alerts
Increased Mobile Payment Processing
Our Solution
Intro Situation Complication Objectives Proposal Timeline Risks/Results
Customer Acquisition
Platform for growth
Passenger Analytics
Predict and prepare for
customer needs
Data Collection
Feedback and optimization
Point of Service
Direct link to customer
INTERNAL
BENEFITS
Intro Situation Complication Objectives Proposal Timeline Risks/Results
EXPENSES
 $540,000 Initial Investment (Appendix A)
REVENUE
 $792,000 Projected Revenue in 3 Years (Appendix A)
NET EFFECT
FINANCIAL OUTCOME
Intro Situation Complication Objectives Proposal Timeline Risks/Results
 $252,000 Projected Net Income (Appendix A)
 Seamless consumer experience
 2,000 added customers per month
RE-BRAND
Intro Situation Complication Objectives Proposal Timeline Risks/Results
RE-BRAND
Current State of DSB’s Brand
Slow and Delayed
Subpar Customer
Service
Outdated and Expensive
Intro Situation Complication Objectives Proposal Timeline Risks/Results
24
Commerce Slides
1 New Logo
Incentive Programs2
3
RE-BRANDING PLAN
Intro Situation Complication Objectives Proposal Timeline Risks/Results
Advertising Campaign
Unmotivated Heavy
Motivated Light Motivated Non-User
Motivated Medium
● Digital Savvy
● Live in Capital Region
● Find travel stressful
● Women and Singles
● Environmentally aware
● Capital region and Aarhus
● Elder and Married
● Capital region and
large cities
● High income
● Rural demographic
● 2+ km away from train
stations
● Take car or bus
TARGET MARKET SEGMENTS
Intro Situation Complication Objectives Proposal Timeline Risks/Results
1 New Logo
Referral
Program
Loyalty
Program
● 5 km per referral (around 20% of average trip: Appendix C)
● Gain market share through continuous referrals
● Integrated through mobile app
● Discounted pricing for travel times around rush hour
● 5% of kilometers travelled awarded back
● Integrated through app
● Retain customers through incentives
2 Incentive Programs
Advertisements
Television
• Advertisements focused on
new station features, app and
+time
• Market: All targeted
Social Media
• Facebook, Instagram and
Twitter ads with direct link to
app and info on sustainability
• Market: Unmotivated heavy
and Motivated medium
Billboards
• Billboards with a focus on
+time and sustainability
around less populated areas
• Market: Motivated non-users
3
29
Commerce Slides
Potential Market Growth
Intro Situation Complication Objectives Proposal Timeline Risks/Results
Bull
• 4% market growth in one Year
• Approximately 2,475,000,000 km (Appendix C)
Conservative
• 3% market growth
• Approximately 1,855,000,000 km (Appendix C)
Bear
• 2% market growth
• Approximately 1,240,000,000 km (Appendix C)
 Total Expense: 16,600,000 Krone or 2,400,000 USD
(.05% of annual budget)
Task
Year
1
Year
2
Year
3
Unveil Logo
Marketing
Launch Plan
App
Development
App Launch
App Support
Construct New
Parking
Safety
Construction
Adjust Pricing
30IMPLEMENTATION TIMELINE
31
Commerce Slides
● Performance of marketing
campaign depends on many
factors
● Limited time to change brand-
image
● Innovations in sustainable
transport
● Customer retention
● East-West construction will
cause periodic delays for 3 years
Low Medium High
Intro Situation Complication Objectives Proposal Timeline Risks/Results
RISKS
IMPACT
Economic Political Reputational
• Expanded customer base
• App as alternate revenue
stream
• Meeting high demand
• DSB serves as backbone of
Denmark’s transportation
• Political expectation for
growth satisfied
• Seamlessly integrated user
experience
• Delays, traffic info, security
• Communicating change to
the consumer
Intro Situation Complication Objectives Proposal Timeline Risks/Results
QUESTIONS
Appendix A: IT Development Financials
● $500,000 for frontend and backend development
○ As seen in instagram and ubers development (source:
https://savvyapps.com/blog/how-much-does-app-cost-massive-review-pricing-
budget-considerations)
● $20,000 to restructure train & rail system GPS infrastructure
○ Source: http://www.gps.gov/applications/rail/
● 0.05% per transaction ~ $20,000 set-up
○ Source: https://paylinedata.com/pricing/
● $20,000 ad revenue per month
○ 160million monthly users * 50%
○ Source: http://ryanmorel.com/mobile-advertising-calculator/
● New customer acquisition rate estimate = .005%
○ Population with smart phones = .73(total population) = 4.03mil
○ ~$2,000 in ad revenue calculated from
○ Source: http://ryanmorel.com/mobile-advertising-calculator/
Appendix B: Re-Structuring Financials
● 2,800,000 in Expenses
○ Parking spots = (200 stations)*(10,000 Krone per parking lot) = 2,000,000 Krone
○ ECB= (400 stations)*(2,000 Krone per station) = 800,000
● Ticket Prices
○ http://www.fyidenmark.com/ticketprices.html
● 9,600,000 Krone in Revenue
○ Revenue = (2,000 customers per month)*(48 months per 2 years)*(100 Krone per
ticket)= 9,600,000 Krone
● Conservative monthly new customer acquisition rate estimate = .05%
○ Population with cars= .70(total population) = 3.92mil*.0005= 1,996 potential
customers
Appendix C: Branding Financials
Kilometers travelled through DSB: 6,246,000,000 (10.1% market share)
Total Kilometers travelled in Denmark: Approx. 62,000,000,000 passenger km
4% market share: 62,000,000,000 * .04 = 2,475,000,000 passenger km
3% market share: 62,000,000,000 * .03 = 1,855,000,000 passenger km
2% market share: 62,000,000,000 * .02 = 1,240,000,000 passenger km
Expenses(1 year)
2 ads a day on primetime: 6,800,000 Krone
4 ads non-primetime: 6,800,000 Krone
Make 6,000,000 impressions with 250,000 downloads: 2,000,000 Krone
40 billboards in rural areas: 1,000,000 krone
Total: 16,600,000 krone
Average trip length: Passenger kilometer / Total trips taken(domestic + abroad)
6,246,000,000 / (191,881,000 + 9,185,000) = 31.1 km
6 km / 31.1 km = .19%
Appendix: Value Index

NCG Week Case Competition

  • 1.
    Intro Situation ComplicationObjectives Proposal Timeline Risks/Results
  • 2.
    Introduction Situation Analysis Agenda Intro SituationComplication Objectives Proposal Timeline Risks/Results Solution
  • 3.
    Intro Situation ComplicationObjectives Proposal Timeline Risks/Results Agenda Timeline Risks and Assumptions Wrap-Up
  • 4.
    Daniel Marzec ● Sophomore ● ComputerEngineering Intro Situation Complication Objectives Proposal Timeline Risks/Results Drew Pinkerton ● Sophomore ● Supply Chain Management Prajwal Chandrashekar ● Freshmen ● Mechanical Engineering Josiah Mooney ● Sophomore ● Needed a team OUR TEAM
  • 5.
    + + Growing movement ofenvironmentally friendly transportation Sustainability Shift Profitable last few years and government funding Large Budget Increasing frustration with operational inefficiencies Customer Dissatisfaction Micro Cars have steady and dominating market share High Car Usage Intro Situation Complication Objectives Proposal Timeline Risks/Results + SITUATION
  • 6.
    Restrictions -Government -Infrastructure -Pricing Untapped Customers Large segmentsof customers are untapped. Lack of focus on specific high-growth potential segments Reputation Delays cause dissatisfaction High customer expectations Lack of organizational unity Growth Must stimulate 7.5% increase in passenger kilometers within 3 years COMPLICATION Intro Situation Complication Objectives Proposal Timeline Risks/Results
  • 7.
    KEY OBJECTIVES Intro SituationComplication Objectives Proposal Timeline Risks/Results  Eliminate delays in information  Create a seamlessly integrated user experience  Increase annual travel distance by 7.5% in 3 years  Remain profitable  Leverage $400 million budget  Satisfy high expectations REPUTATIONPOLITICALECONOMIC
  • 8.
    8 Commerce Slides RE-BRAND INTEGRATE RE-STRUCTURE THE RIRSOLUTION Intro Situation Complication Objectives Proposal Timeline Risks/Results
  • 9.
    9 Commerce Slides RE-STRUCTURE Intro SituationComplication Objectives Proposal Timeline Risks/Results
  • 10.
    Create new parkingspots in each of the 200 least used stations Parking Pricing RE-STRUCTURE Intro Situation Complication Objectives Proposal Timeline Risks/Results Decrease prices for all non- peak hours Safety Reassure customers about changes done to assure safety
  • 11.
    11 Commerce SlidesIntro SituationComplication Objectives Proposal Timeline Risks/Results RE-STRUCTURING STRATEGY 1: PARKING
  • 12.
    Create at least30 new parking spots in each of the 200 least used stations Intro Situation Complication Objectives Proposal Timeline Risks/Results Motivated Non-User segment 702000 people 50% acquisition of segment in 10 years 351000 people 60 customers per spot 5850 spots Stations with lowest traffic/most 200 stations 29.25 spots/station Daily spendable parking tickets for customers. RE-STRUCTURING STRATEGY 1: PARKING
  • 13.
    13 Commerce SlidesIntro SituationComplication Objectives Proposal Timeline Risks/Results RE-STRUCTURING STRATEGY 2: PRICING
  • 14.
    Decrease prices forS-train for all times around the rush hours Intro Situation Complication Objectives Proposal Timeline Risks/Results Continue removing the number of “products” offered RE-STRUCTURING STRATEGY 2: PRICING
  • 15.
    Intro Situation ComplicationObjectives Proposal Timeline Risks/Results Emergency Call Systems placed strategically throughout the stations Immediate Customer Safety alerts sent through the app RE-STRUCTURING STRATEGY 3: SAFETY
  • 16.
    EXPENSES REVENUE  20,000 Kroneper parking lot  Conservative Emergency Call Box price estimate  $406,000 Projected Expenses in 2 Years (Appendix B) NET EFFECT FINANCIAL ANALYSIS Intro Situation Complication Objectives Proposal Timeline Risks/Results  Conservative New Customer Acqusition Estimate  $1,392,000 in Additional Revenue in 2 years (Appendix B)  New Customer Acquisition  $986,000 Projected Net Income in 2 Years
  • 17.
    17 Commerce Slides INTEGRATE Intro SituationComplication Objectives Proposal Timeline Risks/Results
  • 18.
    Multiple apps required Inaccurateand late reports Limited functionality Overall lack of integration Current State
  • 19.
    Commerce Slides Simple User Interface Design EasierPoint of Service with 24/7 Support Service Trip planner and seat reservations Plan Store Frequent Routes and get updates on timing Bus and Taxi service integration Immediate safety alerts Increased Mobile Payment Processing Our Solution Intro Situation Complication Objectives Proposal Timeline Risks/Results
  • 20.
    Customer Acquisition Platform forgrowth Passenger Analytics Predict and prepare for customer needs Data Collection Feedback and optimization Point of Service Direct link to customer INTERNAL BENEFITS Intro Situation Complication Objectives Proposal Timeline Risks/Results
  • 21.
    EXPENSES  $540,000 InitialInvestment (Appendix A) REVENUE  $792,000 Projected Revenue in 3 Years (Appendix A) NET EFFECT FINANCIAL OUTCOME Intro Situation Complication Objectives Proposal Timeline Risks/Results  $252,000 Projected Net Income (Appendix A)  Seamless consumer experience  2,000 added customers per month
  • 22.
    RE-BRAND Intro Situation ComplicationObjectives Proposal Timeline Risks/Results RE-BRAND
  • 23.
    Current State ofDSB’s Brand Slow and Delayed Subpar Customer Service Outdated and Expensive Intro Situation Complication Objectives Proposal Timeline Risks/Results
  • 24.
    24 Commerce Slides 1 NewLogo Incentive Programs2 3 RE-BRANDING PLAN Intro Situation Complication Objectives Proposal Timeline Risks/Results Advertising Campaign
  • 25.
    Unmotivated Heavy Motivated LightMotivated Non-User Motivated Medium ● Digital Savvy ● Live in Capital Region ● Find travel stressful ● Women and Singles ● Environmentally aware ● Capital region and Aarhus ● Elder and Married ● Capital region and large cities ● High income ● Rural demographic ● 2+ km away from train stations ● Take car or bus TARGET MARKET SEGMENTS
  • 26.
    Intro Situation ComplicationObjectives Proposal Timeline Risks/Results 1 New Logo
  • 27.
    Referral Program Loyalty Program ● 5 kmper referral (around 20% of average trip: Appendix C) ● Gain market share through continuous referrals ● Integrated through mobile app ● Discounted pricing for travel times around rush hour ● 5% of kilometers travelled awarded back ● Integrated through app ● Retain customers through incentives 2 Incentive Programs
  • 28.
    Advertisements Television • Advertisements focusedon new station features, app and +time • Market: All targeted Social Media • Facebook, Instagram and Twitter ads with direct link to app and info on sustainability • Market: Unmotivated heavy and Motivated medium Billboards • Billboards with a focus on +time and sustainability around less populated areas • Market: Motivated non-users 3
  • 29.
    29 Commerce Slides Potential MarketGrowth Intro Situation Complication Objectives Proposal Timeline Risks/Results Bull • 4% market growth in one Year • Approximately 2,475,000,000 km (Appendix C) Conservative • 3% market growth • Approximately 1,855,000,000 km (Appendix C) Bear • 2% market growth • Approximately 1,240,000,000 km (Appendix C)  Total Expense: 16,600,000 Krone or 2,400,000 USD (.05% of annual budget)
  • 30.
    Task Year 1 Year 2 Year 3 Unveil Logo Marketing Launch Plan App Development AppLaunch App Support Construct New Parking Safety Construction Adjust Pricing 30IMPLEMENTATION TIMELINE
  • 31.
    31 Commerce Slides ● Performanceof marketing campaign depends on many factors ● Limited time to change brand- image ● Innovations in sustainable transport ● Customer retention ● East-West construction will cause periodic delays for 3 years Low Medium High Intro Situation Complication Objectives Proposal Timeline Risks/Results RISKS
  • 32.
    IMPACT Economic Political Reputational •Expanded customer base • App as alternate revenue stream • Meeting high demand • DSB serves as backbone of Denmark’s transportation • Political expectation for growth satisfied • Seamlessly integrated user experience • Delays, traffic info, security • Communicating change to the consumer Intro Situation Complication Objectives Proposal Timeline Risks/Results
  • 33.
  • 34.
    Appendix A: ITDevelopment Financials ● $500,000 for frontend and backend development ○ As seen in instagram and ubers development (source: https://savvyapps.com/blog/how-much-does-app-cost-massive-review-pricing- budget-considerations) ● $20,000 to restructure train & rail system GPS infrastructure ○ Source: http://www.gps.gov/applications/rail/ ● 0.05% per transaction ~ $20,000 set-up ○ Source: https://paylinedata.com/pricing/ ● $20,000 ad revenue per month ○ 160million monthly users * 50% ○ Source: http://ryanmorel.com/mobile-advertising-calculator/ ● New customer acquisition rate estimate = .005% ○ Population with smart phones = .73(total population) = 4.03mil ○ ~$2,000 in ad revenue calculated from ○ Source: http://ryanmorel.com/mobile-advertising-calculator/
  • 35.
    Appendix B: Re-StructuringFinancials ● 2,800,000 in Expenses ○ Parking spots = (200 stations)*(10,000 Krone per parking lot) = 2,000,000 Krone ○ ECB= (400 stations)*(2,000 Krone per station) = 800,000 ● Ticket Prices ○ http://www.fyidenmark.com/ticketprices.html ● 9,600,000 Krone in Revenue ○ Revenue = (2,000 customers per month)*(48 months per 2 years)*(100 Krone per ticket)= 9,600,000 Krone ● Conservative monthly new customer acquisition rate estimate = .05% ○ Population with cars= .70(total population) = 3.92mil*.0005= 1,996 potential customers
  • 36.
    Appendix C: BrandingFinancials Kilometers travelled through DSB: 6,246,000,000 (10.1% market share) Total Kilometers travelled in Denmark: Approx. 62,000,000,000 passenger km 4% market share: 62,000,000,000 * .04 = 2,475,000,000 passenger km 3% market share: 62,000,000,000 * .03 = 1,855,000,000 passenger km 2% market share: 62,000,000,000 * .02 = 1,240,000,000 passenger km Expenses(1 year) 2 ads a day on primetime: 6,800,000 Krone 4 ads non-primetime: 6,800,000 Krone Make 6,000,000 impressions with 250,000 downloads: 2,000,000 Krone 40 billboards in rural areas: 1,000,000 krone Total: 16,600,000 krone Average trip length: Passenger kilometer / Total trips taken(domestic + abroad) 6,246,000,000 / (191,881,000 + 9,185,000) = 31.1 km 6 km / 31.1 km = .19%
  • 37.