Download to read offline


![ArticleRESEARCH
5 4 | N A T U R E | V O L 5 3 7 | 1 s e p te m b er 2 0 1 6
apparent until one year. Given that clearance of Aβ could be followed by
recovery of neuronal function, a lag between reduction of Aβ burden
and slowing of disease progression is not altogether surprising.
The main safety finding, ARIA-E, was dose-dependent and more
common in ApoE ε4 carriers, consistent with findings with other
anti-Aβ monoclonal antibodies7,16,17
. Although the underlying cause
of ARIA is not well understood, it is likely that the MRI signal of ARIA
is due to increased extracellular fluid. This may be a result of underlying
CAA, changes in perivascular clearance and vascular integrity, or local
inflammatory processes associated with Aβ-targeting therapies17–20
(see
Supplementary Information for further discussion).
Study limitations of the PRIME phase 1b study included staggered
parallel-group design, small sample sizes, limited region (USA only),
and possible partial unblinding due to ARIA-E. Measures were taken
to maintain blinding to adverse effects: raters of given tests were not
permitted to perform other clinical assessments, and were blinded to
other assessments (for example, MMSE and CDR raters were required
to be different and neither were permitted to perform other study
assessments). Post hoc analyses of change from baseline PET SUVR
composite score and cognition by presence/absence of ARIA suggested
no apparent difference in treatment effect when comparing patients
with and without ARIA-E (Extended Data Table 4). There was overlap
in enrolment in Arms 1–3 (aducanumab 1 and 3 mg kg−1
, placebo) and
Arms 4 and 5 (aducanumab 10 mg kg−1
, placebo) but Arms 6 and 7
(aducanumab 6 mg kg−1
, placebo) were initiated after enrolment in
Arms 1–5 was complete. This was a small study designed for assessment
of safety and tolerability, and for detecting a pharmacological effect on
brain Aβ levels measured by PET imaging. The trial was not powered
for the exploratory clinical endpoints, thus the clinical cognitive results
should be interpreted with caution. Primary analyses were based on
observed data with no imputation for missing values, nominal P values
were presented with no adjustments for multiple comparisons, and they
were supported by sensitivity analyses using a MMRM.
DEA fraction
PBS 0.3 1 3 10 30
0
20
40
60
80
100
120 Aβ40
Aβ42
Aβ40
Aβ42
6E10
ThioS
6E10
ThioS
Dose (mg kg–1)
%ofcontrol
Guanidine fraction
PBS 0.3 1 3 10 30
Dose (mg kg–1)
%ofcontrol
Cortex
PBS 0.3 1 3 10 30
0
20
40
60
80
100
120
Dose (mg kg–1)
%ofcontrol
Hippocampus
PBS 0.3 1 3 10 30
0
20
40
60
80
100
120
Dose (mg kg–1)
%ofcontrol
*** *
* ** **
0
20
40
60
80
100
120
** **
* ** *
a b
c d
g hVascular amyloid—cortex
PBS 3 10 30
0
0.05
0.10
Dose (mg kg–1)
ThioS-positivearea(%)
Vascular amyloid—hippocampus
PBS 3 10 30
0
0.01
0.02
0.03
Dose (mg kg–1)
ThioS-positivearea(%)
e f
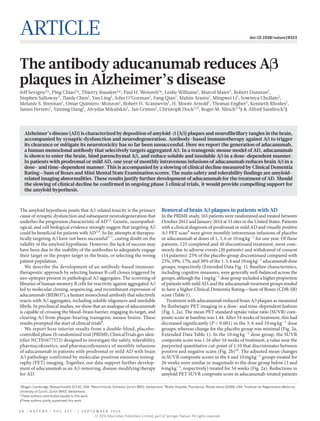
Figure 4 | Reduction of amyloid burden following weekly dosing with
ch
aducanumab in 9.5- to 15.5-month-old Tg2576 transgenic mice.
a, b, Aβ40 and Aβ42 levels in soluble DEA (a) and insoluble GuHCl (b)
brain fractions. c, d, Total brain Aβ (6E10) and compact amyloid plaques
(ThioS) in cortex (c) and hippocampus (d) (mean ± s.e.; n = 20–55;
dotted line 50% reduction; *P < 0.05 versus control). e–h, ThioS staining
of amyloid deposits (e) and Visiopharm software (f) differentiated
parenchymal deposits (green) from vascular deposits (red) (representative
pictures 10× magnification), and quantified area of vascular amyloid
(g, h; mean ± s.e.; n = 20–24).
c
Monomer
Oligomer
Peptide
IP: control antibody
IP: 3D6
IP:
ch aducanum
ab
Fibril
0.0001 0.001 0.01 0.1 1 10 100
0
0.4
0.8
1.2
1.6
chaducanumab
3D6
[Antibody] (nM)
Absorbance(450nm)
0.001 0.01 0.1 1 10 100 1000
0
1
2
3
a b
chaducanumab
3D6
[Biotin–Aβ40] (nM)
Absorbance(450nm)
d e
100 μm 50 μm
Figure 5 | Aducanumab binds selectively to insoluble fibrillar and
soluble oligomeric Aβ aggregates. a, Binding of ch
aducanumab or 3D6 to
immobilized fibrillar Aβ42. Mean ± s.d., in triplicate. b, Capture of soluble
monomeric Aβ40 with immobilized ch
aducanumab or 3D6. Mean ± s.d., in
triplicate. c, Dot blots of Aβ42 monomer, soluble oligomers, or insoluble
fibrils immunoprecipitated with ch
aducanumab, 3D6, or irrelevant
antibody control. Equivalent concentrations confirmed by direct dot
blotting (Peptide). d, e, Immunostaining of Aβ in autopsy brain tissue from
a patient with AD with ch
aducanumab (0.2 μg ml−1
) (d) and 22-month-old
Tg2576 transgenic mouse brain tissue with aducanumab (60 ng ml−1
) (e).
© 2016 Macmillan Publishers Limited, part of Springer Nature. All rights reserved.](https://image.slidesharecdn.com/5af6d01d-65d9-4218-9214-68b1e65bdfef-160906081127/85/nature19323-5-320.jpg)


The antibody aducanumab reduces amyloid beta (Aβ) plaques in patients with Alzheimer's disease in a dose- and time-dependent manner according to interim results from a phase 1b clinical trial. Monthly intravenous infusions of aducanumab for one year reduced brain Aβ plaques as measured by PET imaging in patients with prodromal or mild Alzheimer's disease. This Aβ reduction was accompanied by a slowing of clinical decline on measures of cognition and function. The main safety finding was amyloid-related imaging abnormalities that generally resolved over time and did not require hospitalization. These results support further development of aducanumab as a potential disease-modifying therapy for Alzheimer's disease.


![Aducanumab [New Drug].pptx (IgG1) monoclonal antibody](https://cdn.slidesharecdn.com/ss_thumbnails/aducanumabnewdrug-241106052542-81704708-thumbnail.jpg?width=640&height=640&fit=bounds)


