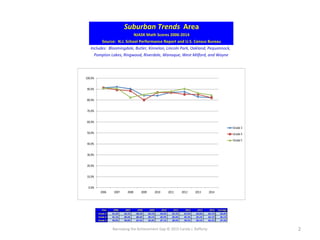
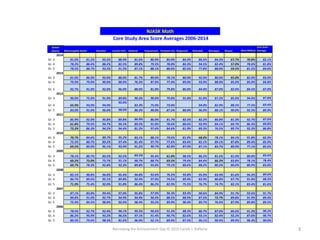
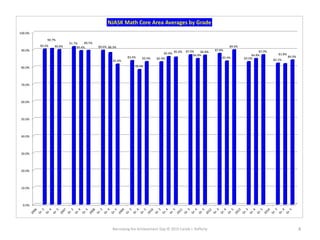
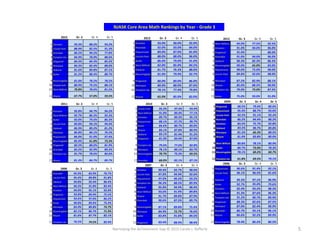
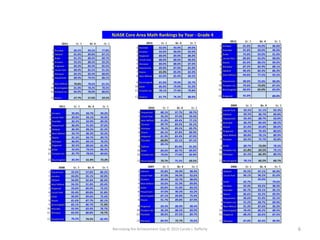
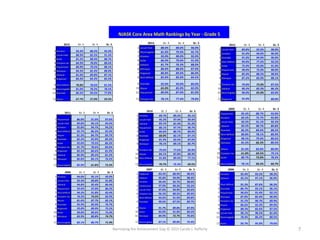
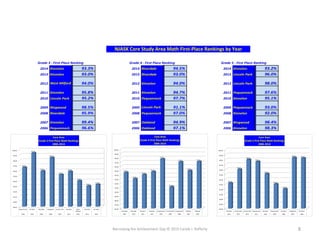
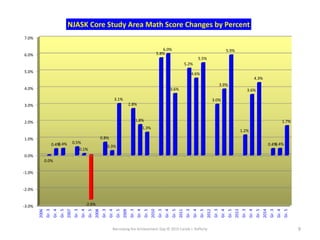
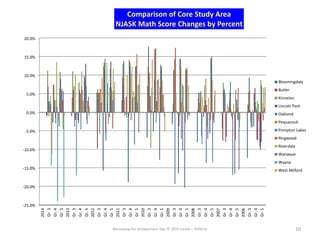
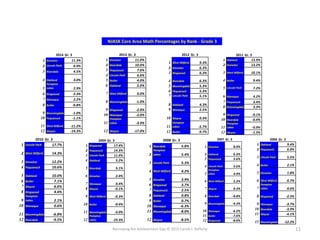
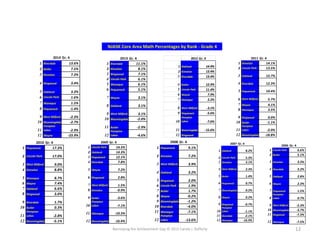
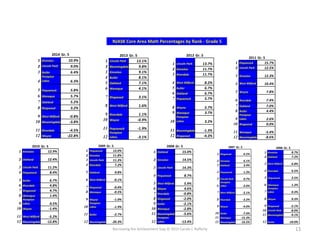
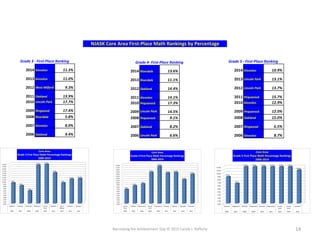
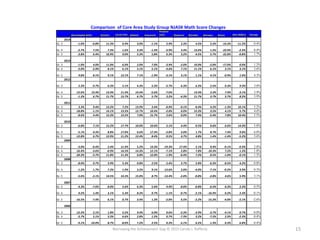
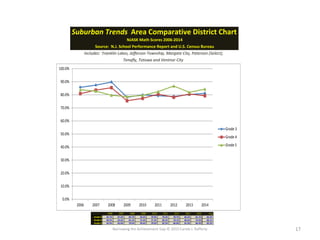
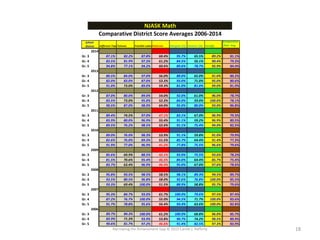
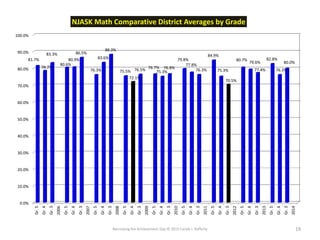
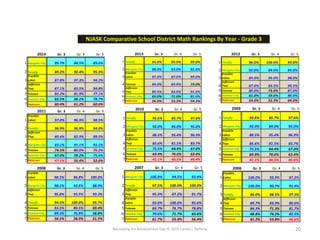
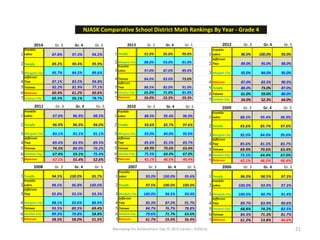
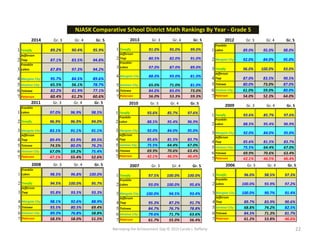
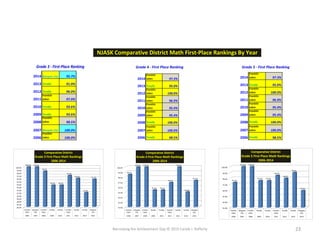
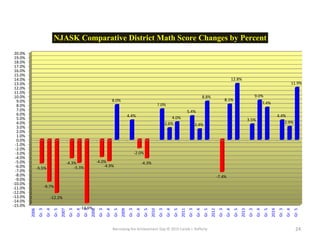
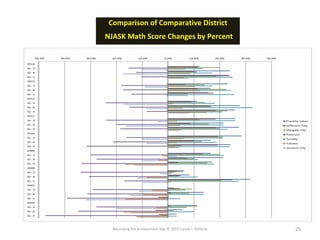
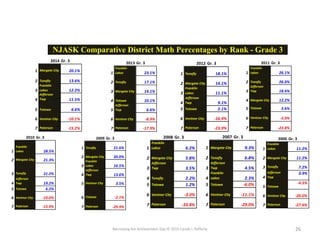
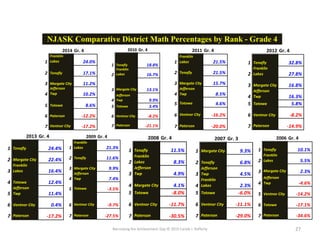
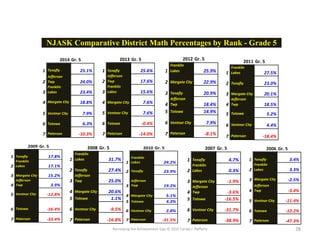
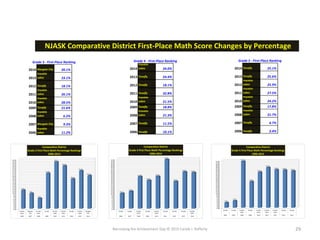
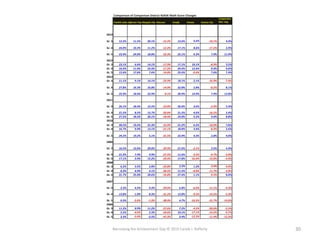
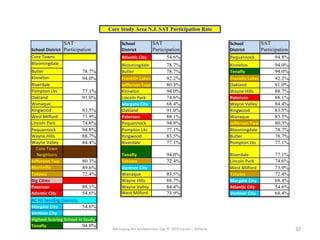
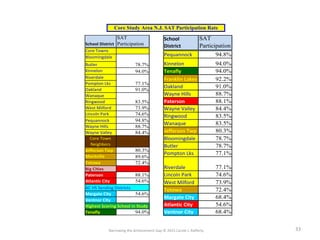
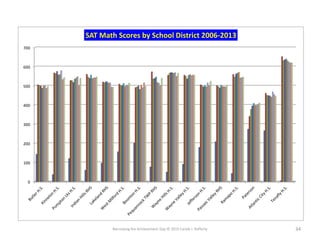
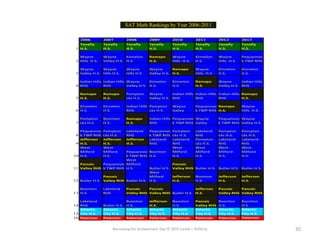
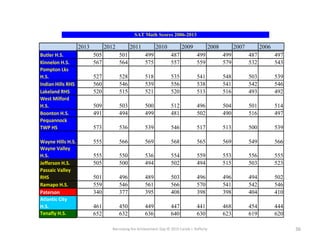
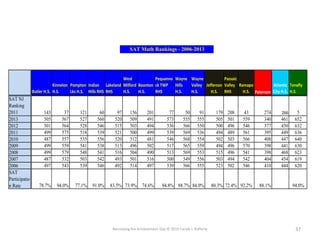
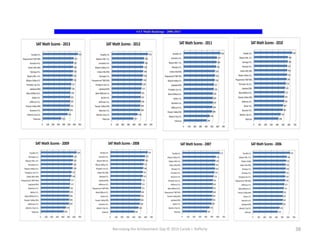
The document presents data on NJASK math scores from 2006 to 2014 for grades 3 through 5 in 12 suburban school districts. It includes line graphs showing average scores by grade over time have generally increased from the 80s/90s to the high 80s, tables listing the exact scores for each district and grade by year, and rankings of districts' scores by grade for selected years. The data shows trends in math scores across districts and grades over the studied period.