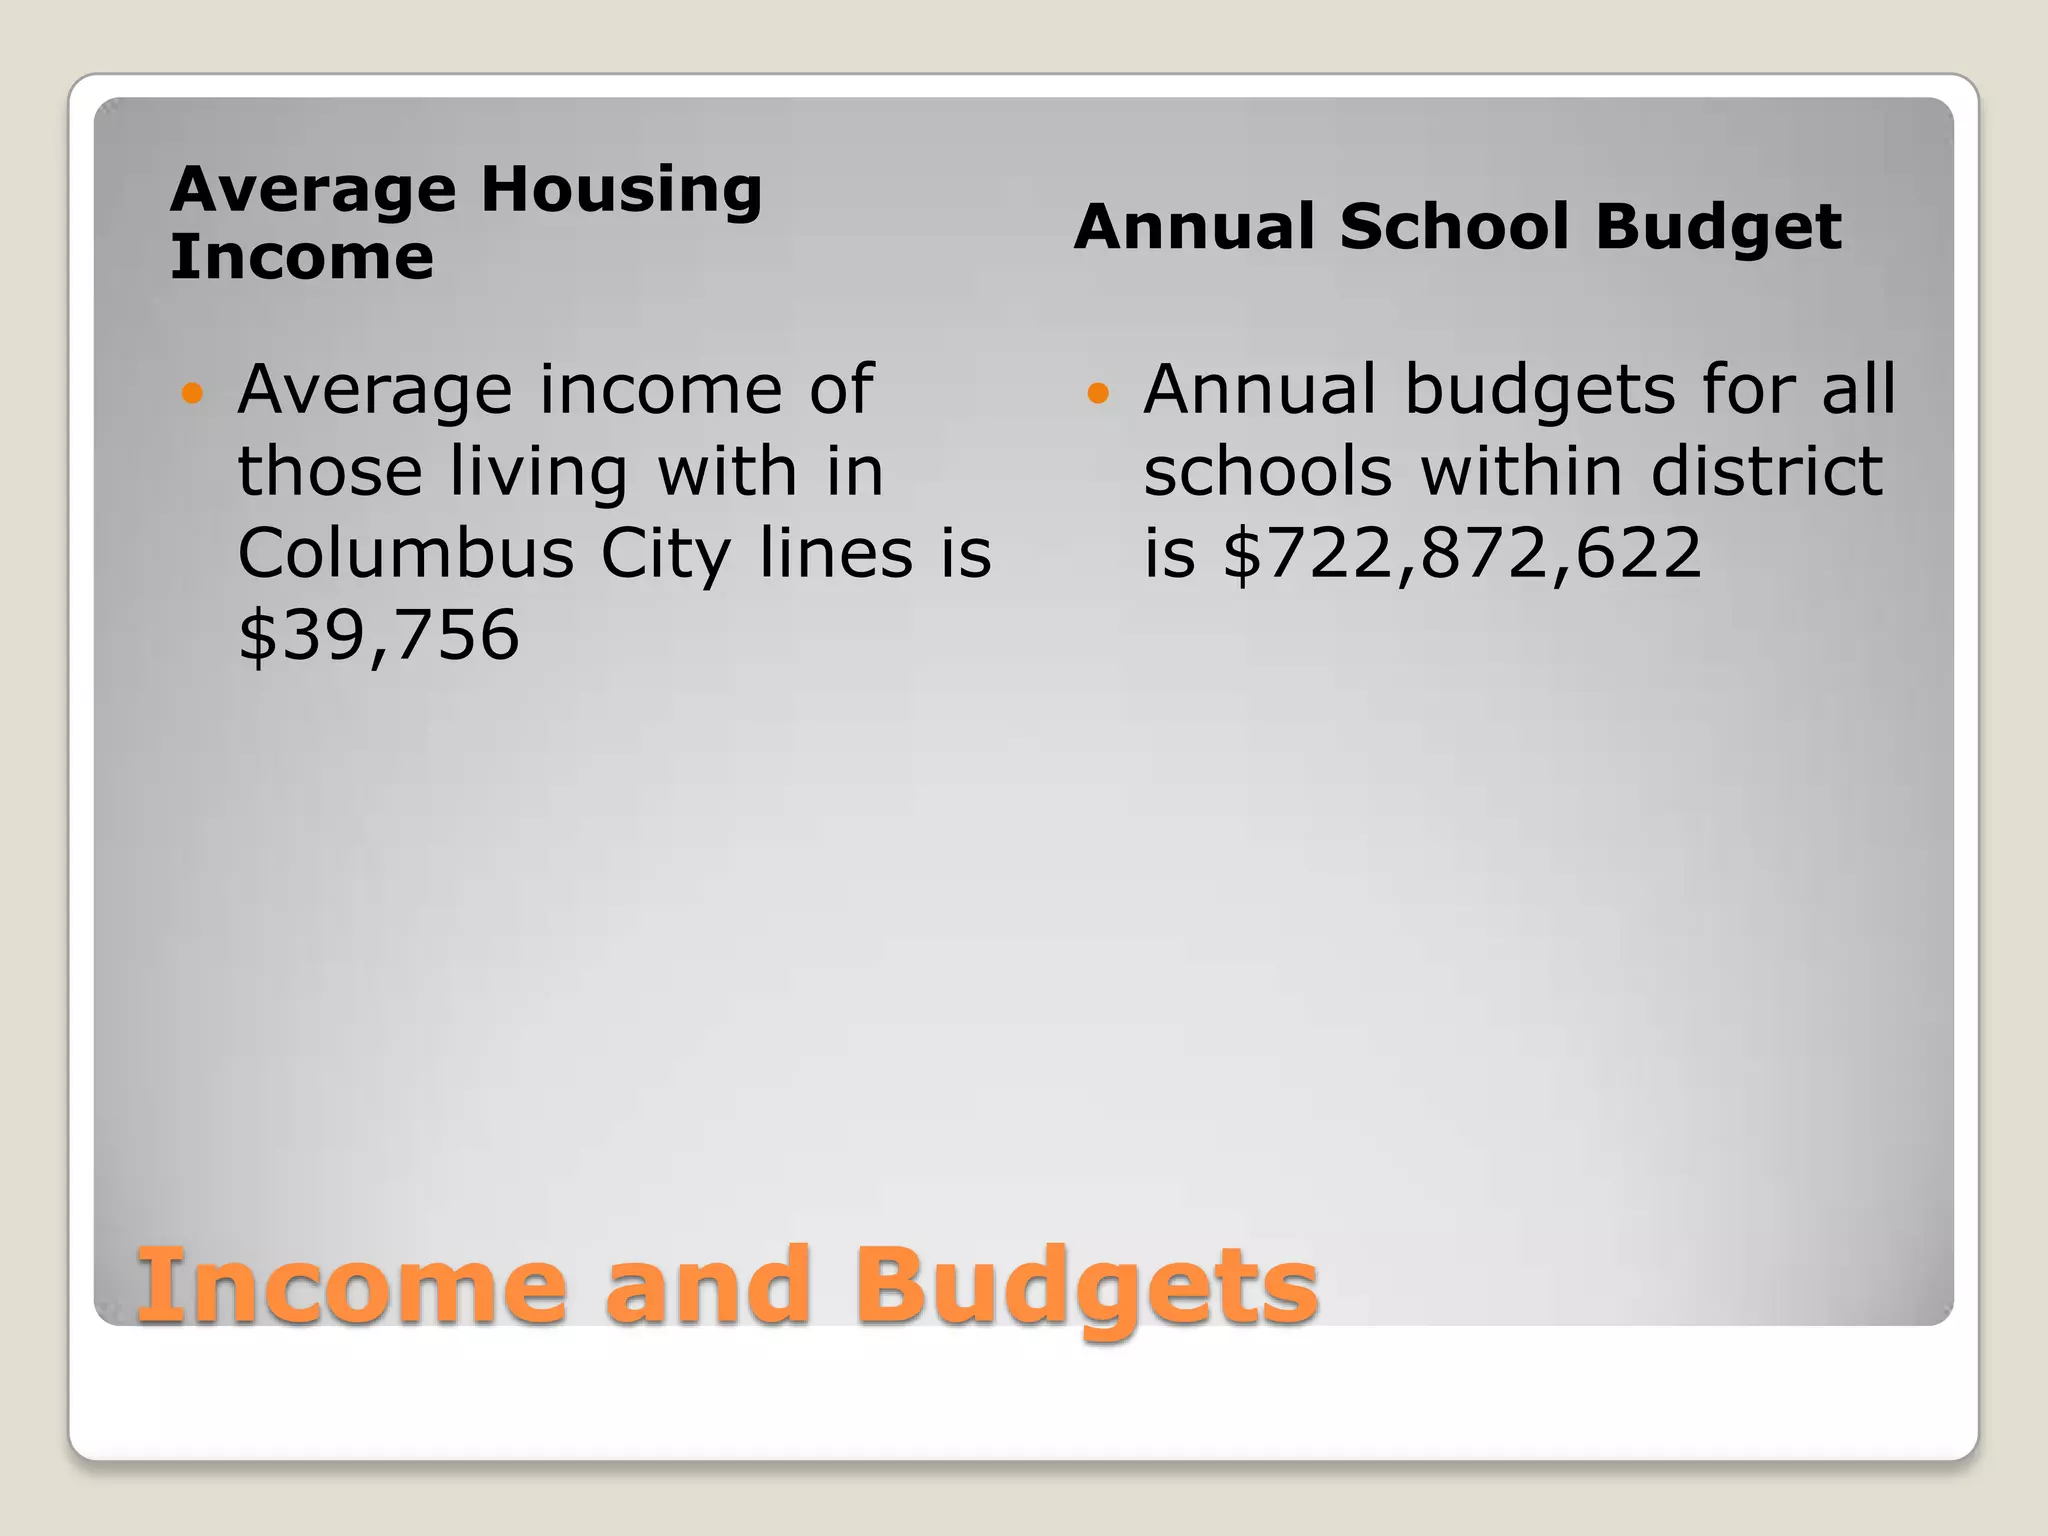
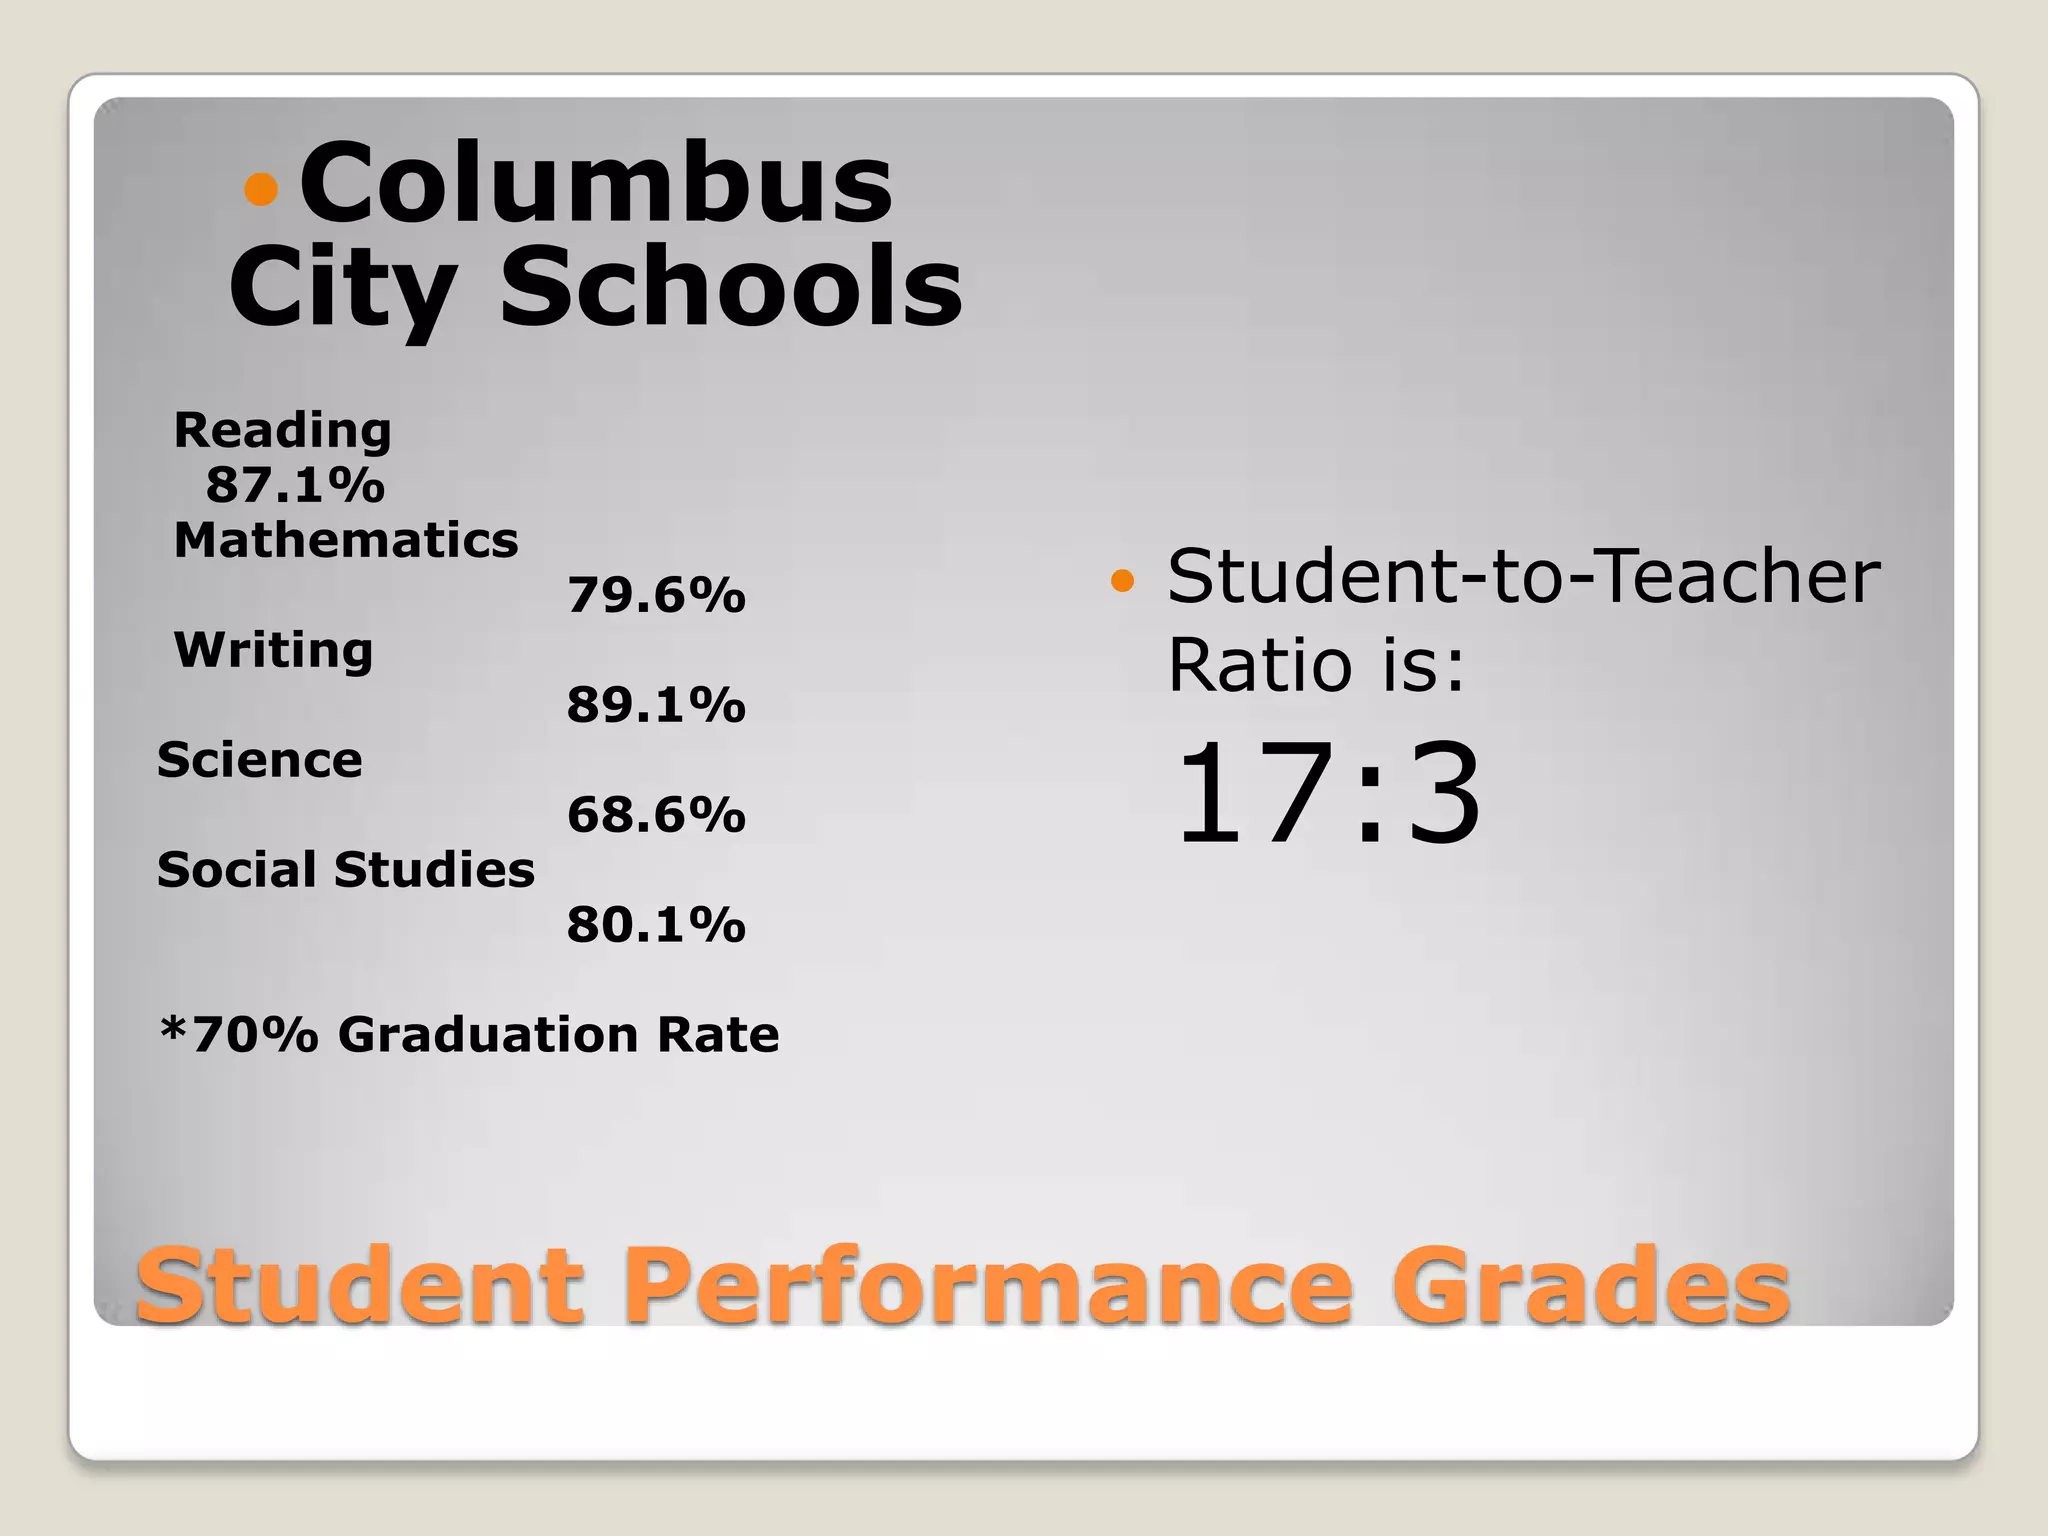
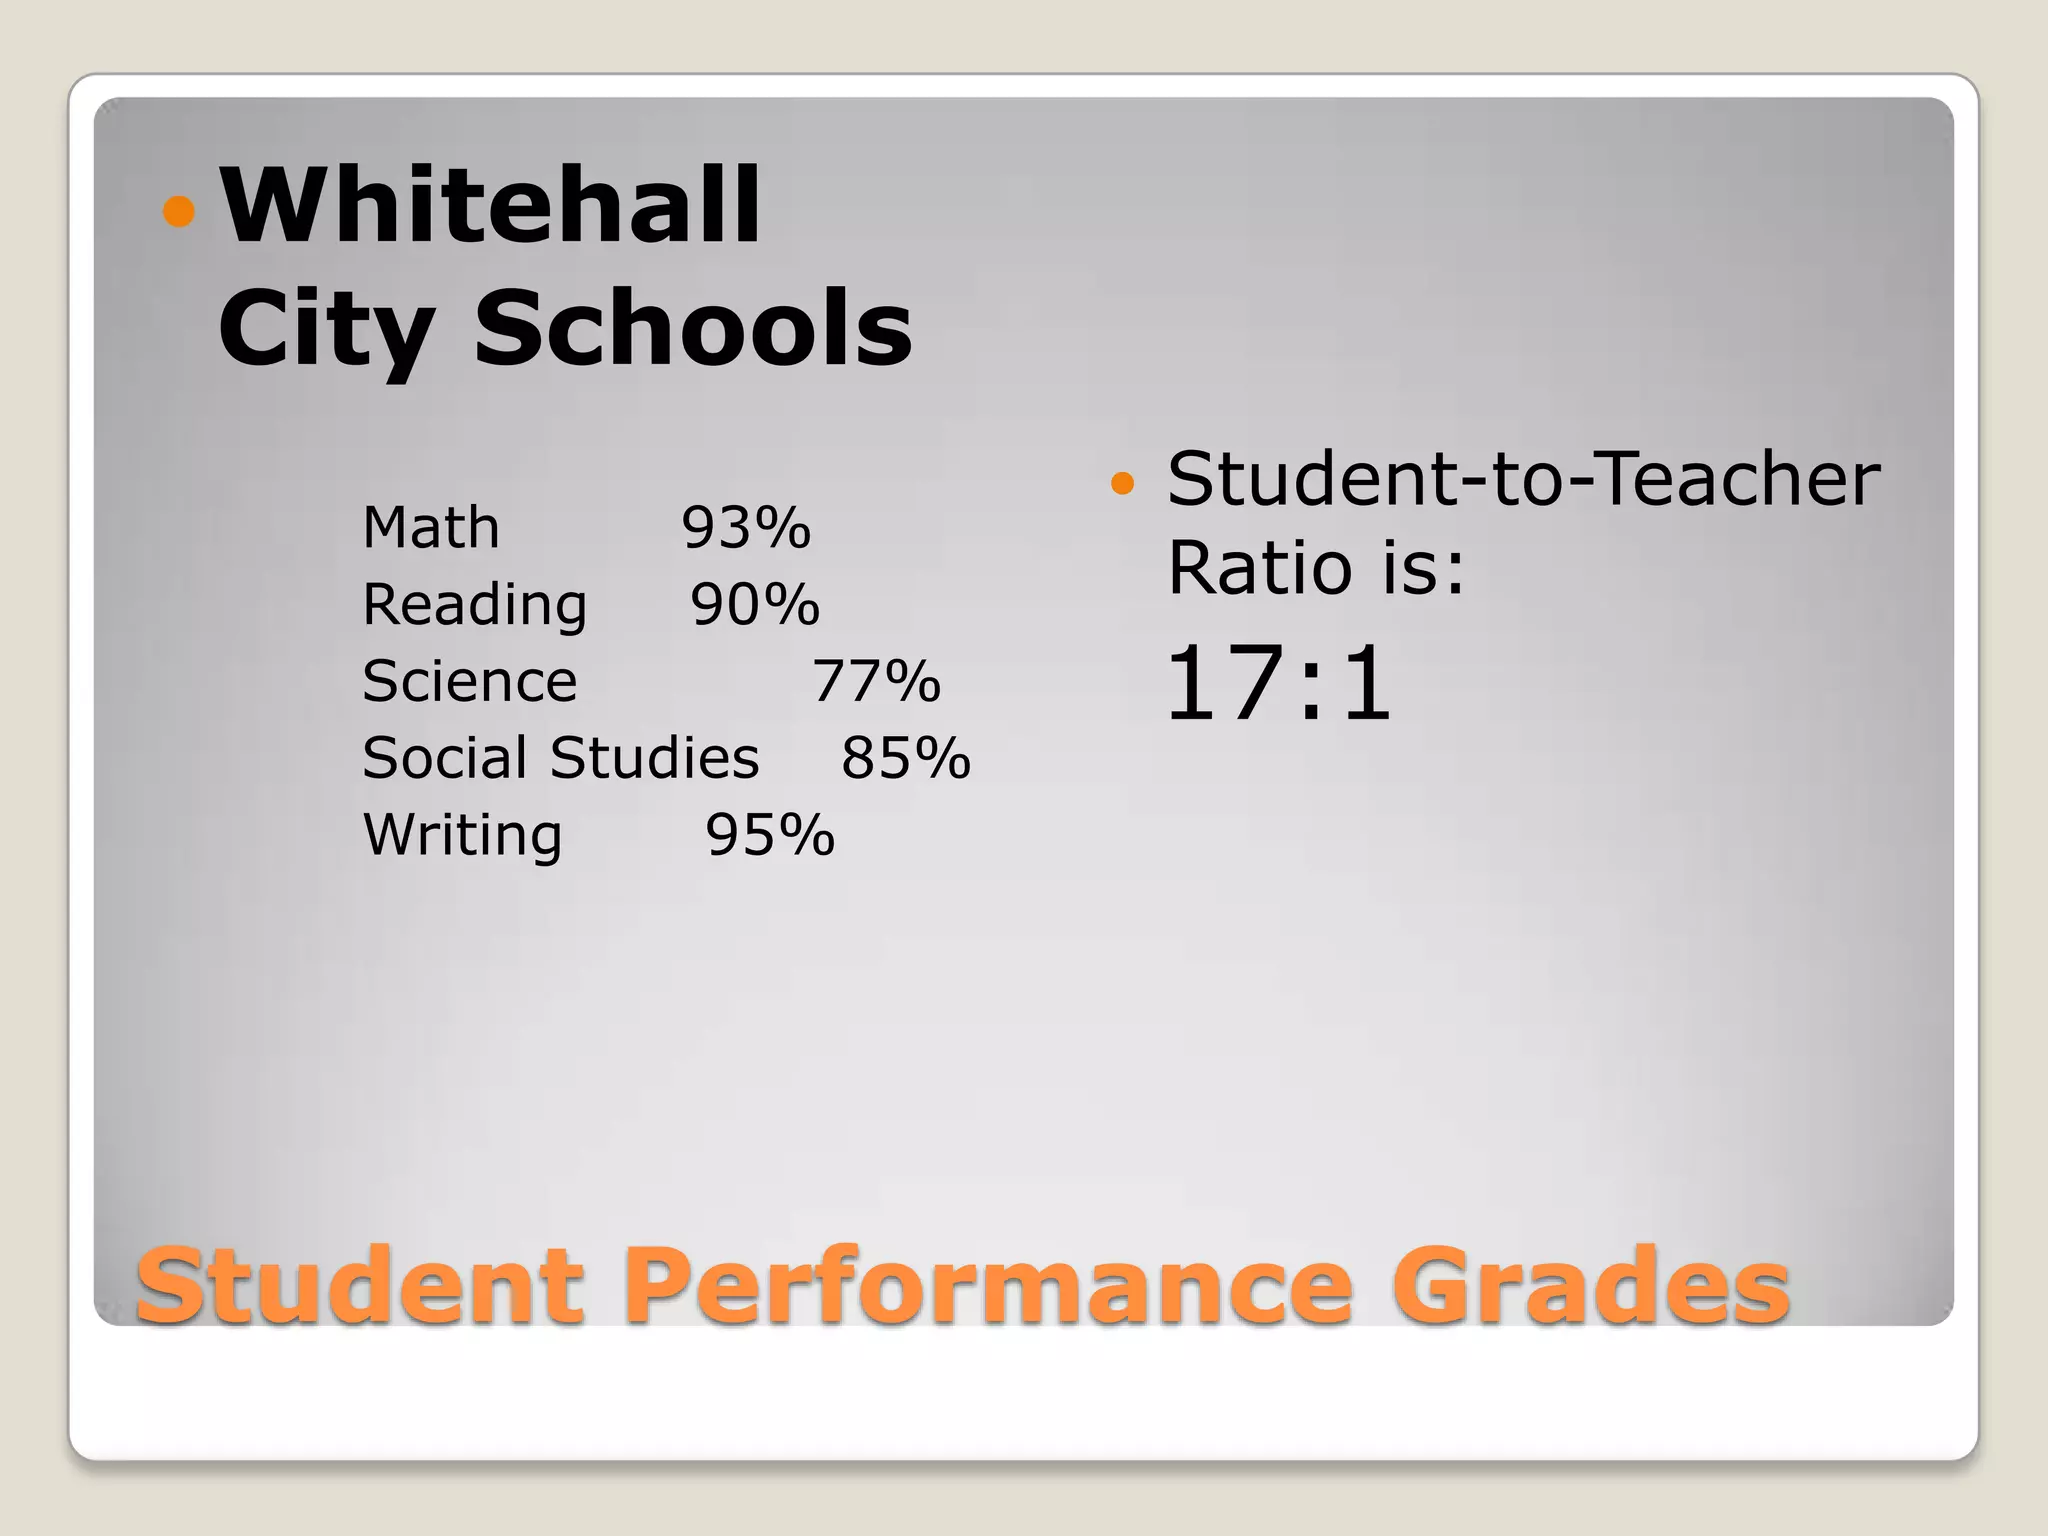
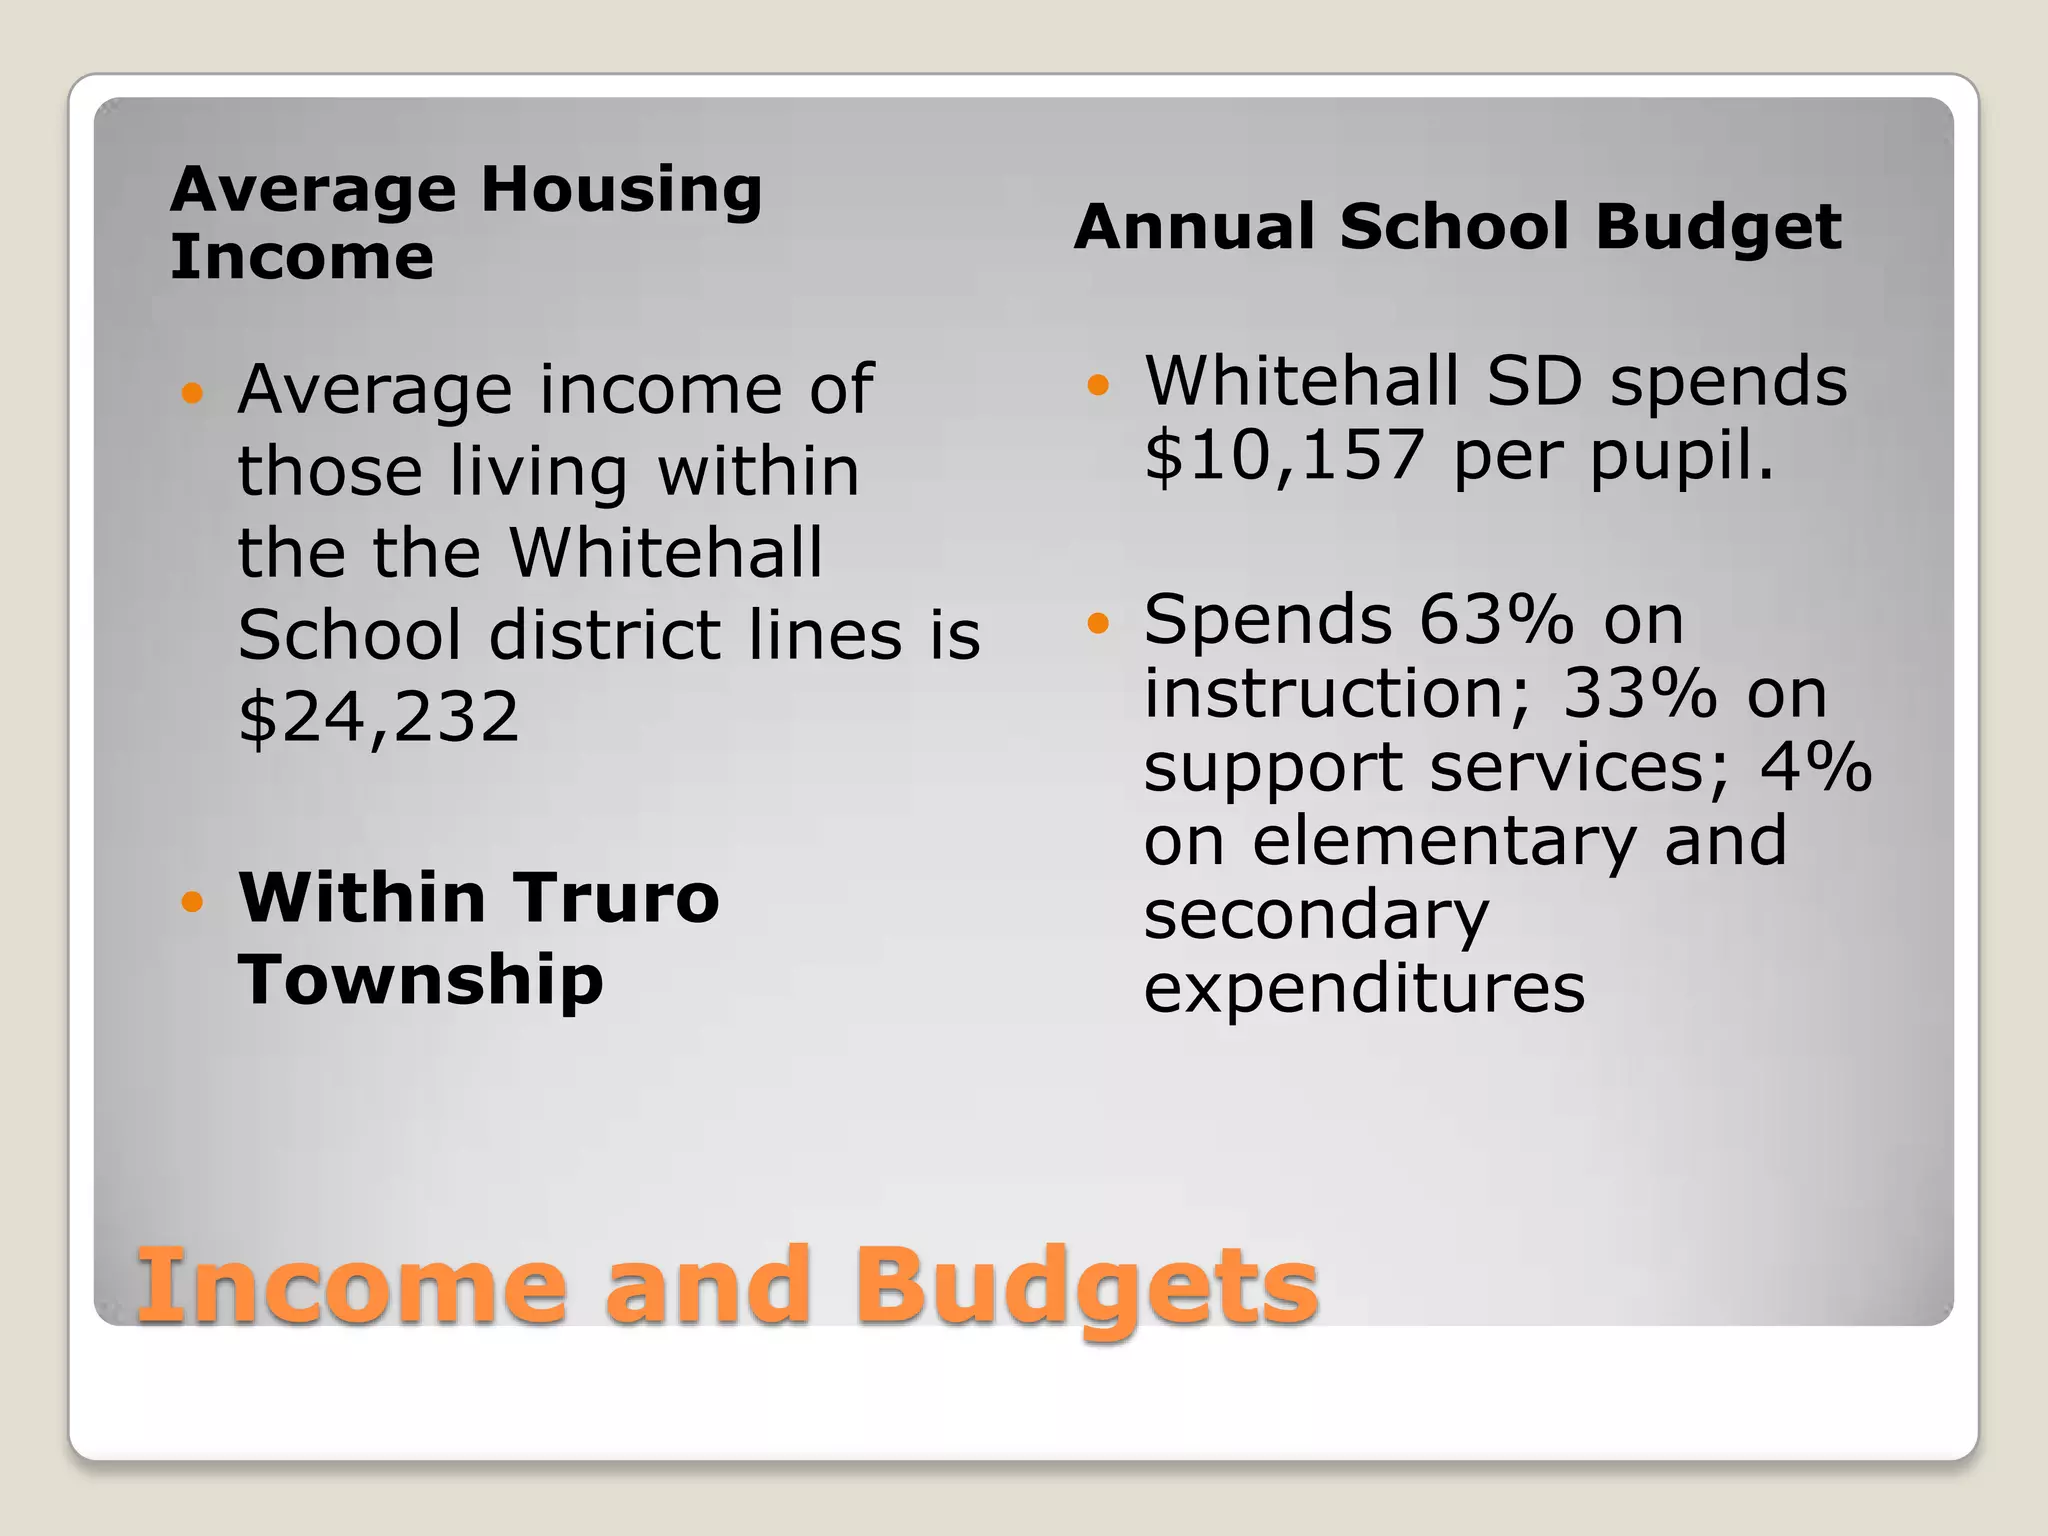
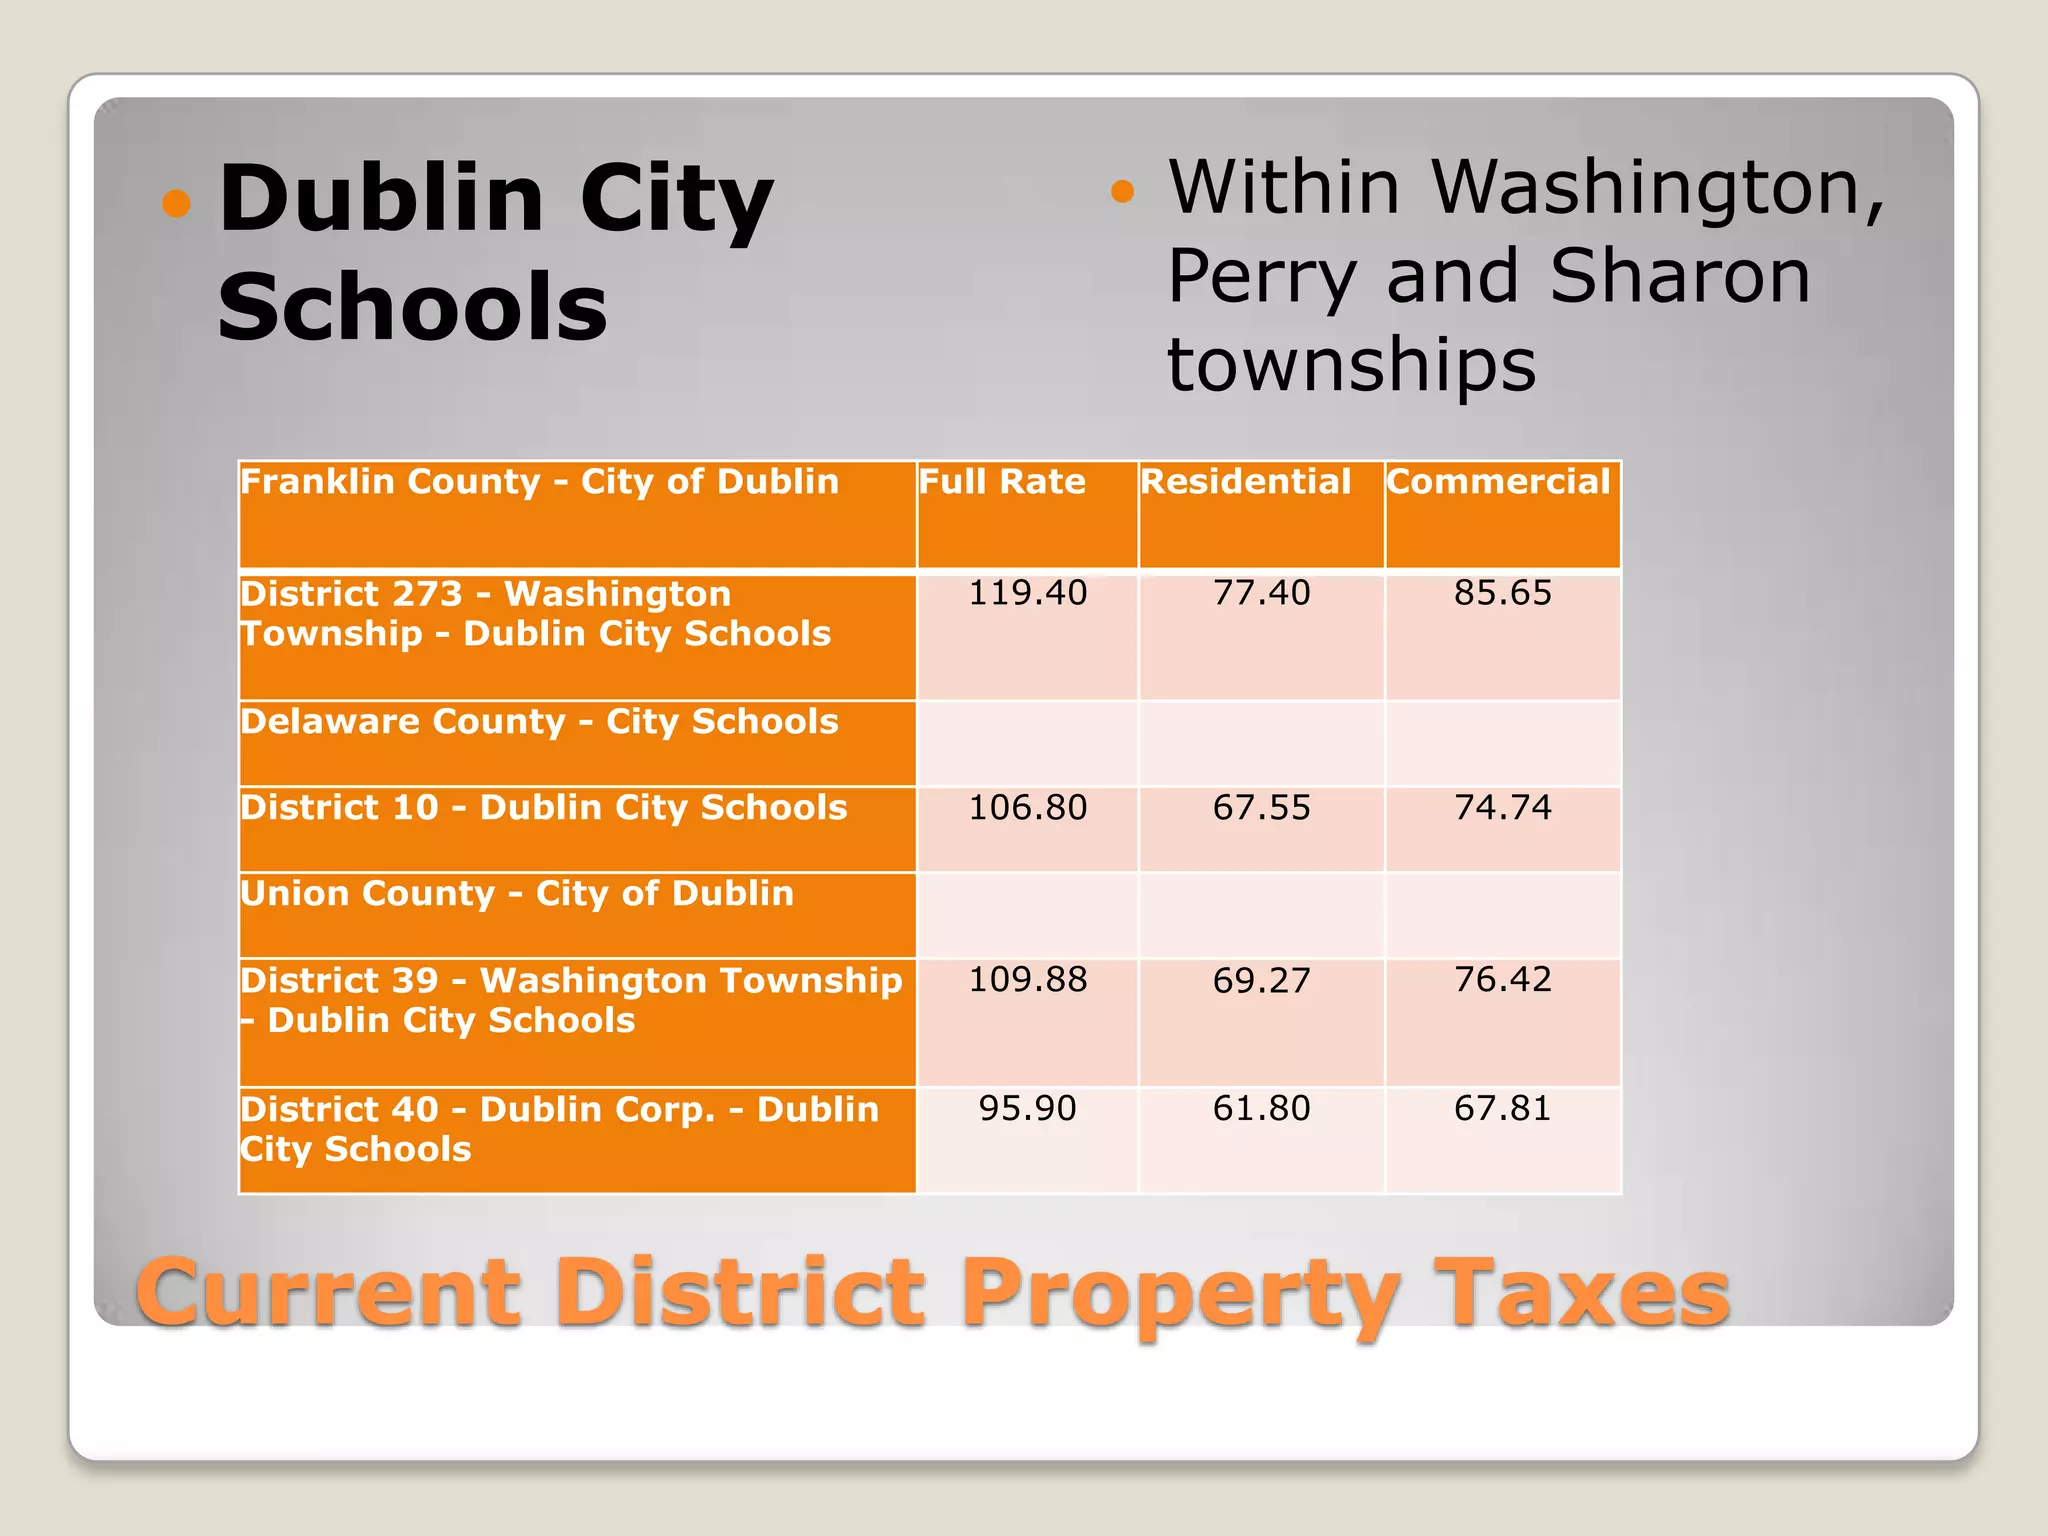
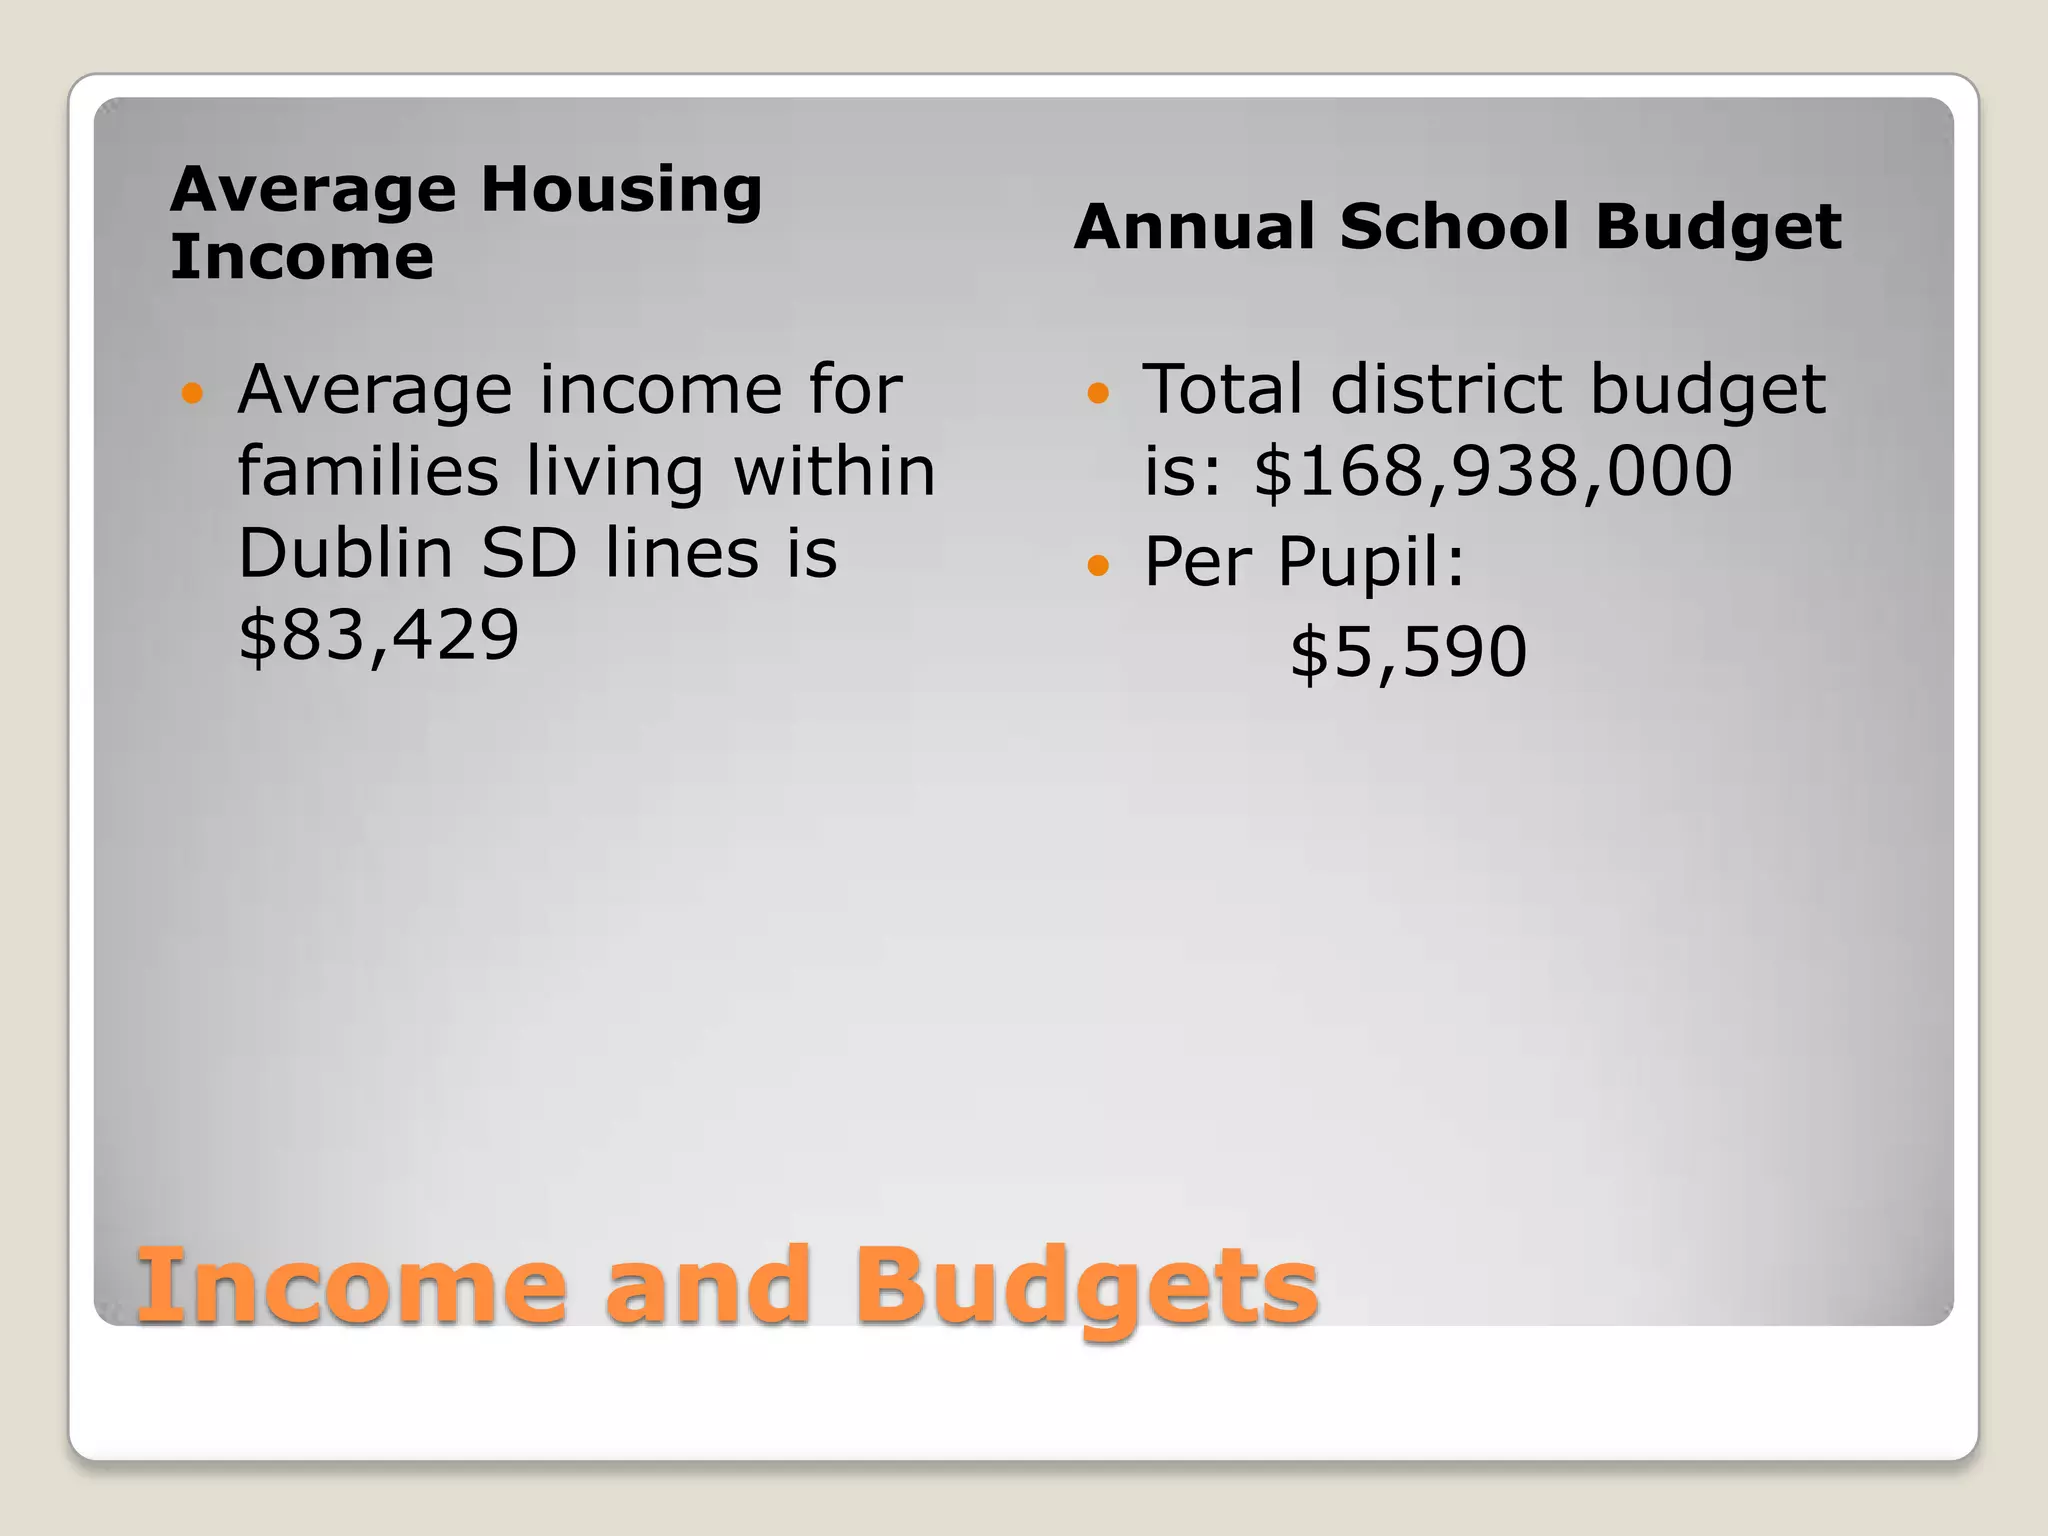
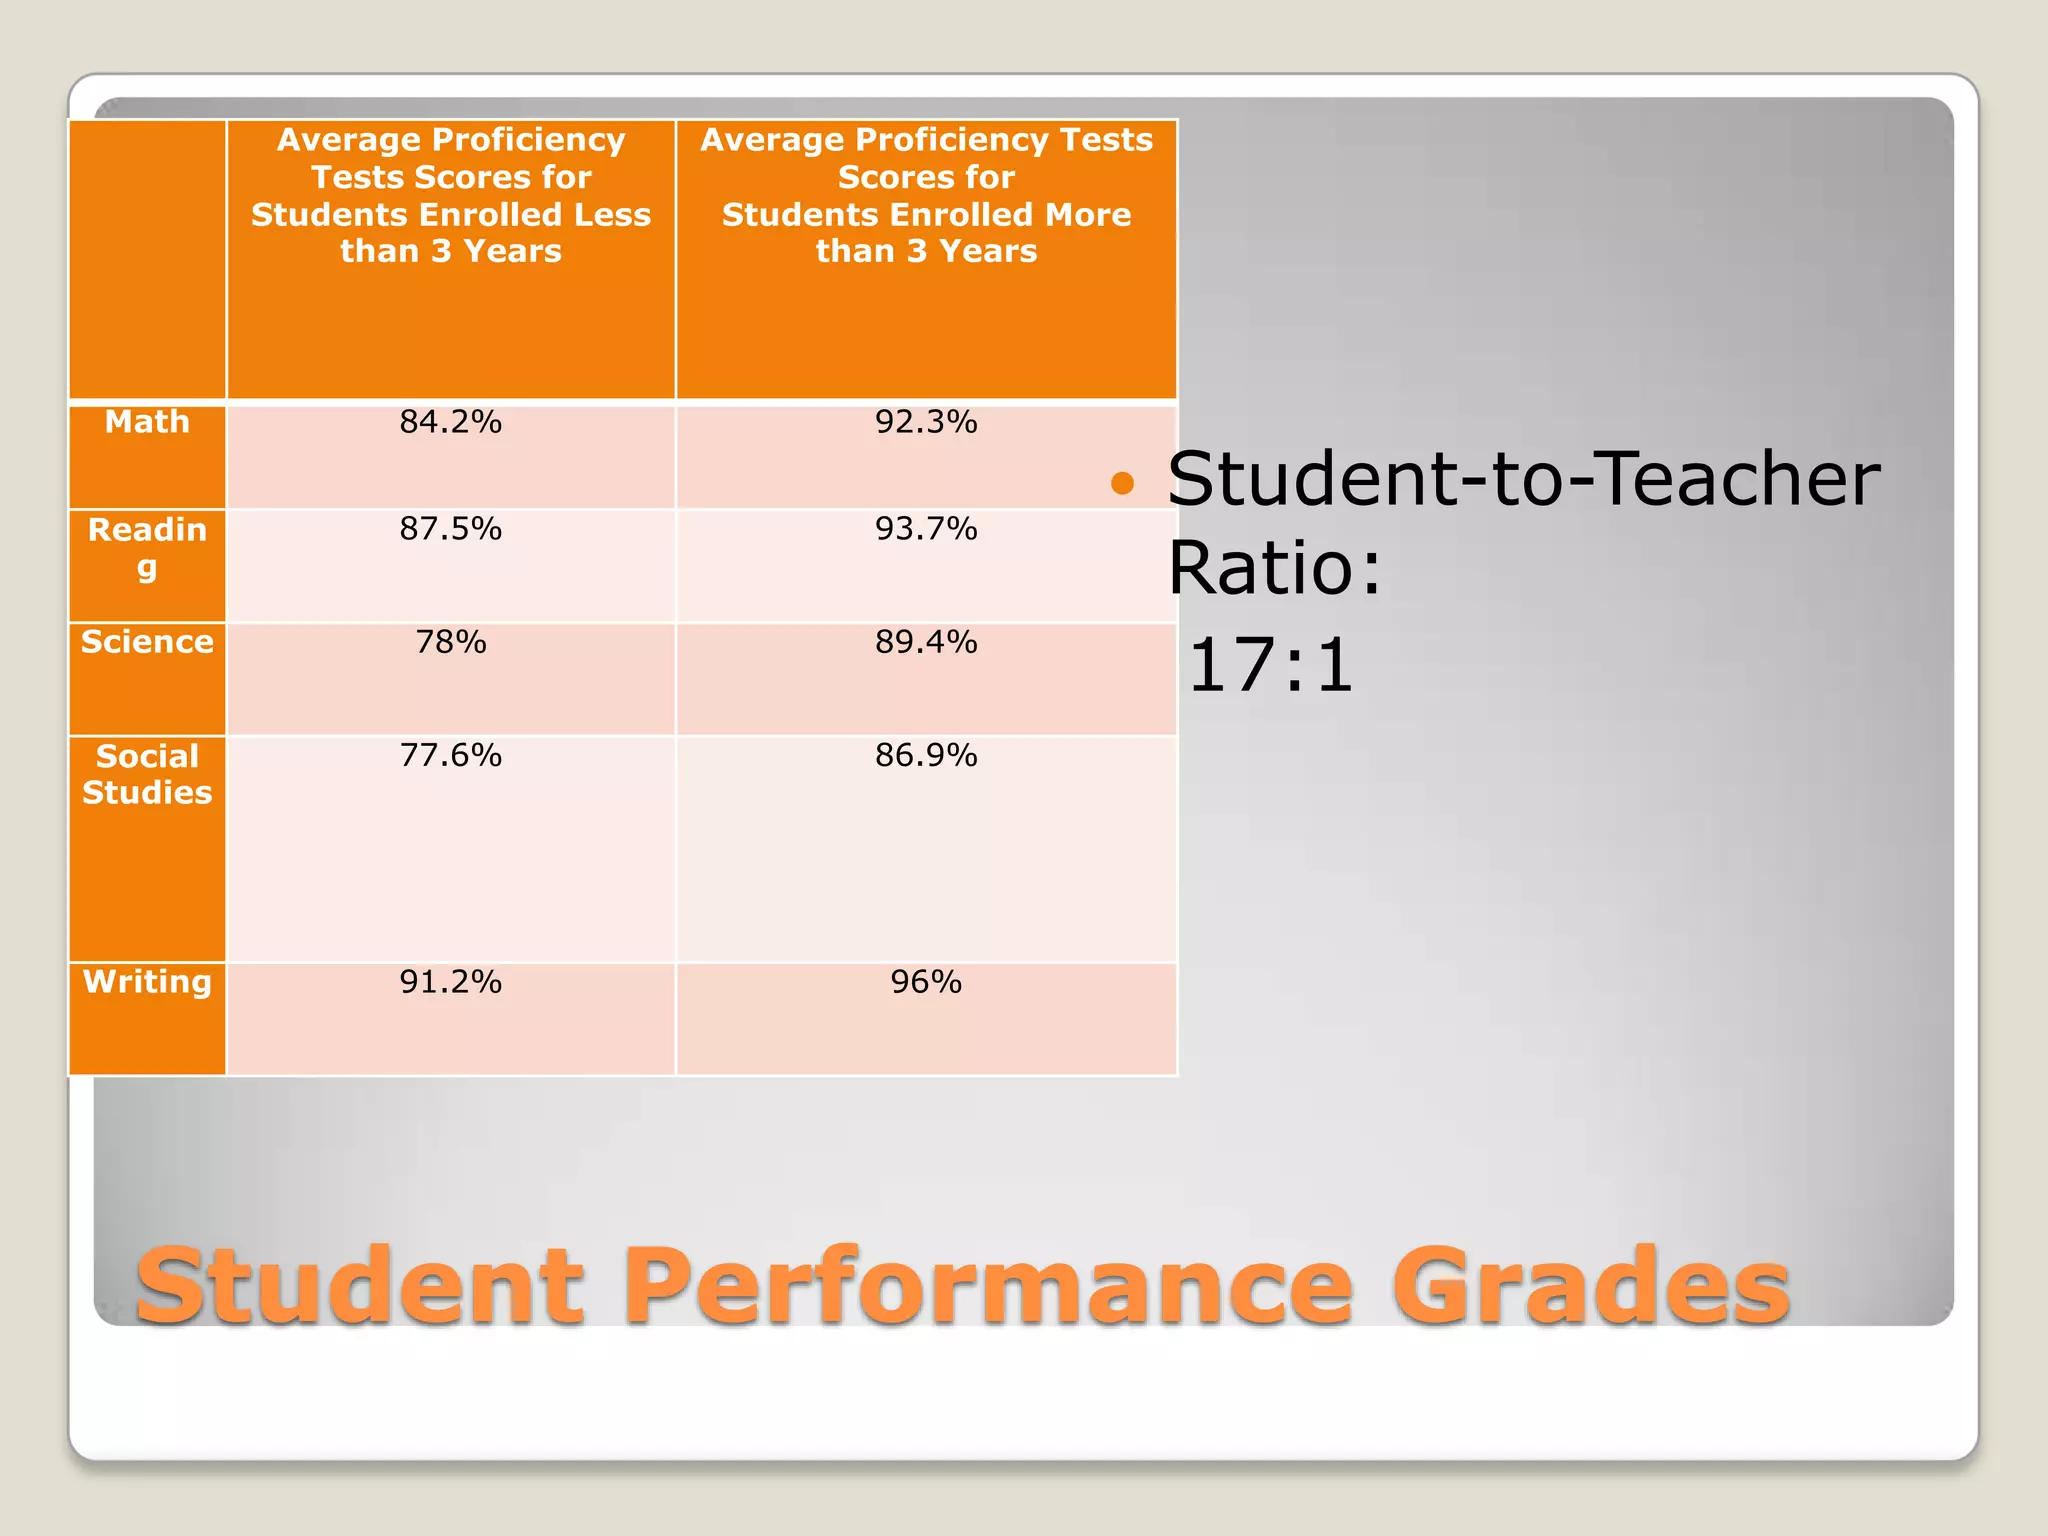
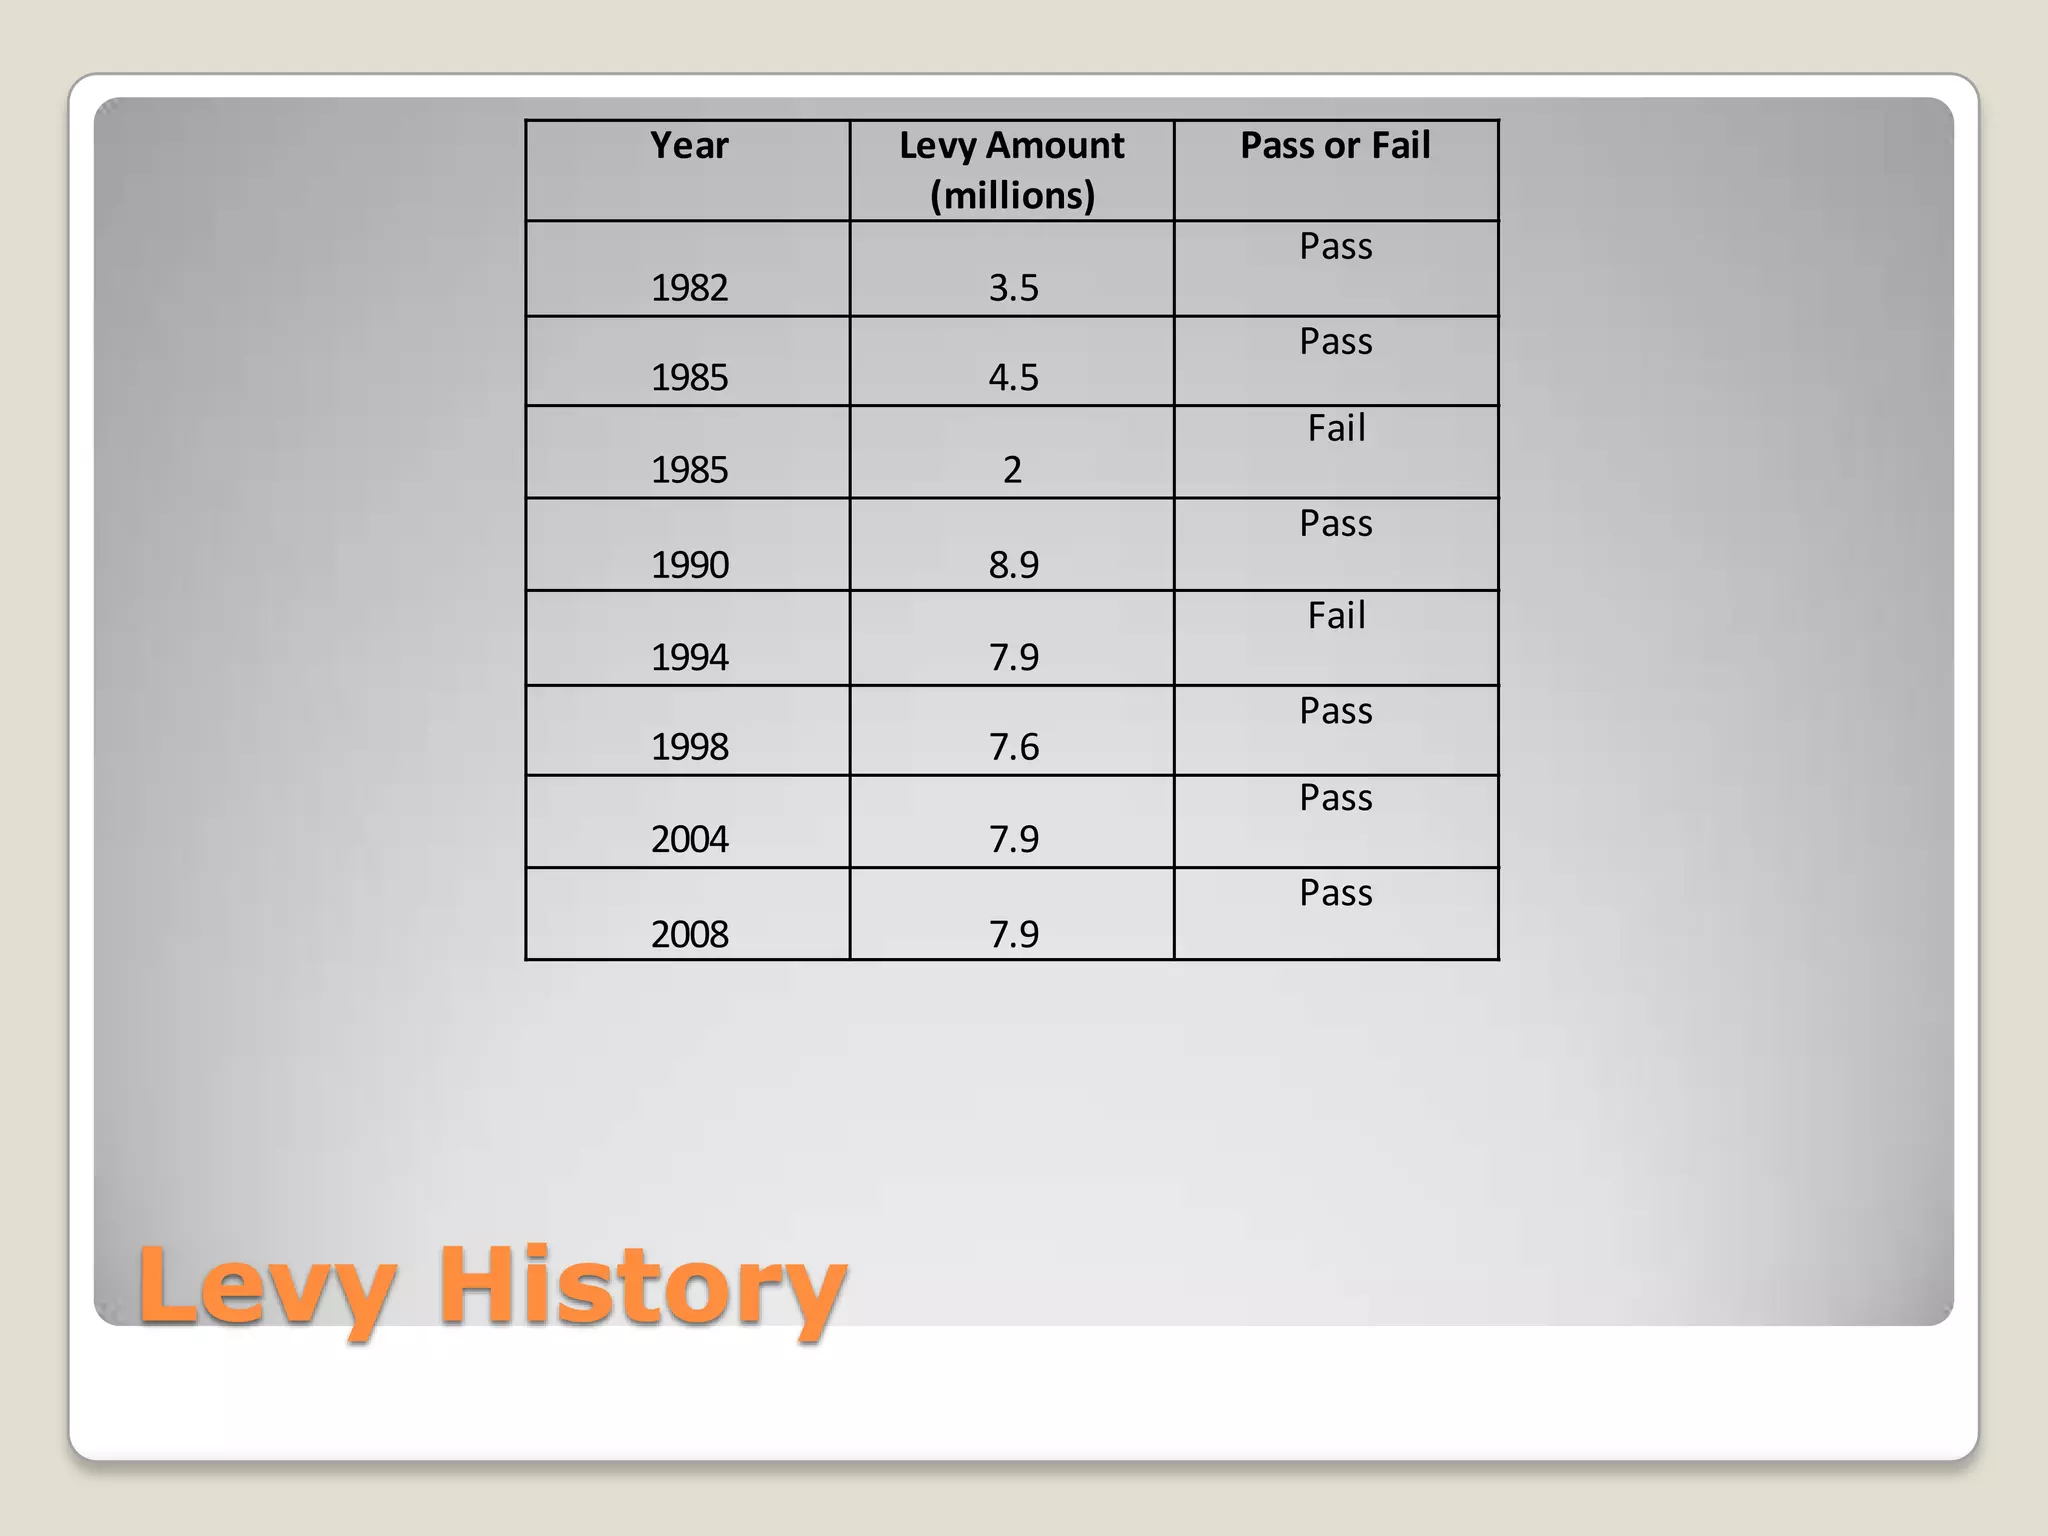
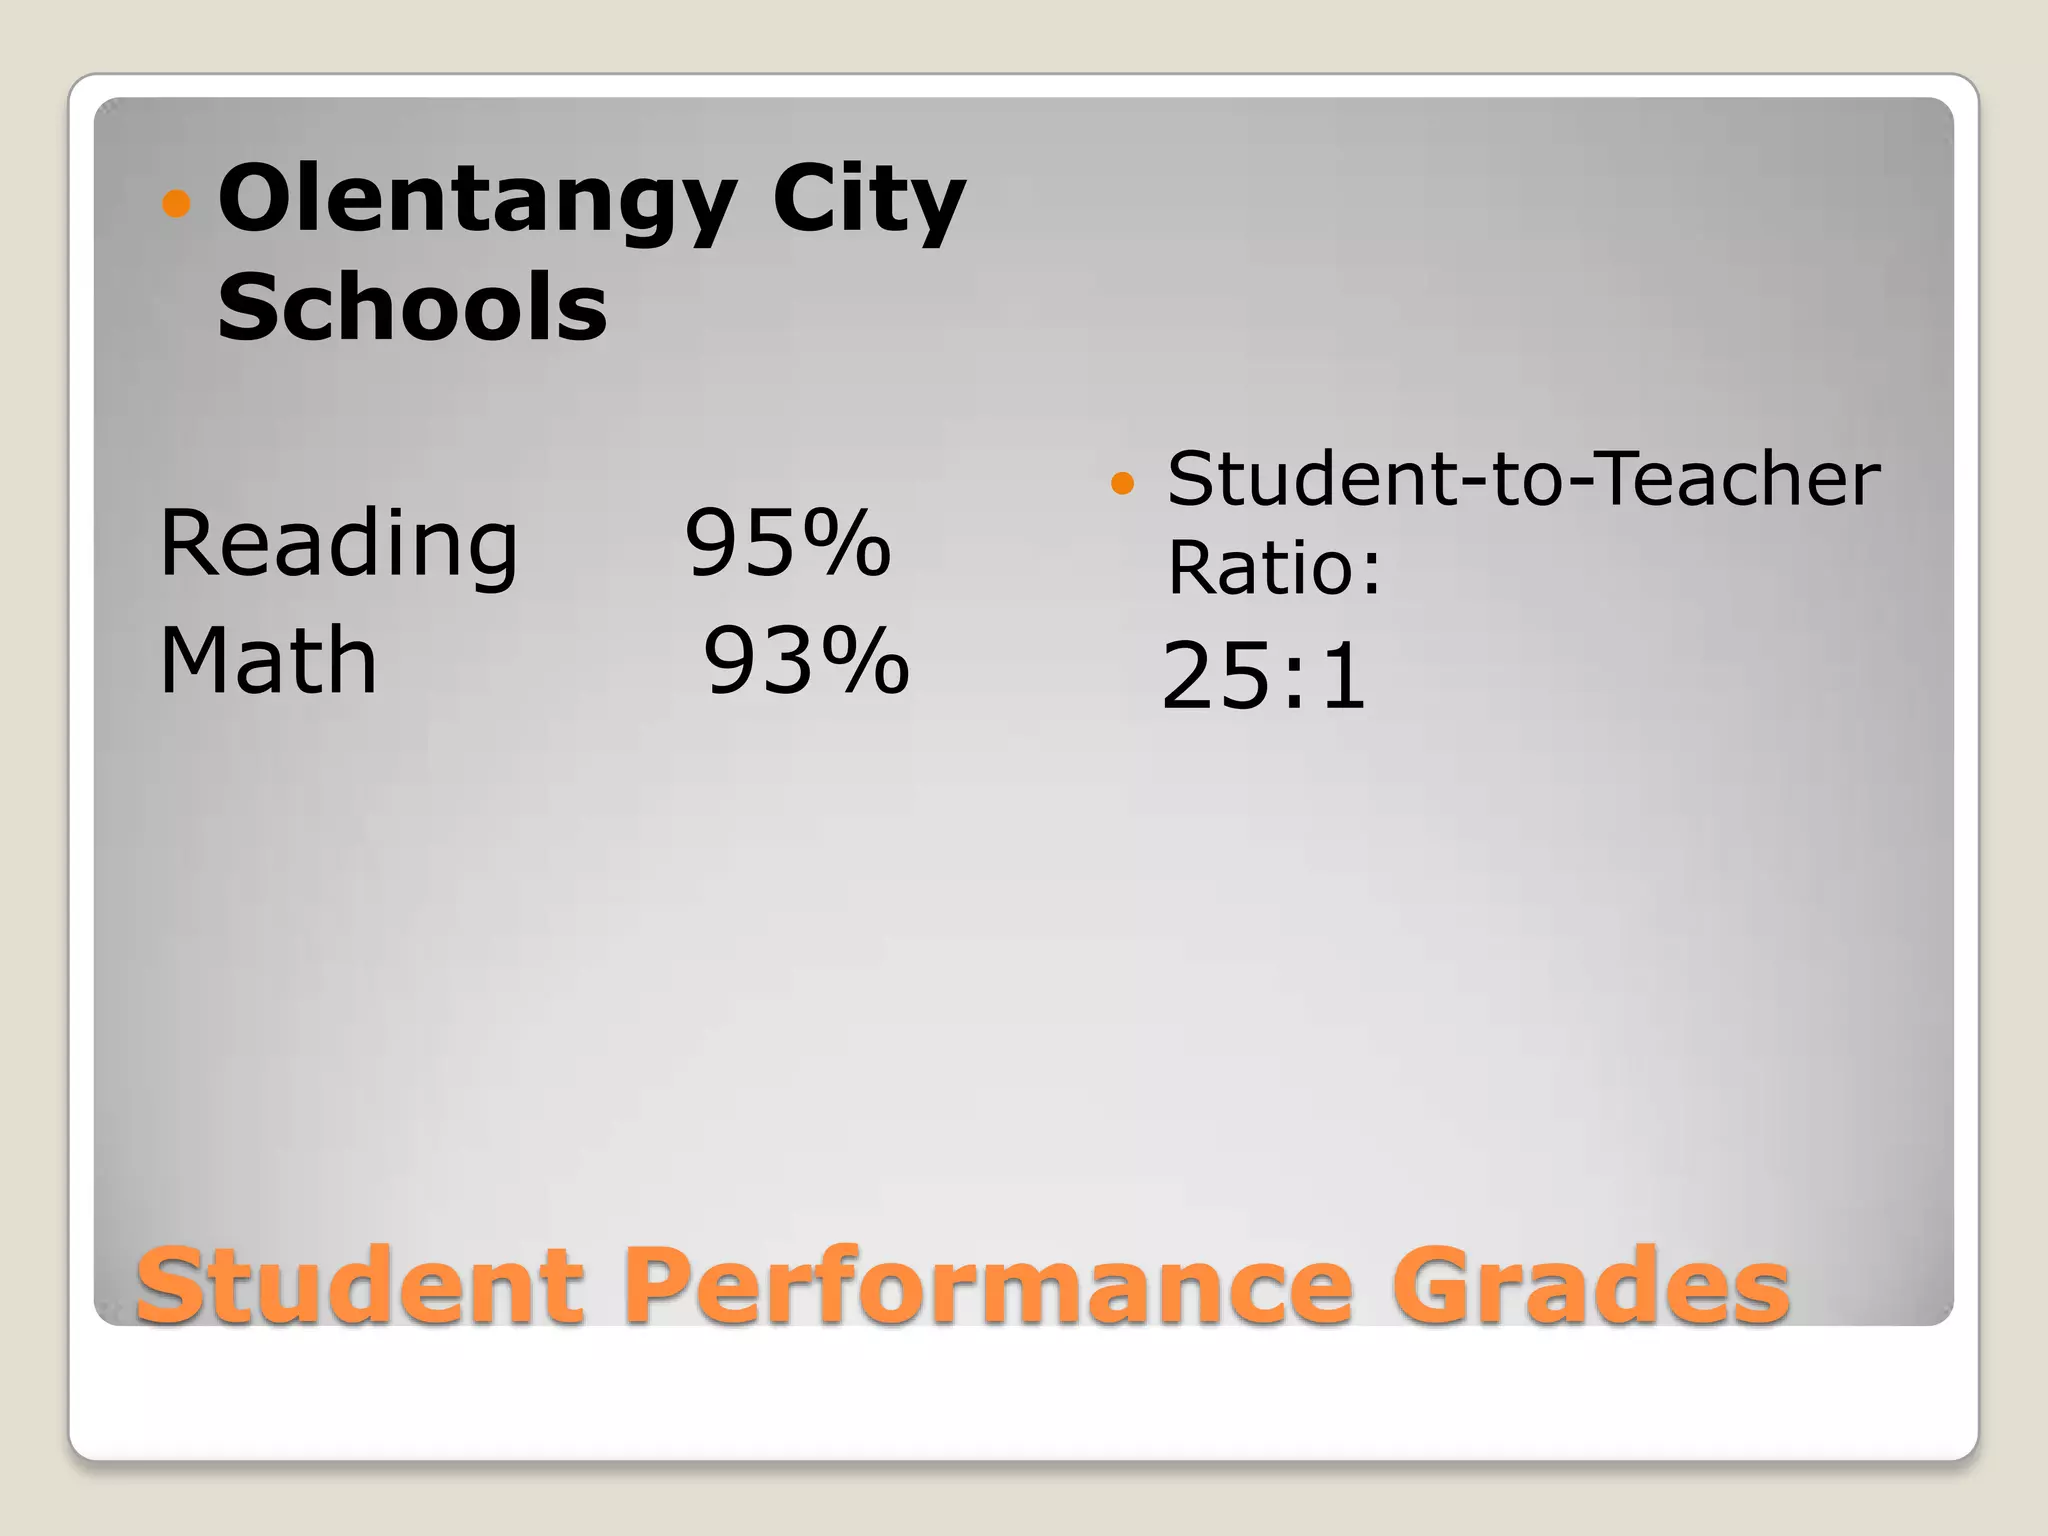
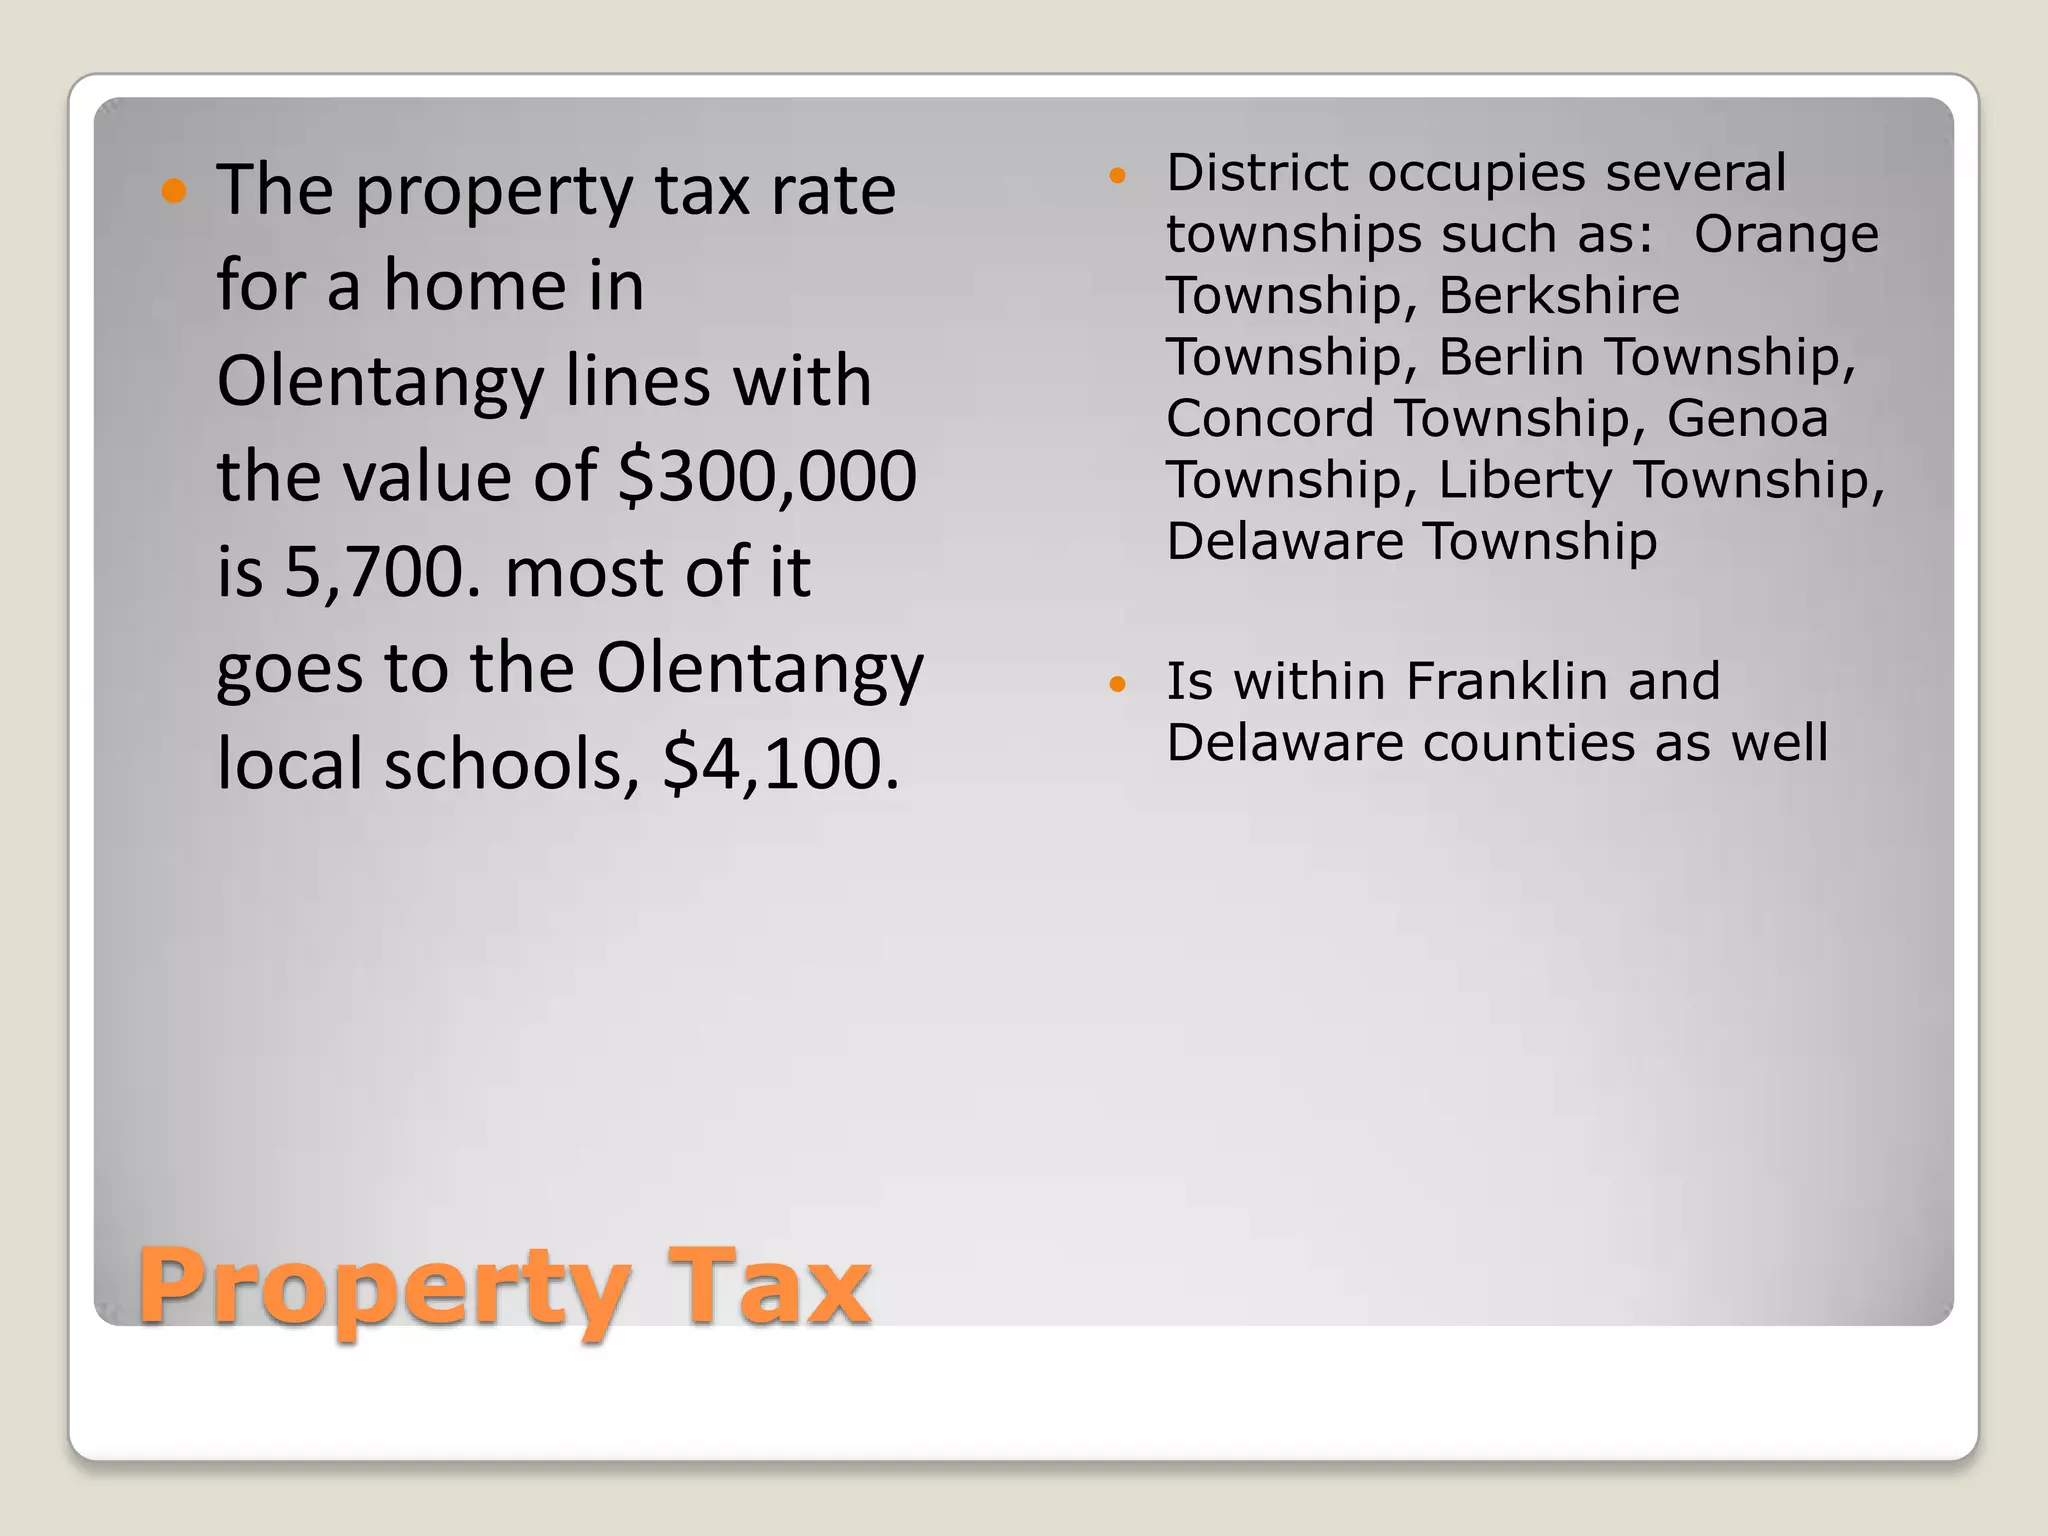
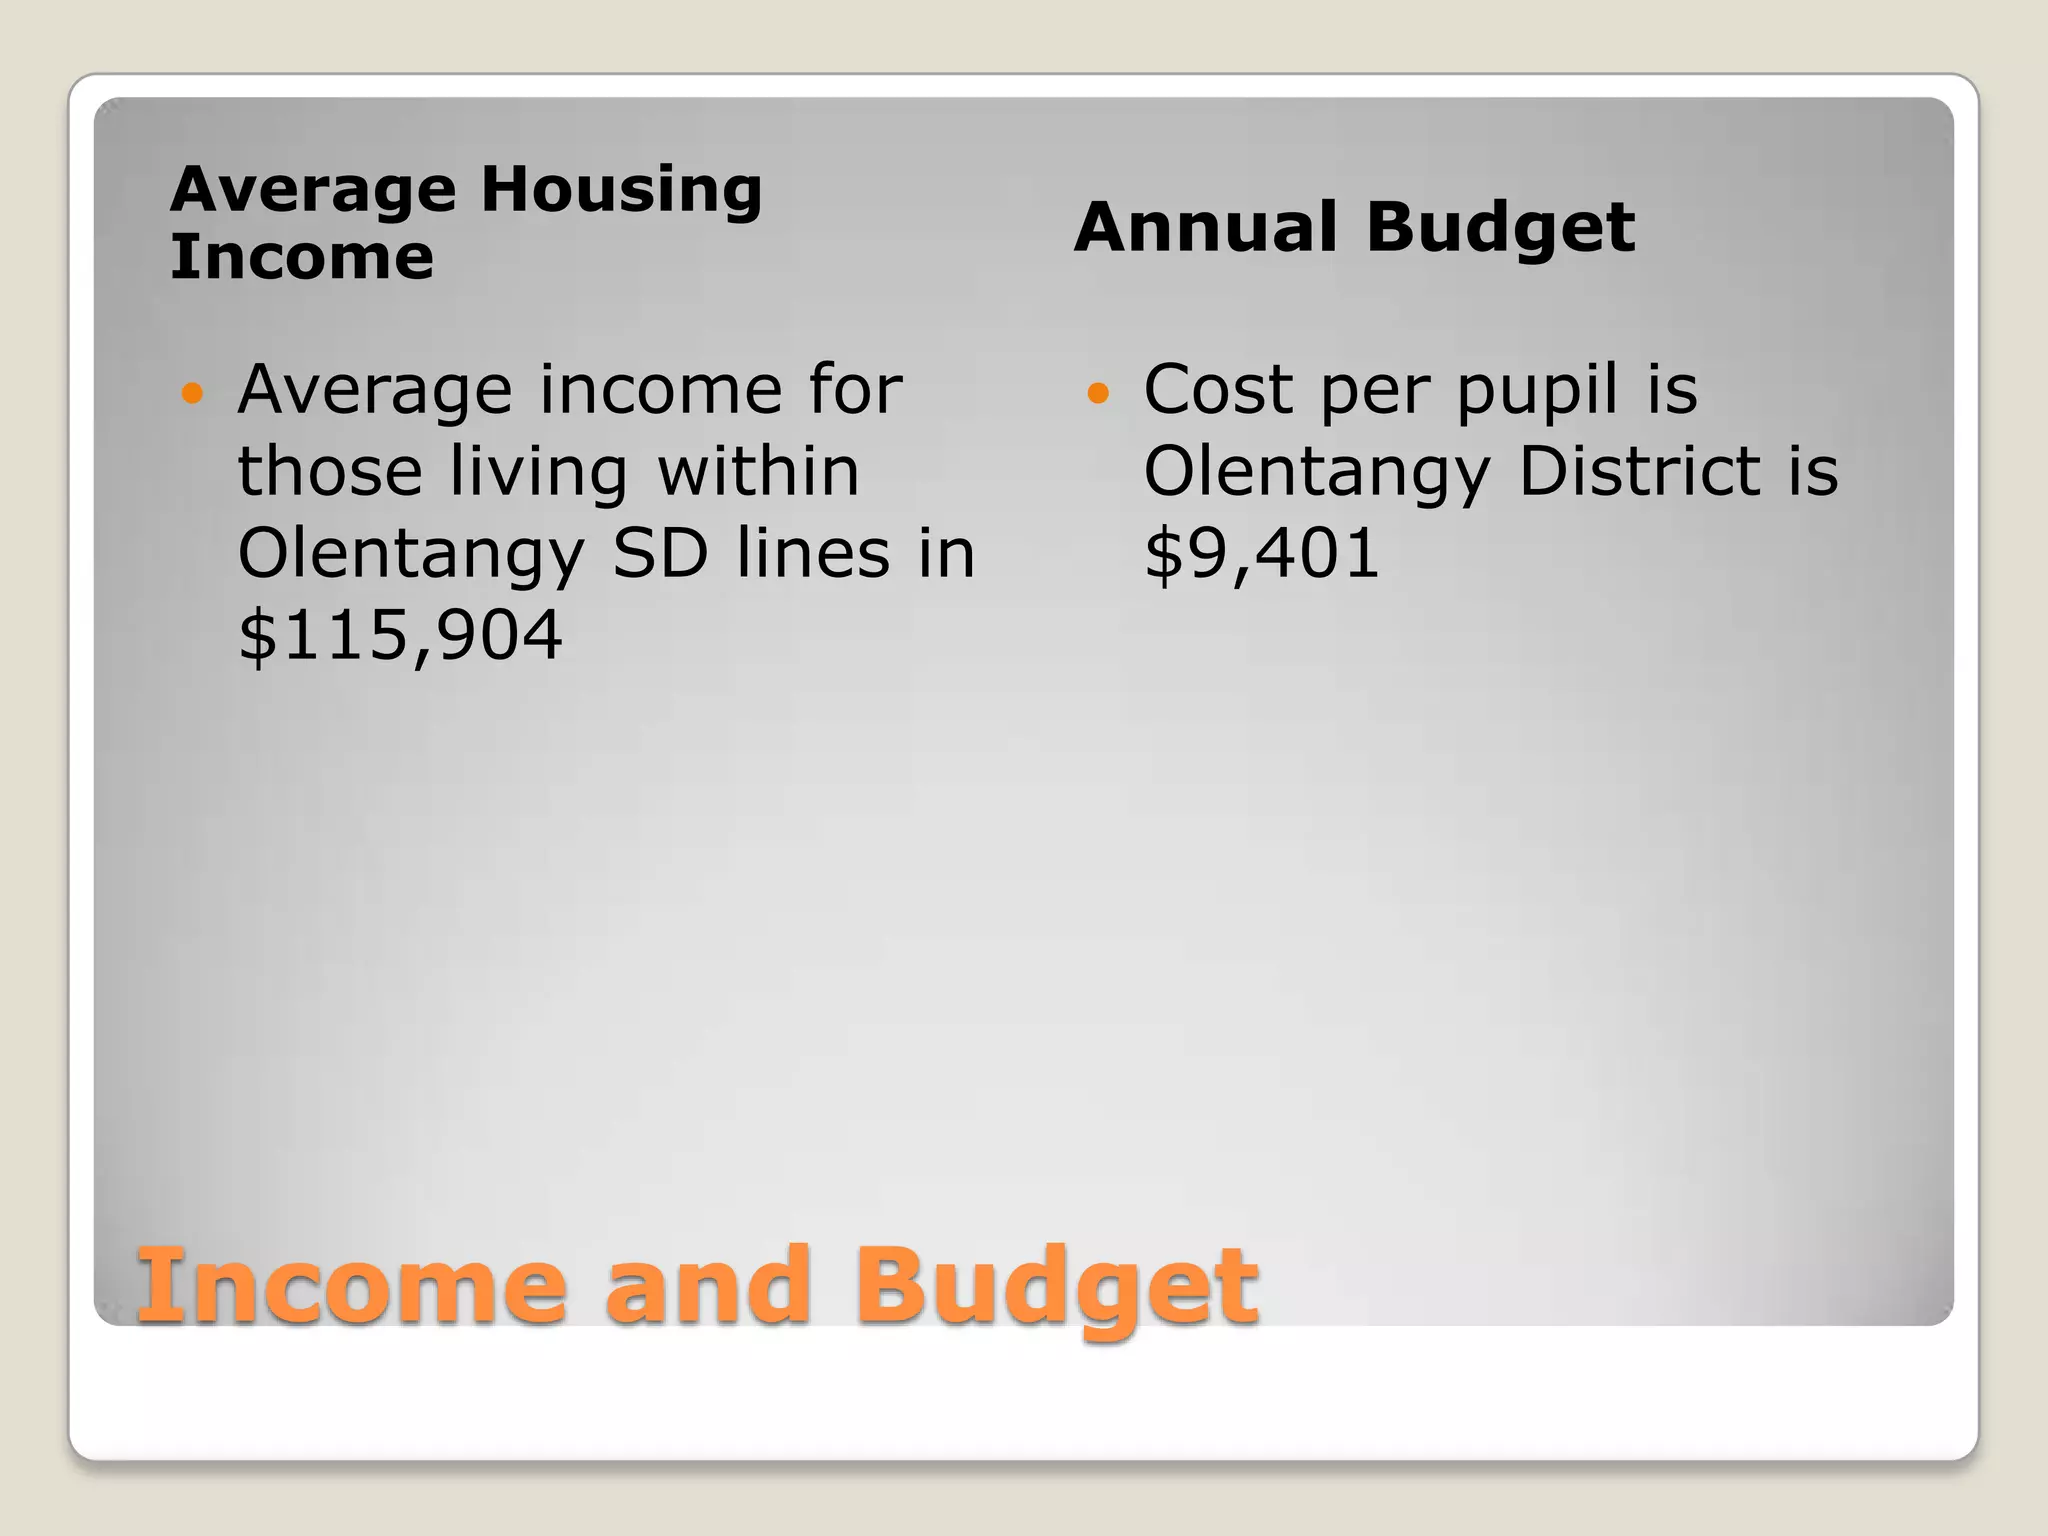
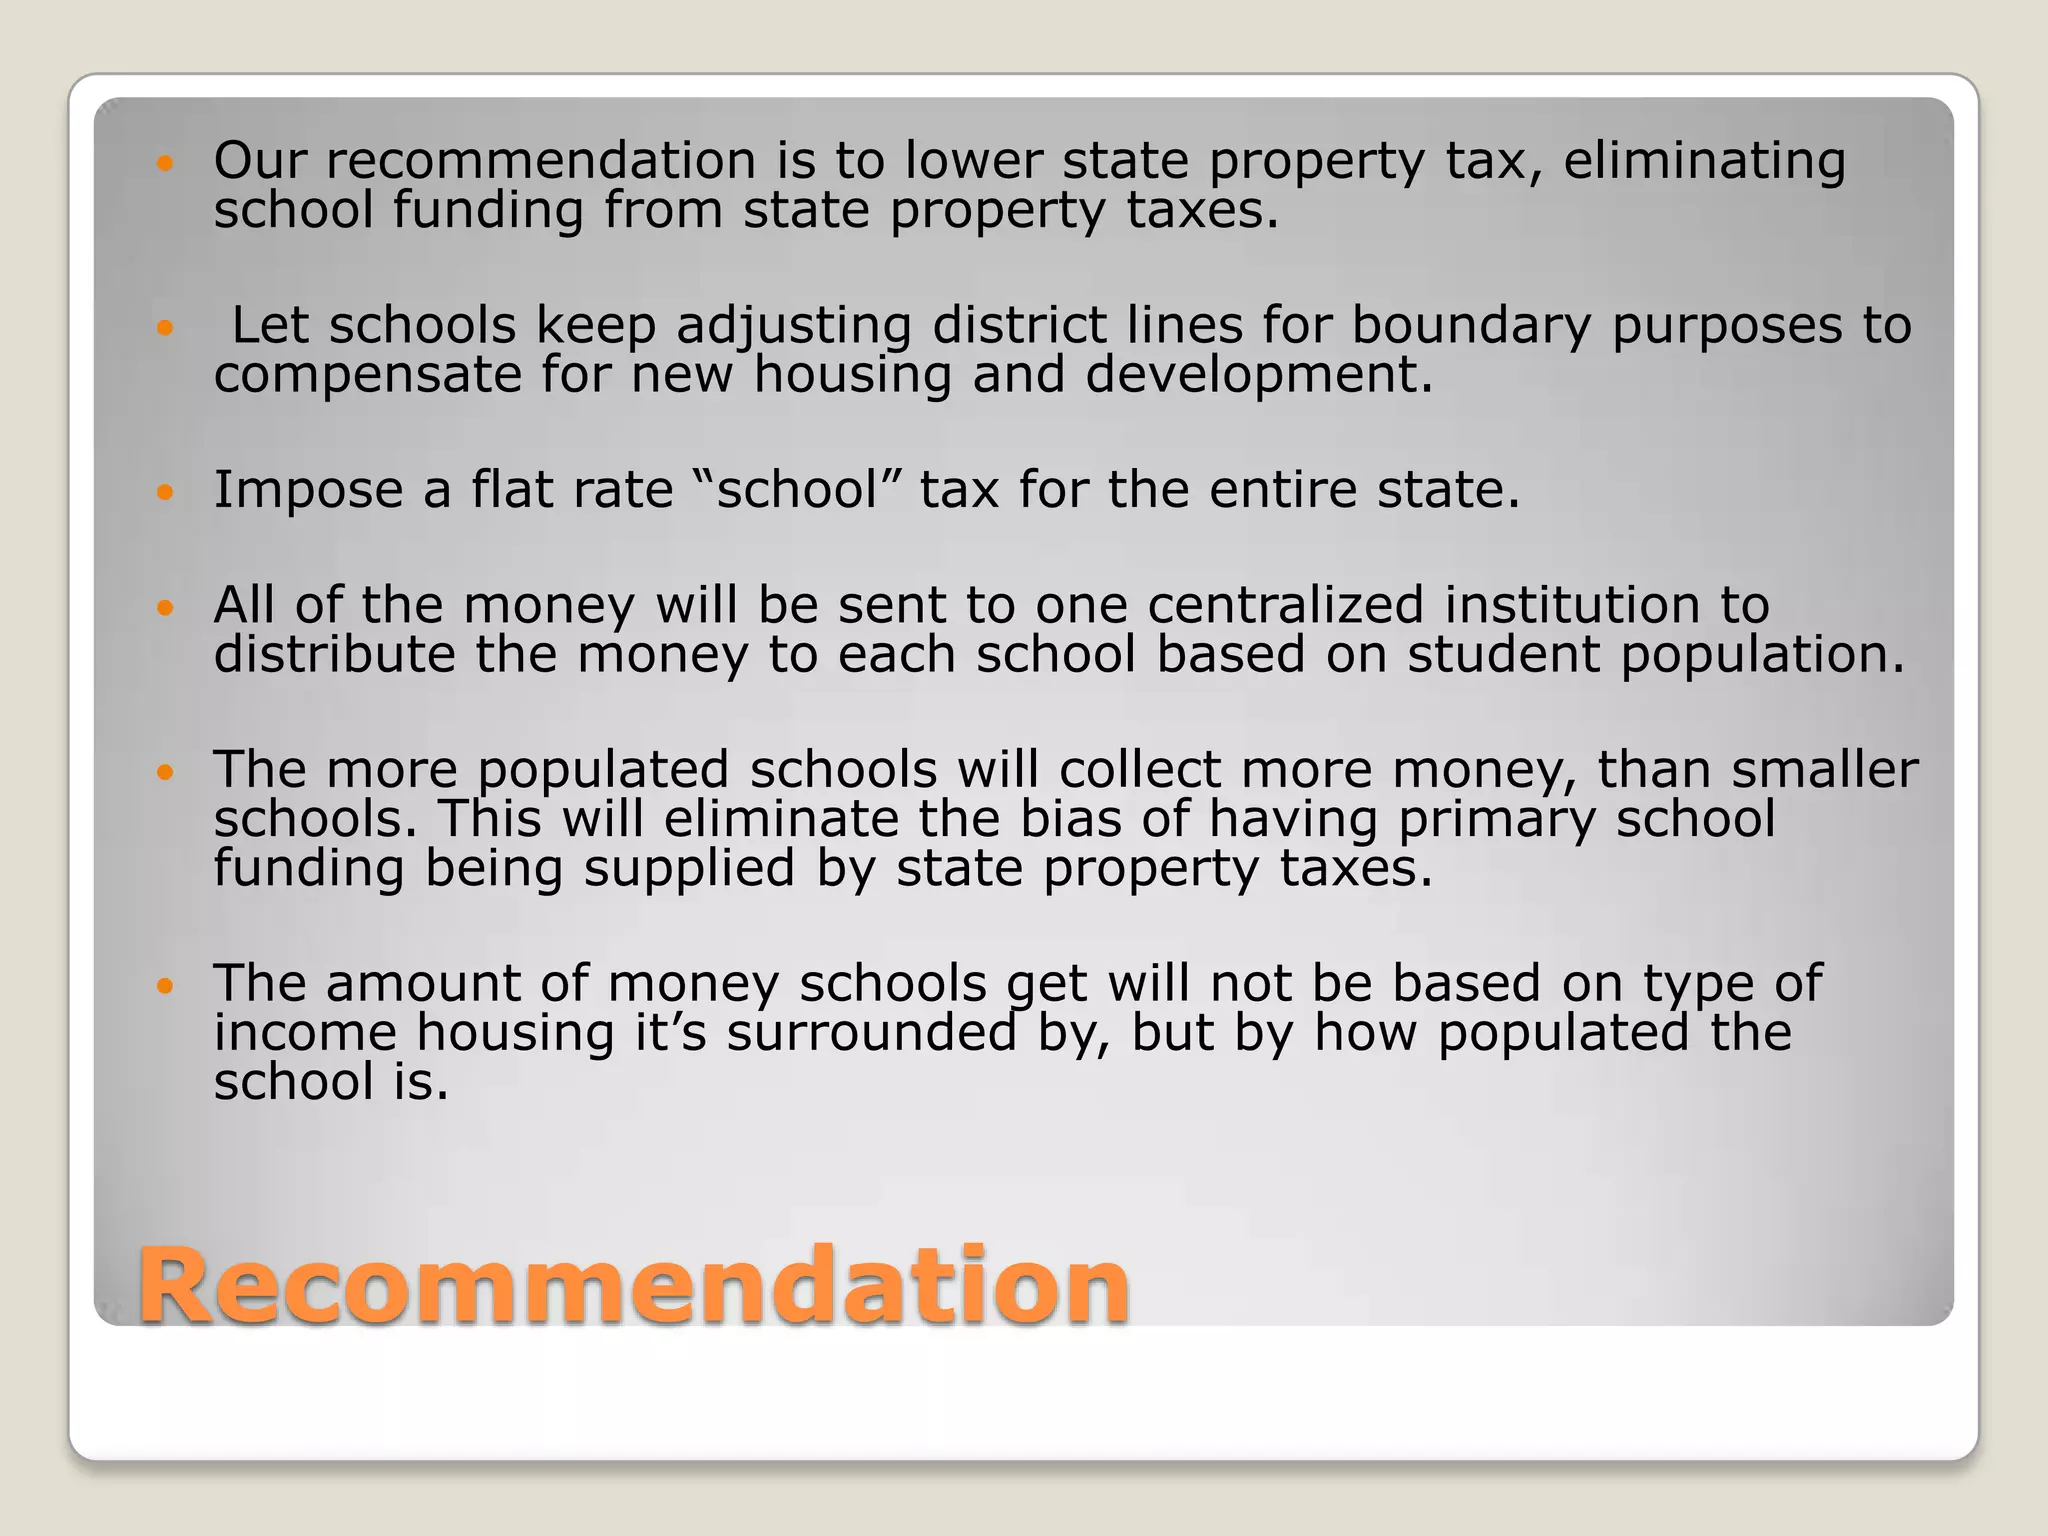
Impact of:
School District Funding
 through Property Tax
                     Michelle Grass
                    Scarlett Watson
                       Milton Davis
                        Jean Poirier
                Mohamed Abdulahiid
           Should Ohio State Schools be funded by State property taxes? School funding by

    State property taxes is unfair and biased. If the school district has high income housing,

    levies will generally be passed and that school district will get more money than your

    average to low income housing districts. In the average to low income housing districts,

    voters will generally not pass levies, and these schools will be forced to operate over

    budget and force them to make cuts. This costs students the best learning environment

    possible and also costs people jobs. If low income housing is built into a high income

    housing school district, residents can vote to change the school district lines. This prolongs

    the never ending cycle of rich districts get quality schools while poor districts get subpar

    schools.


Concept
   Examined four school districts:

             Columbus City Schools
              Whitehall City Schools
                Dublin City School
             Olentangy City Schools


School Districts
   Columbus City Schools


        60% of property taxes goes toward schools


   The School district includes parts of the
    Mifflin, Franklin, Clifton and Marion townships


Current District Property Taxes
Average Housing
Income                       Annual School Budget

   Average income of           Annual budgets for all
    those living with in         schools within district
    Columbus City lines is       is $722,872,622
    $39,756


Income and Budgets
 Columbus
  City Schools
Reading
 87.1%
Mathematics
                 79.6%      Student-to-Teacher
Writing
                 89.1%
                             Ratio is:
Science

Social Studies
                 68.6%       17:3
                 80.1%

*70% Graduation Rate


Student Performance Grades
 Whitehall
 City Schools
                           Student-to-Teacher
   Math       93%
   Reading    90%
                            Ratio is:
   Science        77%       17:1
   Social Studies 85%
   Writing     95%


Student Performance Grades
Average Housing
Income                         Annual School Budget

   Average income of             Whitehall SD spends
    those living within            $10,157 per pupil.
    the the Whitehall
    School district lines is      Spends 63% on
    $24,232                        instruction; 33% on
                                   support services; 4%
                                   on elementary and
   Within Truro                   secondary
    Township                       expenditures


Income and Budgets
 Dublin
       City                                             Within Washington,
                                                         Perry and Sharon
 Schools
                                                         townships
  Franklin County - City of Dublin      Full Rate       Residential Commercial


  District 273 - Washington               119.40           77.40      85.65
  Township - Dublin City Schools

  Delaware County - City Schools

  District 10 - Dublin City Schools       106.80           67.55      74.74

  Union County - City of Dublin

  District 39 - Washington Township       109.88           69.27      76.42
  - Dublin City Schools

  District 40 - Dublin Corp. - Dublin      95.90           61.80      67.81
  City Schools


Current District Property Taxes
Average Housing
Income                       Annual School Budget

   Average income for        Total district budget
    families living within     is: $168,938,000
    Dublin SD lines is        Per Pupil:
    $83,429                         $5,590


Income and Budgets
Average Proficiency     Average Proficiency Tests
             Tests Scores for             Scores for
          Students Enrolled Less    Students Enrolled More
              than 3 Years               than 3 Years


 Math             84.2%                     92.3%


Readin            87.5%                     93.7%
                                                              Student-to-Teacher
  g
                                                               Ratio:
                                                               17:1
Science           78%                       89.4%


 Social           77.6%                     86.9%
Studies


Writing           91.2%                      96%


  Student Performance Grades
Year   Levy Amount    Pass or Fail
                 (millions)
                                 Pass
        1982       3.5
                                 Pass
        1985       4.5
                                  Fail
        1985        2
                                 Pass
        1990       8.9
                                  Fail
        1994       7.9
                                 Pass
        1998       7.6
                                 Pass
        2004       7.9
                                 Pass
        2008       7.9


Levy History
 Olentangy   City
 Schools
                        Student-to-Teacher
Reading    95%           Ratio:
Math       93%           25:1


Student Performance Grades
   The property tax rate       District occupies several
                                 townships such as: Orange
    for a home in                Township, Berkshire
                                 Township, Berlin Township,
    Olentangy lines with         Concord Township, Genoa
    the value of $300,000        Township, Liberty Township,
                                 Delaware Township
    is 5,700. most of it
    goes to the Olentangy       Is within Franklin and
                                 Delaware counties as well
    local schools, $4,100.


Property Tax
Average Housing
Income                      Annual Budget

   Average income for         Cost per pupil is
    those living within         Olentangy District is
    Olentangy SD lines in       $9,401
    $115,904


Income and Budget
   Our recommendation is to lower state property tax, eliminating
    school funding from state property taxes.

    Let schools keep adjusting district lines for boundary purposes to
    compensate for new housing and development.

   Impose a flat rate “school” tax for the entire state.

   All of the money will be sent to one centralized institution to
    distribute the money to each school based on student population.

   The more populated schools will collect more money, than smaller
    schools. This will eliminate the bias of having primary school
    funding being supplied by state property taxes.

   The amount of money schools get will not be based on type of
    income housing it’s surrounded by, but by how populated the
    school is.


Recommendation

Comm 101 final

  • 1.
    Impact of: School DistrictFunding through Property Tax Michelle Grass Scarlett Watson Milton Davis Jean Poirier Mohamed Abdulahiid
  • 2.
    Should Ohio State Schools be funded by State property taxes? School funding by State property taxes is unfair and biased. If the school district has high income housing, levies will generally be passed and that school district will get more money than your average to low income housing districts. In the average to low income housing districts, voters will generally not pass levies, and these schools will be forced to operate over budget and force them to make cuts. This costs students the best learning environment possible and also costs people jobs. If low income housing is built into a high income housing school district, residents can vote to change the school district lines. This prolongs the never ending cycle of rich districts get quality schools while poor districts get subpar schools. Concept
  • 3.
    Examined four school districts:  Columbus City Schools  Whitehall City Schools  Dublin City School  Olentangy City Schools School Districts
  • 4.
    Columbus City Schools 60% of property taxes goes toward schools  The School district includes parts of the Mifflin, Franklin, Clifton and Marion townships Current District Property Taxes
  • 5.
    Average Housing Income Annual School Budget  Average income of  Annual budgets for all those living with in schools within district Columbus City lines is is $722,872,622 $39,756 Income and Budgets
  • 6.
     Columbus City Schools Reading 87.1% Mathematics 79.6%  Student-to-Teacher Writing 89.1% Ratio is: Science Social Studies 68.6% 17:3 80.1% *70% Graduation Rate Student Performance Grades
  • 7.
     Whitehall CitySchools  Student-to-Teacher Math 93% Reading 90% Ratio is: Science 77% 17:1 Social Studies 85% Writing 95% Student Performance Grades
  • 8.
    Average Housing Income Annual School Budget  Average income of  Whitehall SD spends those living within $10,157 per pupil. the the Whitehall School district lines is  Spends 63% on $24,232 instruction; 33% on support services; 4% on elementary and  Within Truro secondary Township expenditures Income and Budgets
  • 9.
     Dublin City  Within Washington, Perry and Sharon Schools townships Franklin County - City of Dublin Full Rate Residential Commercial District 273 - Washington 119.40 77.40 85.65 Township - Dublin City Schools Delaware County - City Schools District 10 - Dublin City Schools 106.80 67.55 74.74 Union County - City of Dublin District 39 - Washington Township 109.88 69.27 76.42 - Dublin City Schools District 40 - Dublin Corp. - Dublin 95.90 61.80 67.81 City Schools Current District Property Taxes
  • 10.
    Average Housing Income Annual School Budget  Average income for  Total district budget families living within is: $168,938,000 Dublin SD lines is  Per Pupil: $83,429 $5,590 Income and Budgets
  • 11.
    Average Proficiency Average Proficiency Tests Tests Scores for Scores for Students Enrolled Less Students Enrolled More than 3 Years than 3 Years Math 84.2% 92.3% Readin 87.5% 93.7%  Student-to-Teacher g Ratio: 17:1 Science 78% 89.4% Social 77.6% 86.9% Studies Writing 91.2% 96% Student Performance Grades
  • 12.
    Year Levy Amount Pass or Fail (millions) Pass 1982 3.5 Pass 1985 4.5 Fail 1985 2 Pass 1990 8.9 Fail 1994 7.9 Pass 1998 7.6 Pass 2004 7.9 Pass 2008 7.9 Levy History
  • 13.
     Olentangy City Schools  Student-to-Teacher Reading 95% Ratio: Math 93% 25:1 Student Performance Grades
  • 14.
    The property tax rate  District occupies several townships such as: Orange for a home in Township, Berkshire Township, Berlin Township, Olentangy lines with Concord Township, Genoa the value of $300,000 Township, Liberty Township, Delaware Township is 5,700. most of it goes to the Olentangy  Is within Franklin and Delaware counties as well local schools, $4,100. Property Tax
  • 15.
    Average Housing Income Annual Budget  Average income for  Cost per pupil is those living within Olentangy District is Olentangy SD lines in $9,401 $115,904 Income and Budget
  • 16.
    Our recommendation is to lower state property tax, eliminating school funding from state property taxes.  Let schools keep adjusting district lines for boundary purposes to compensate for new housing and development.  Impose a flat rate “school” tax for the entire state.  All of the money will be sent to one centralized institution to distribute the money to each school based on student population.  The more populated schools will collect more money, than smaller schools. This will eliminate the bias of having primary school funding being supplied by state property taxes.  The amount of money schools get will not be based on type of income housing it’s surrounded by, but by how populated the school is. Recommendation