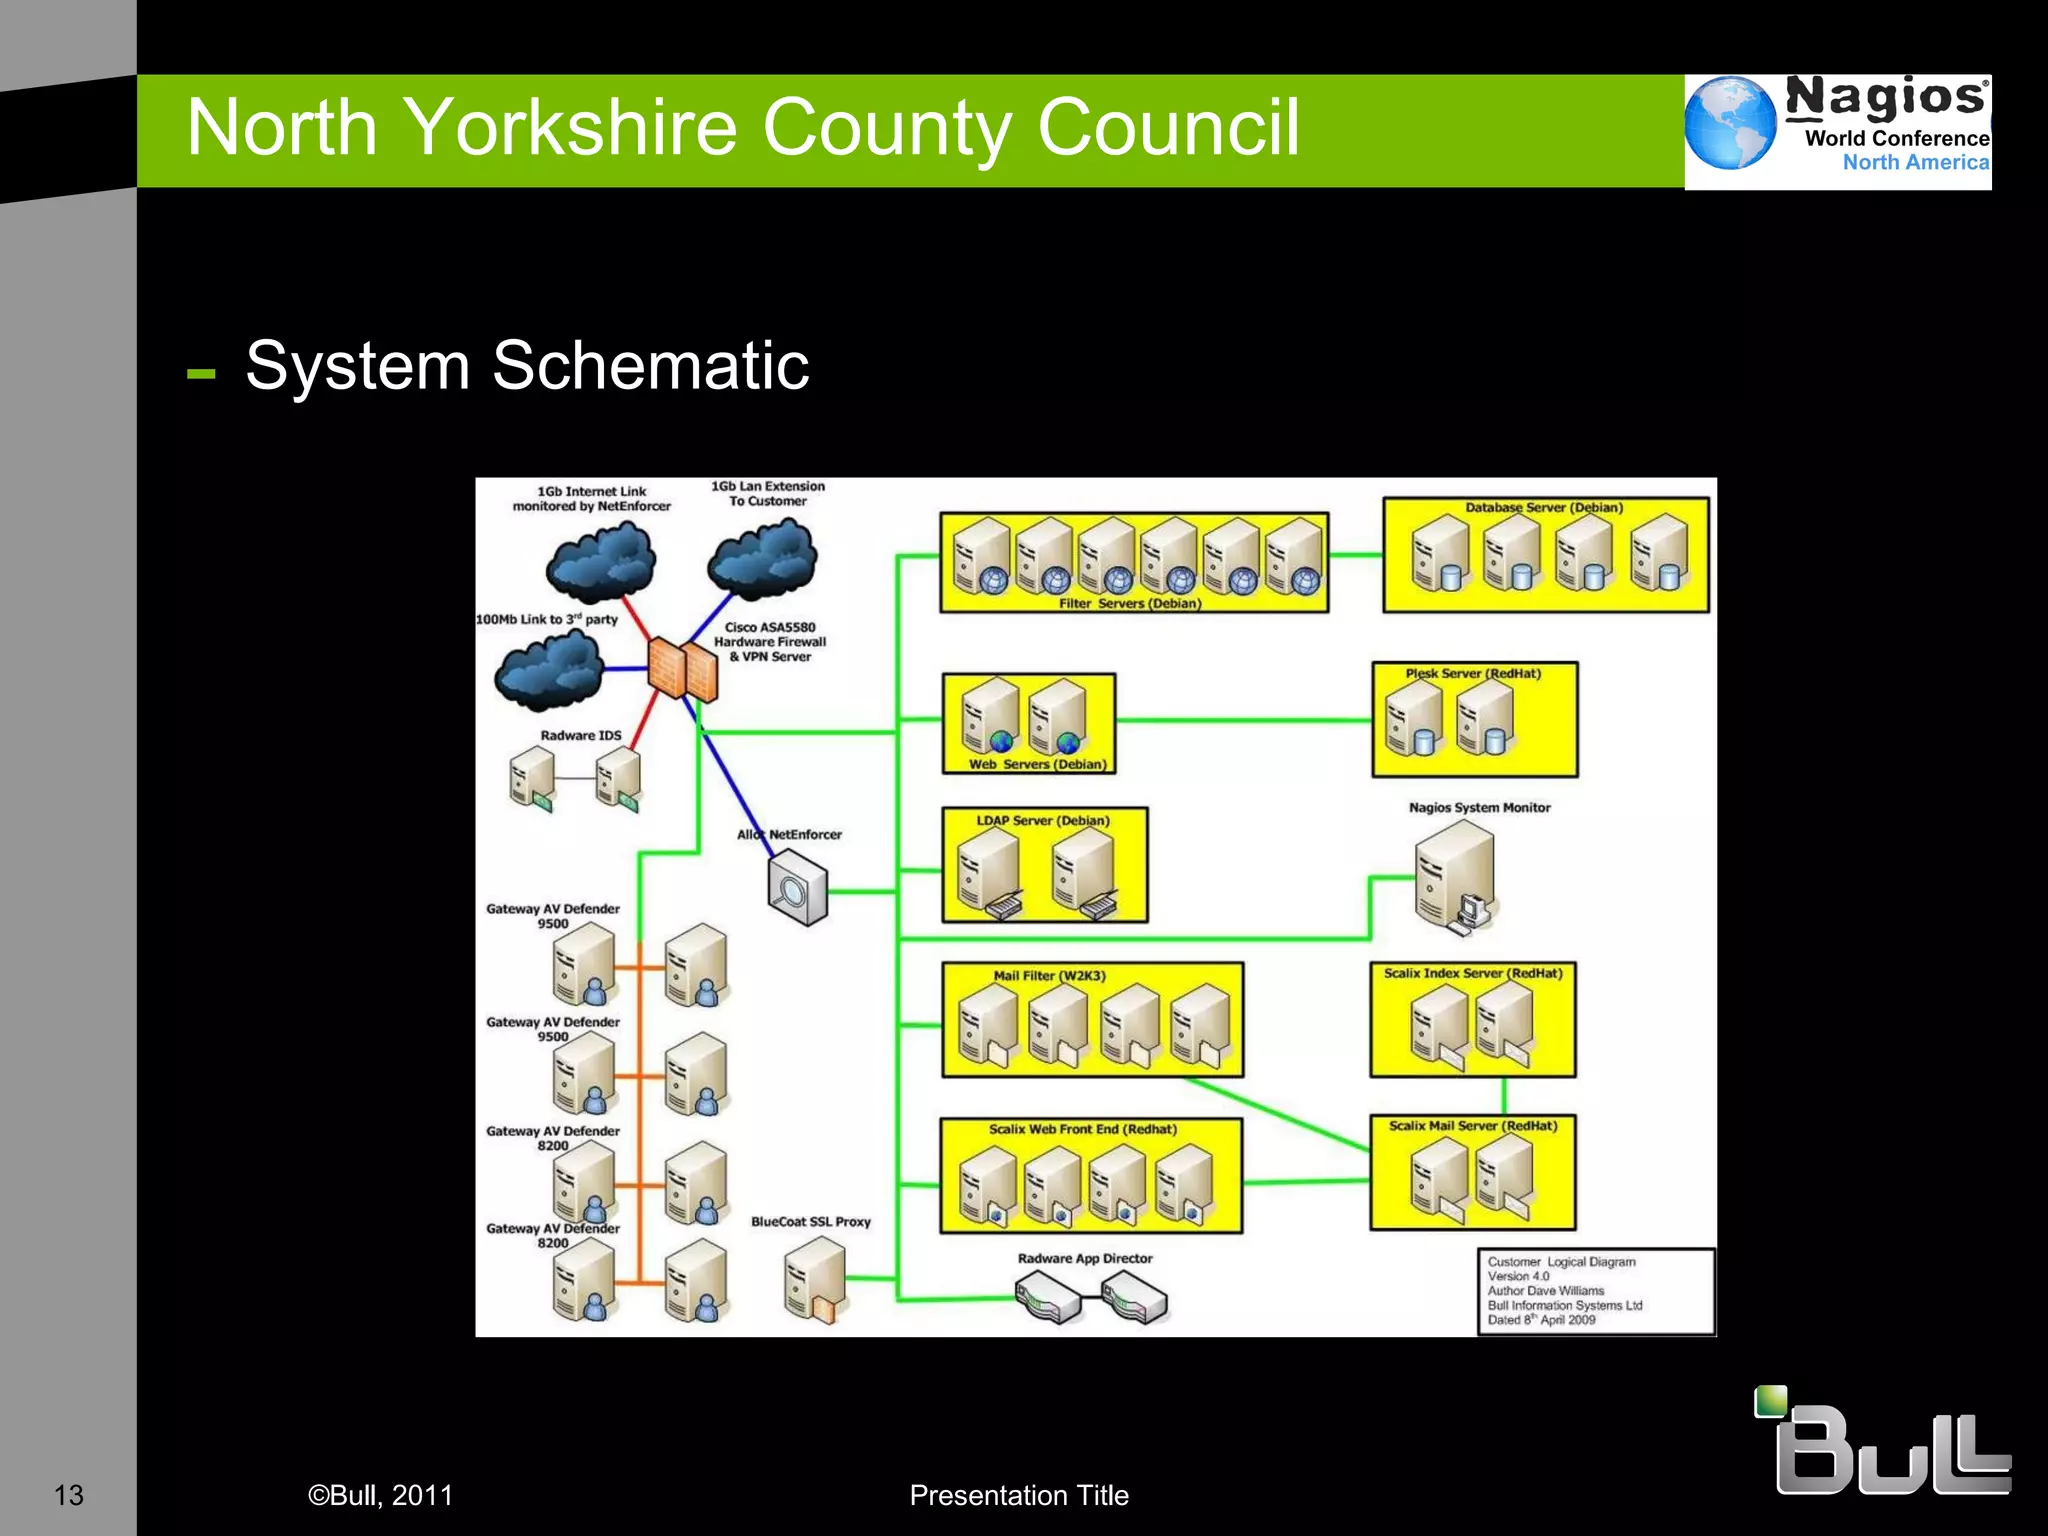
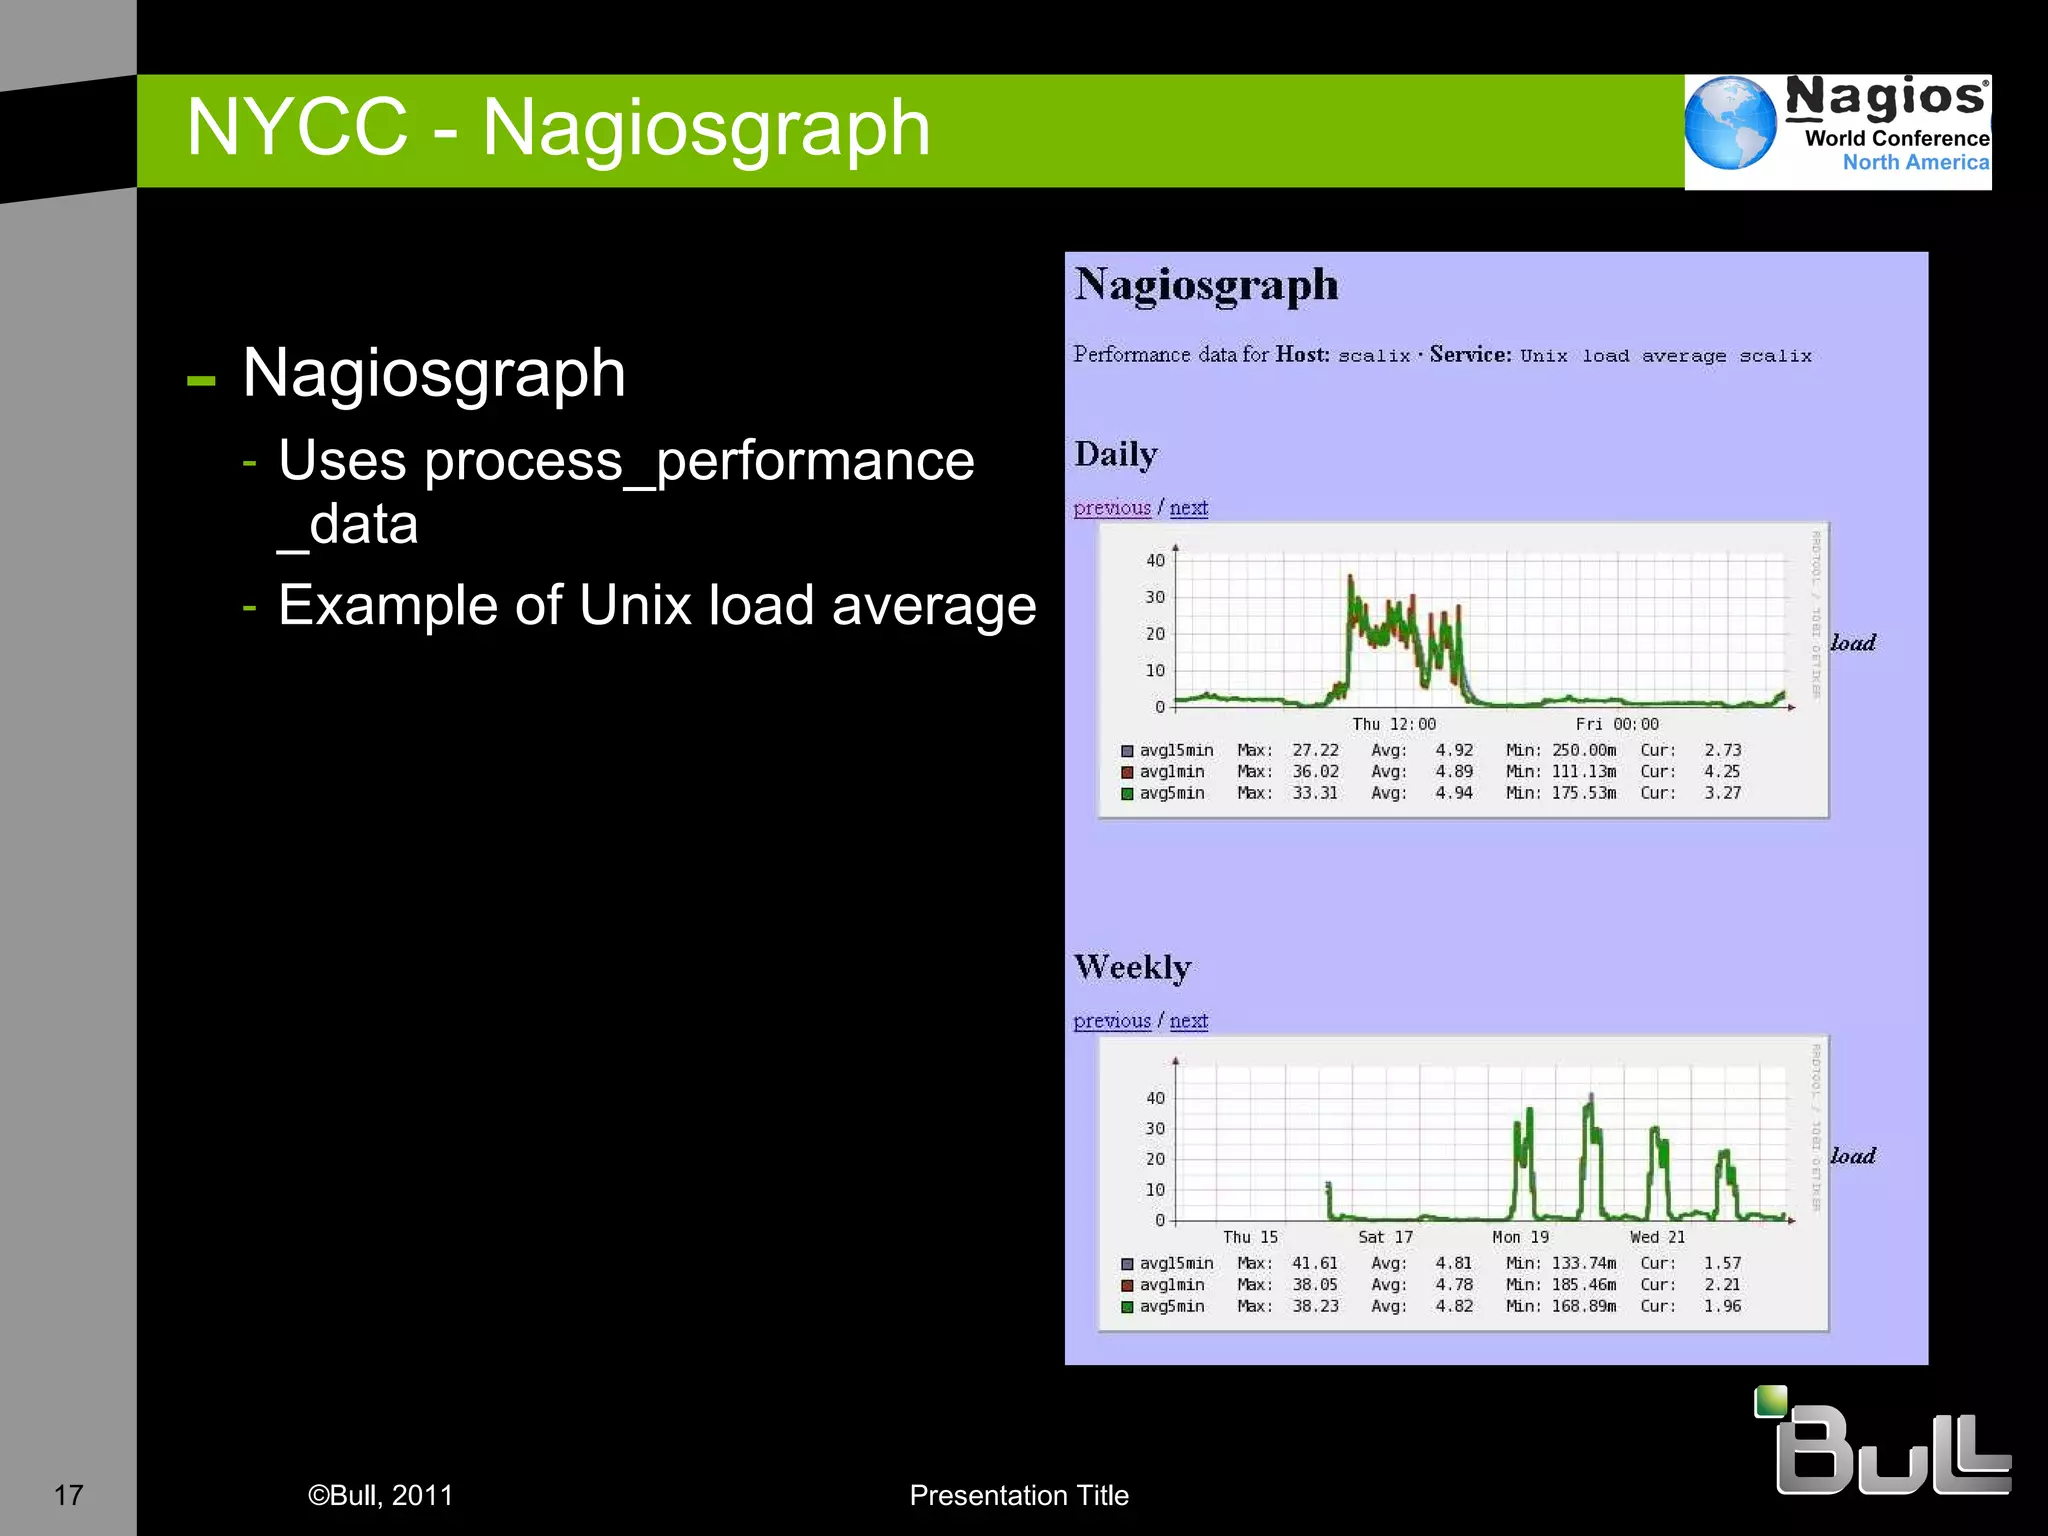
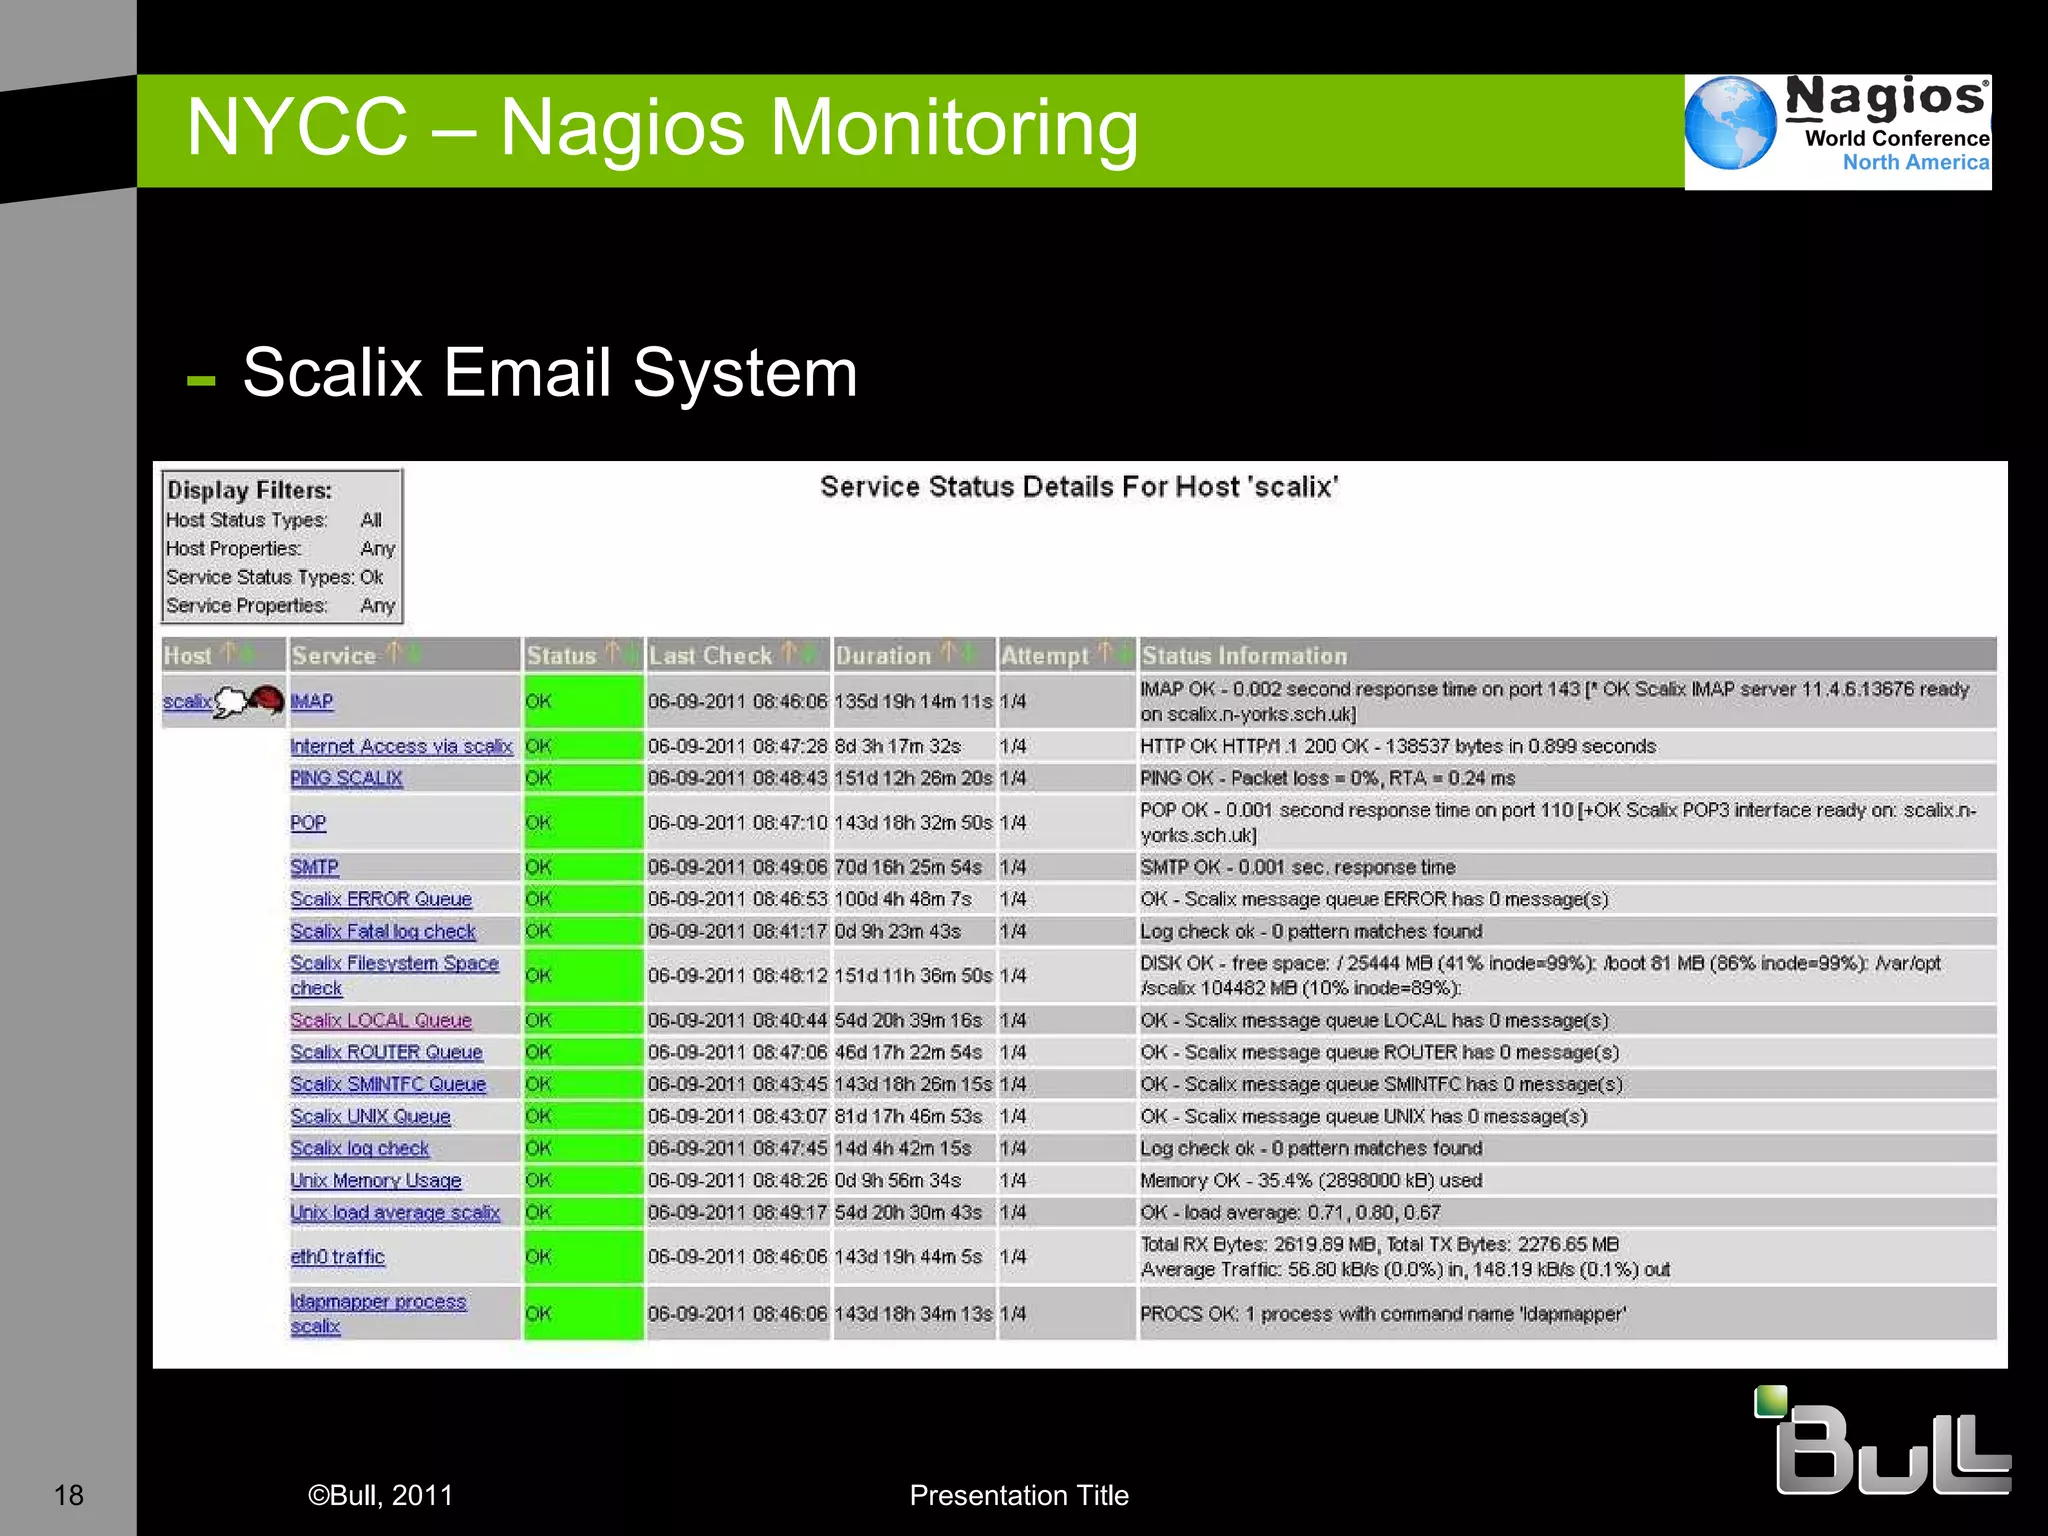
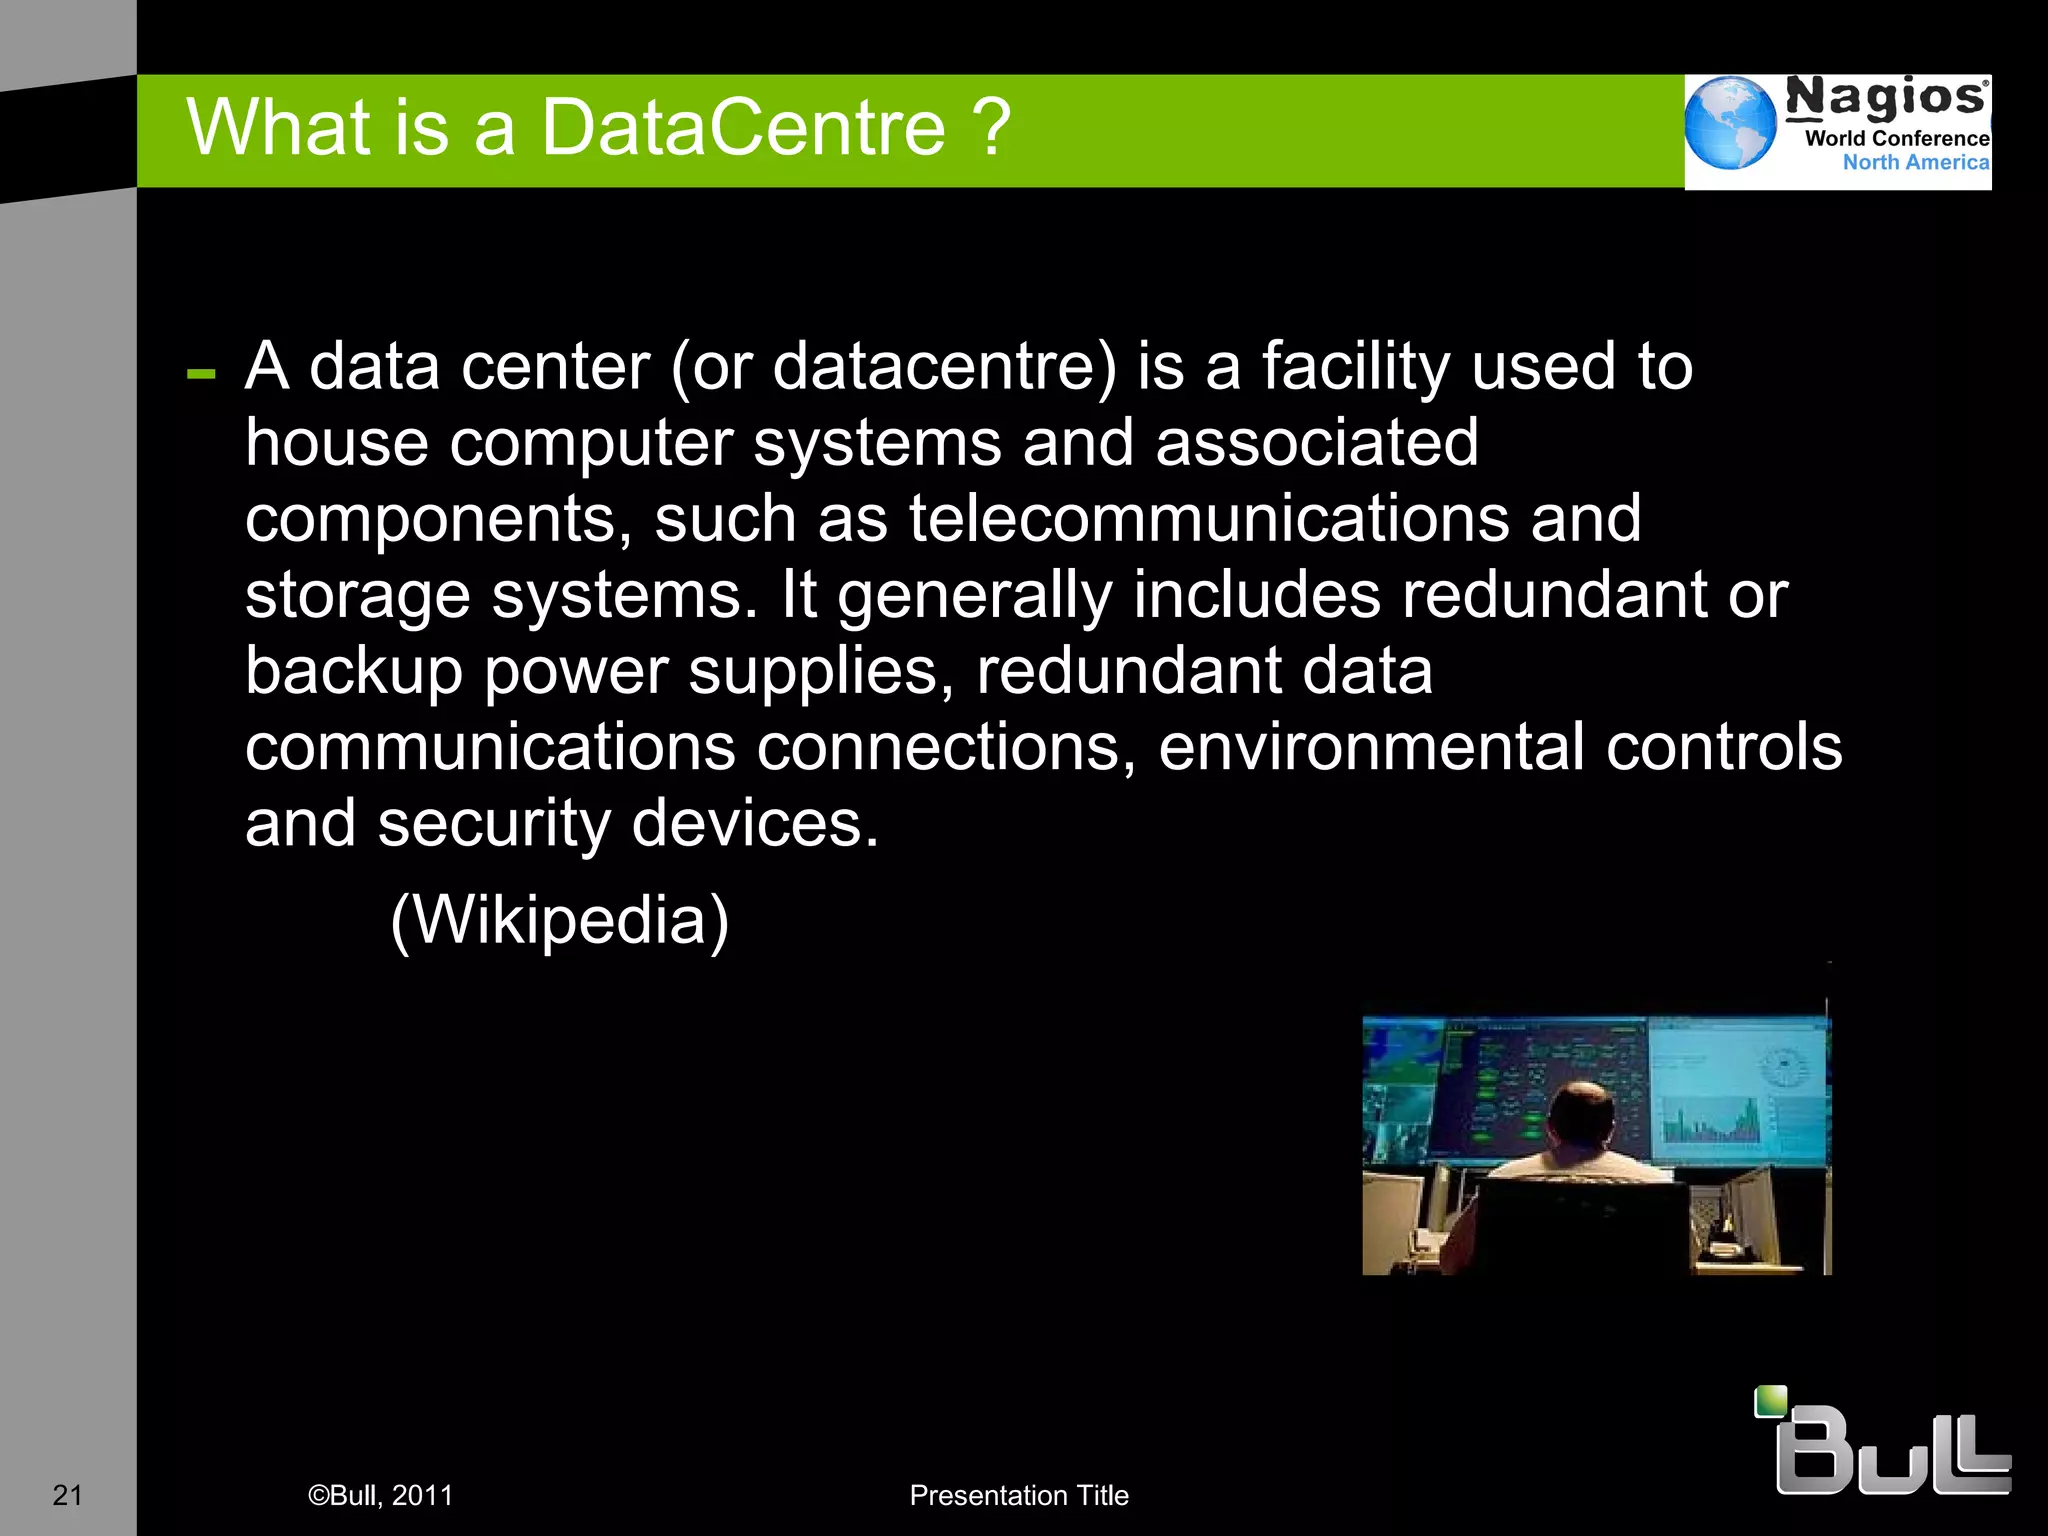
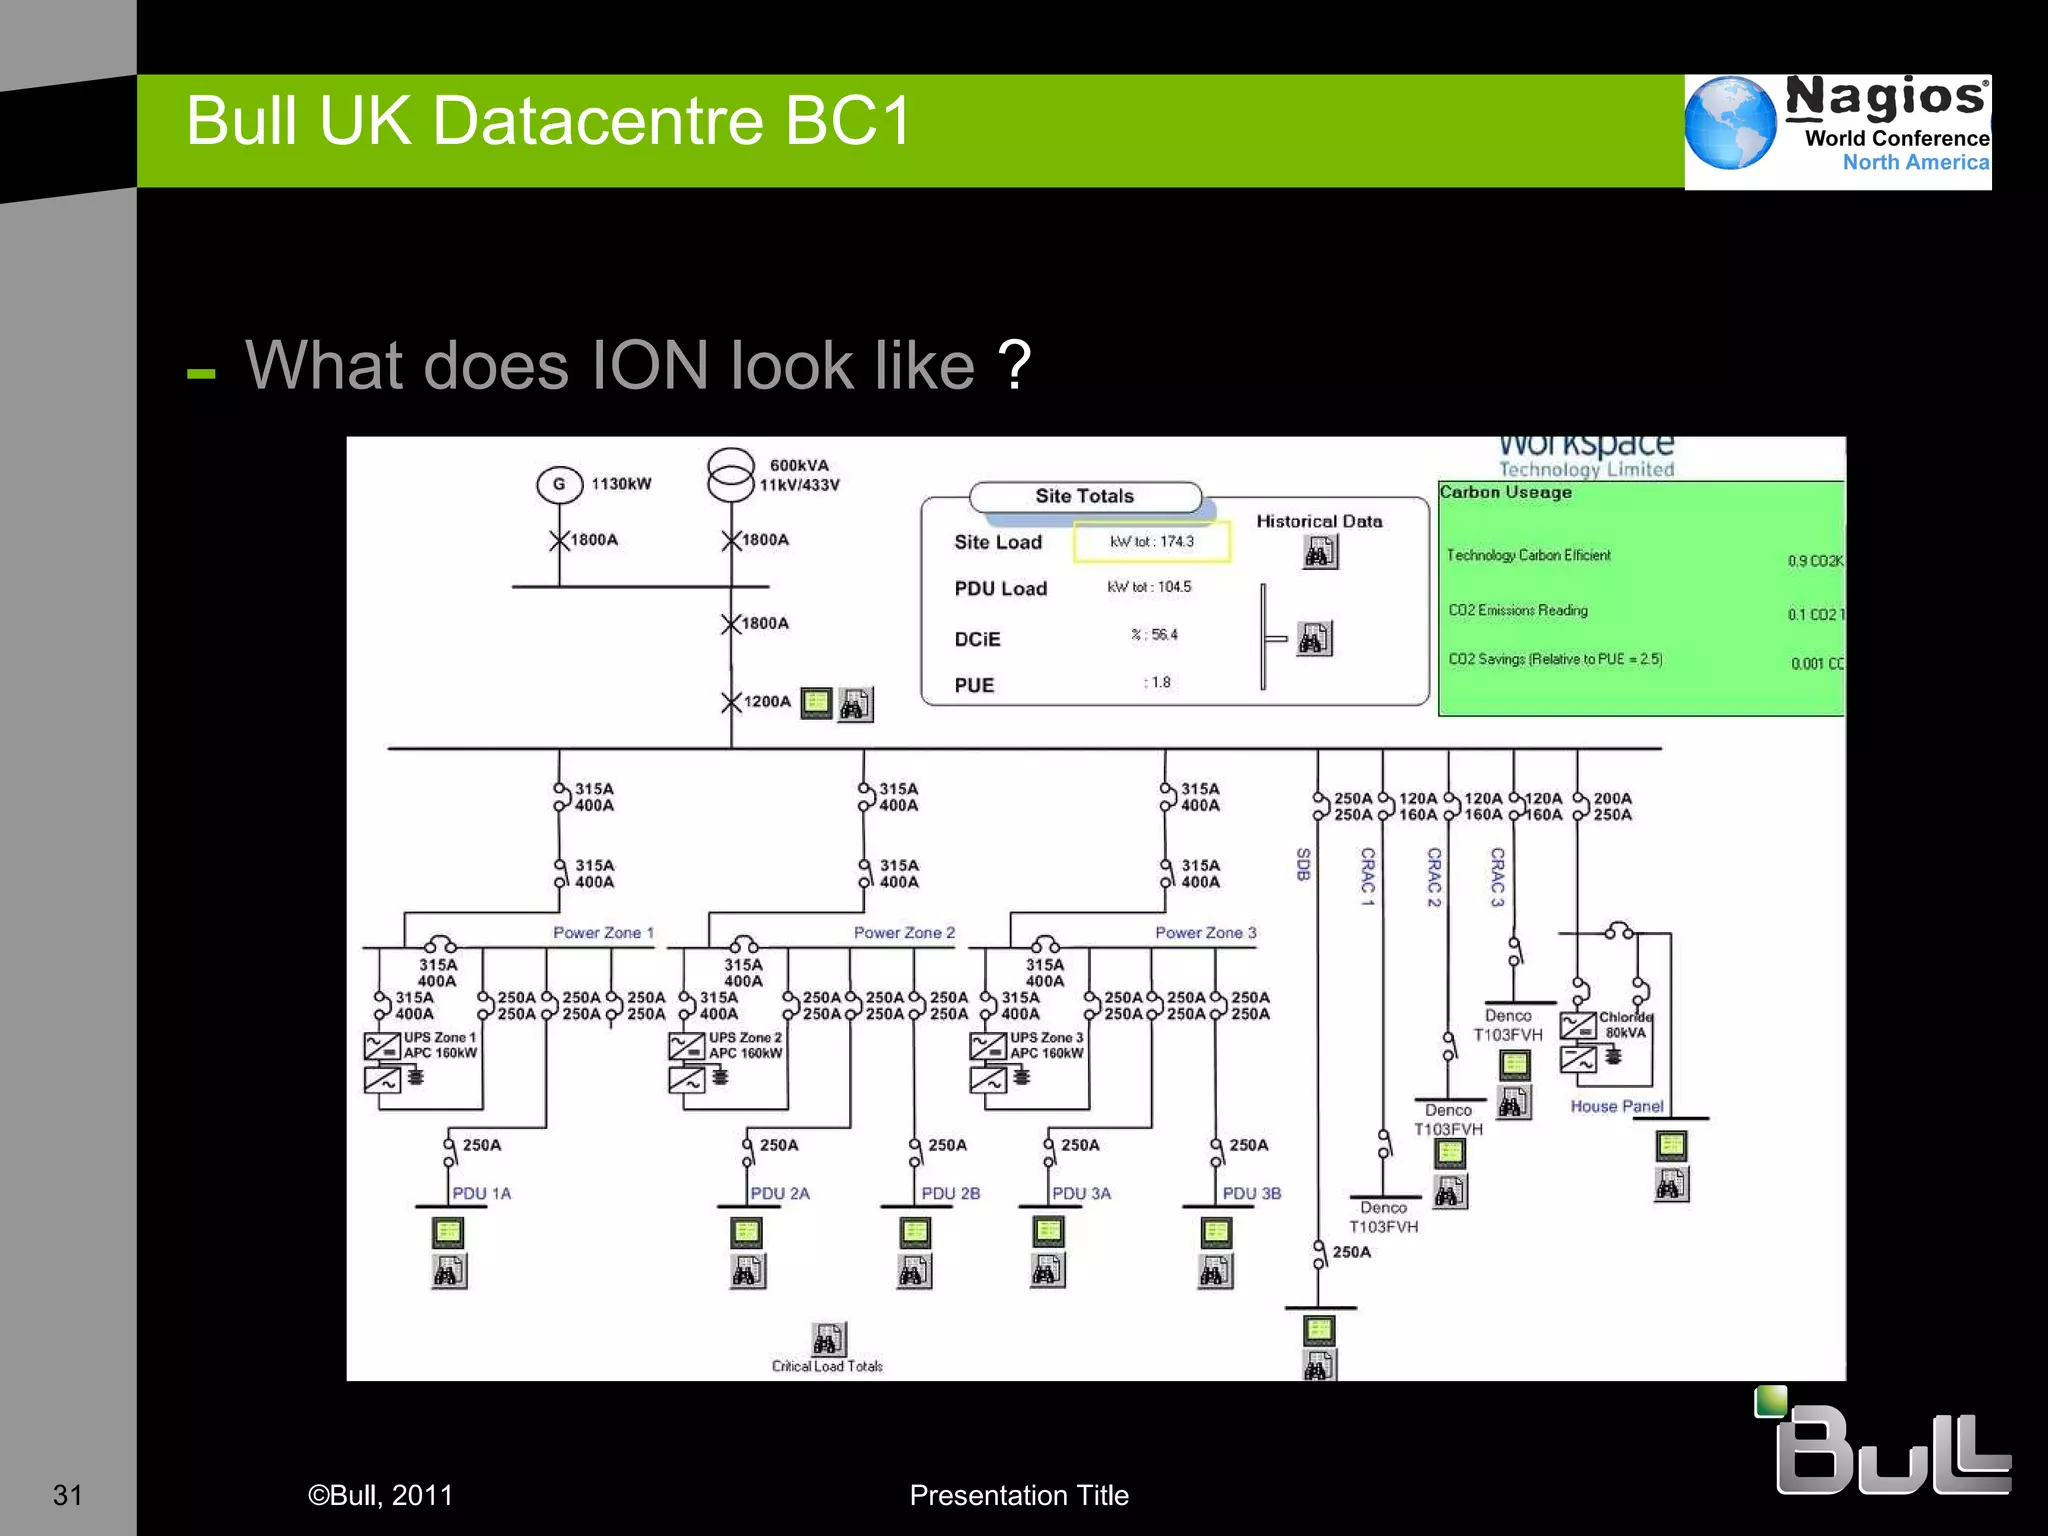
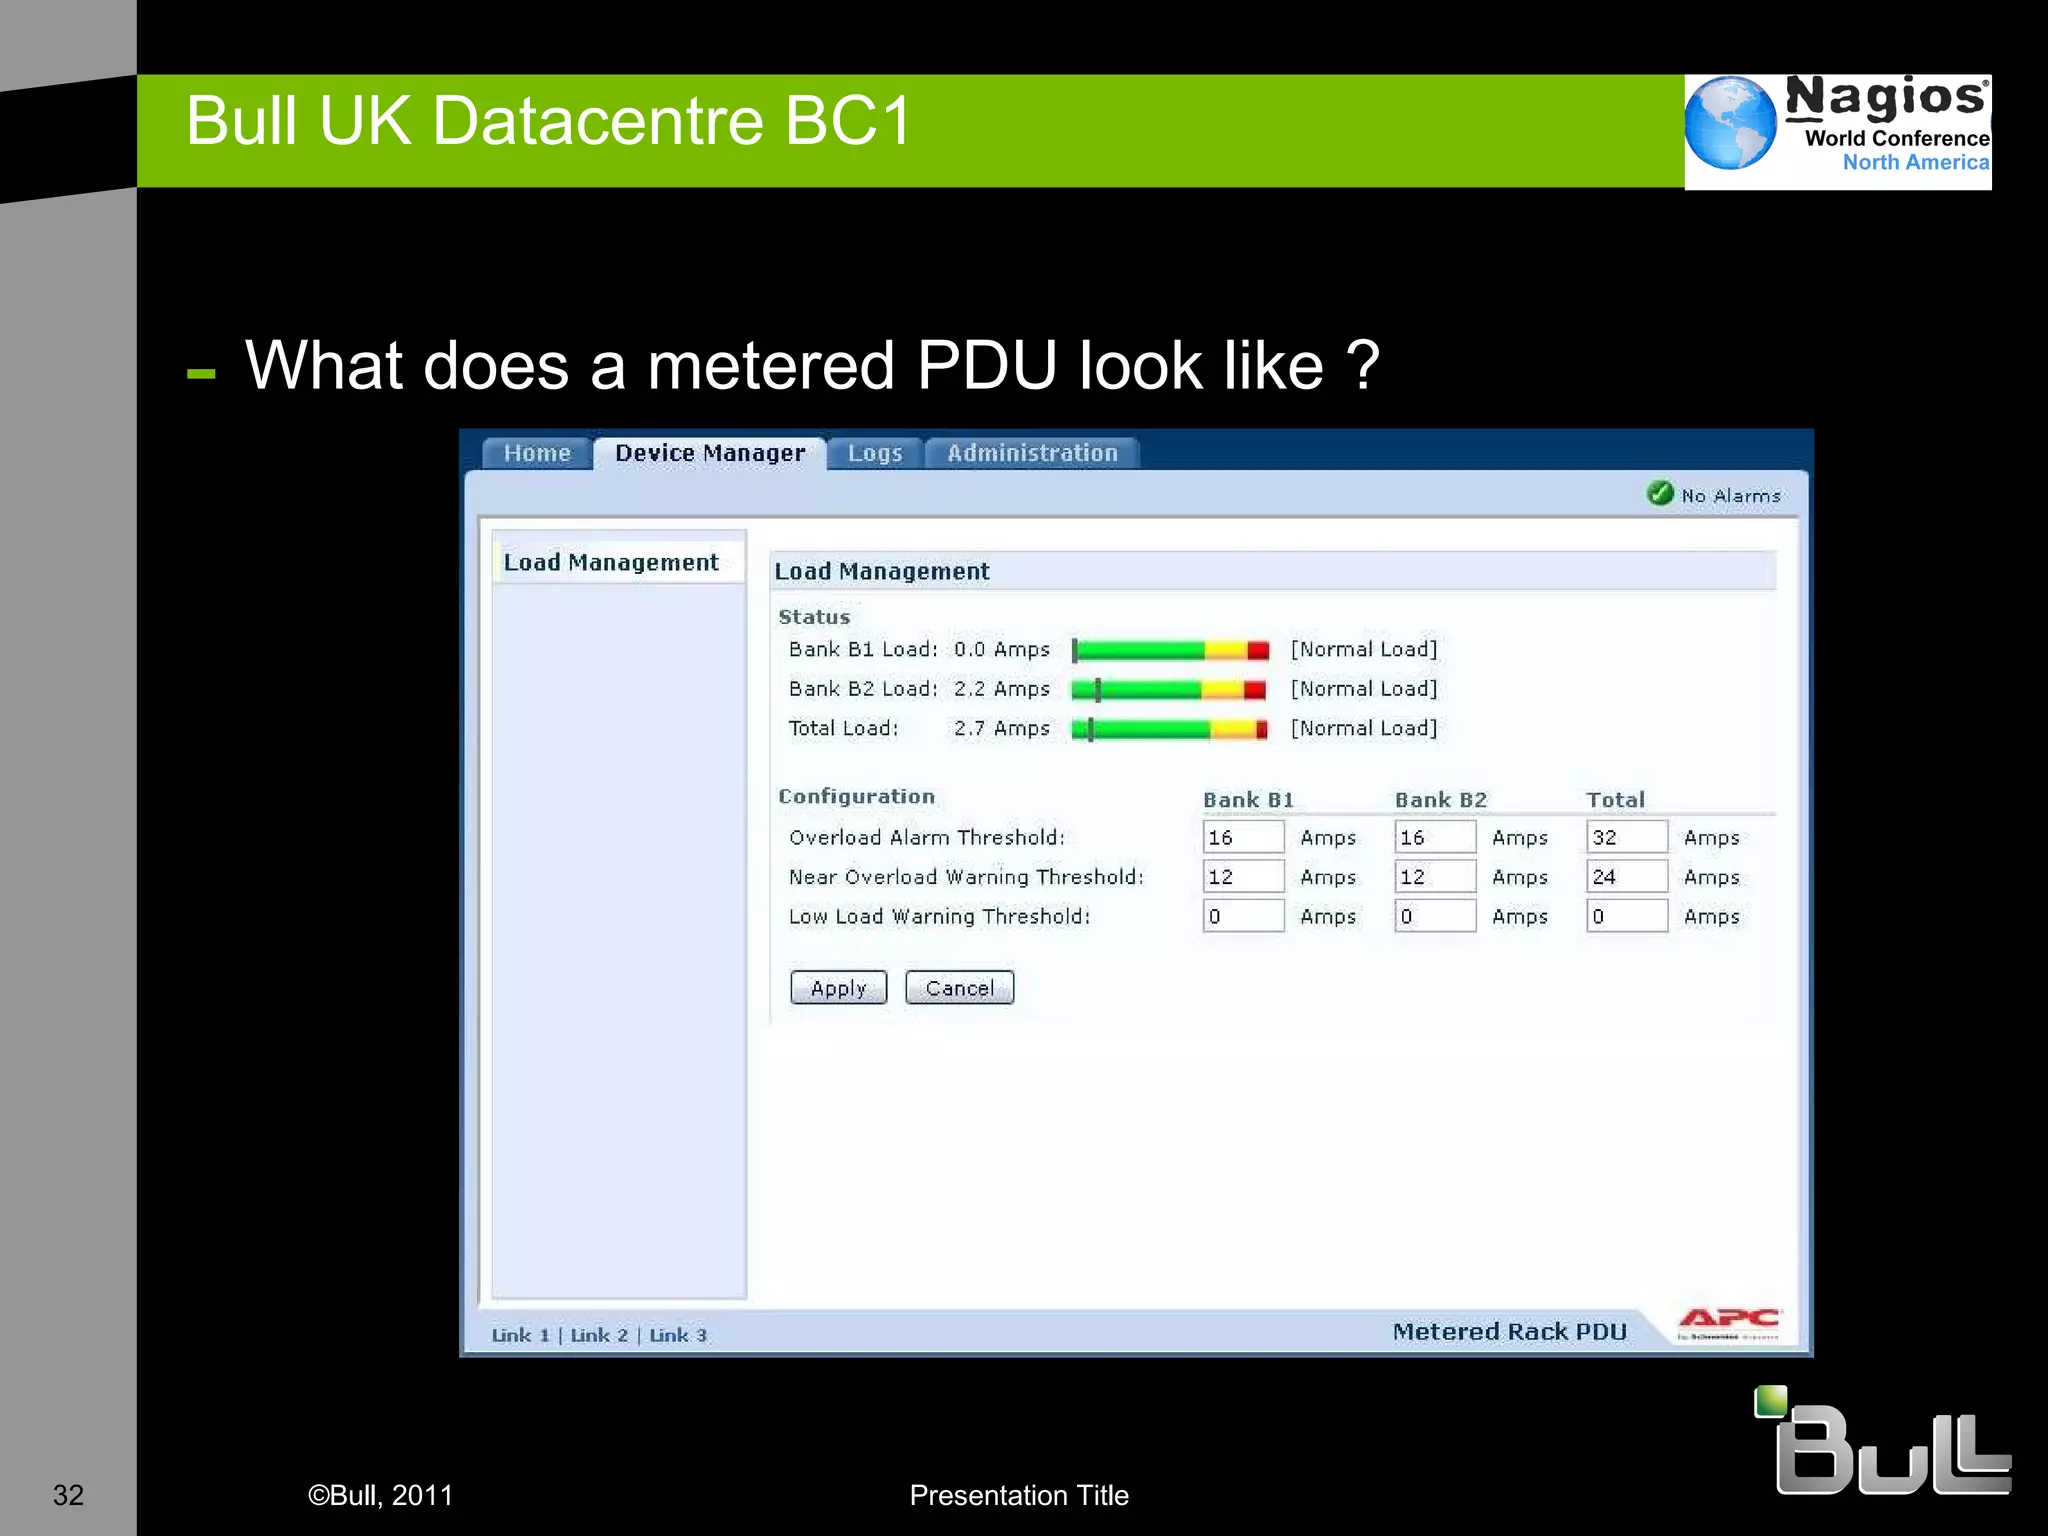
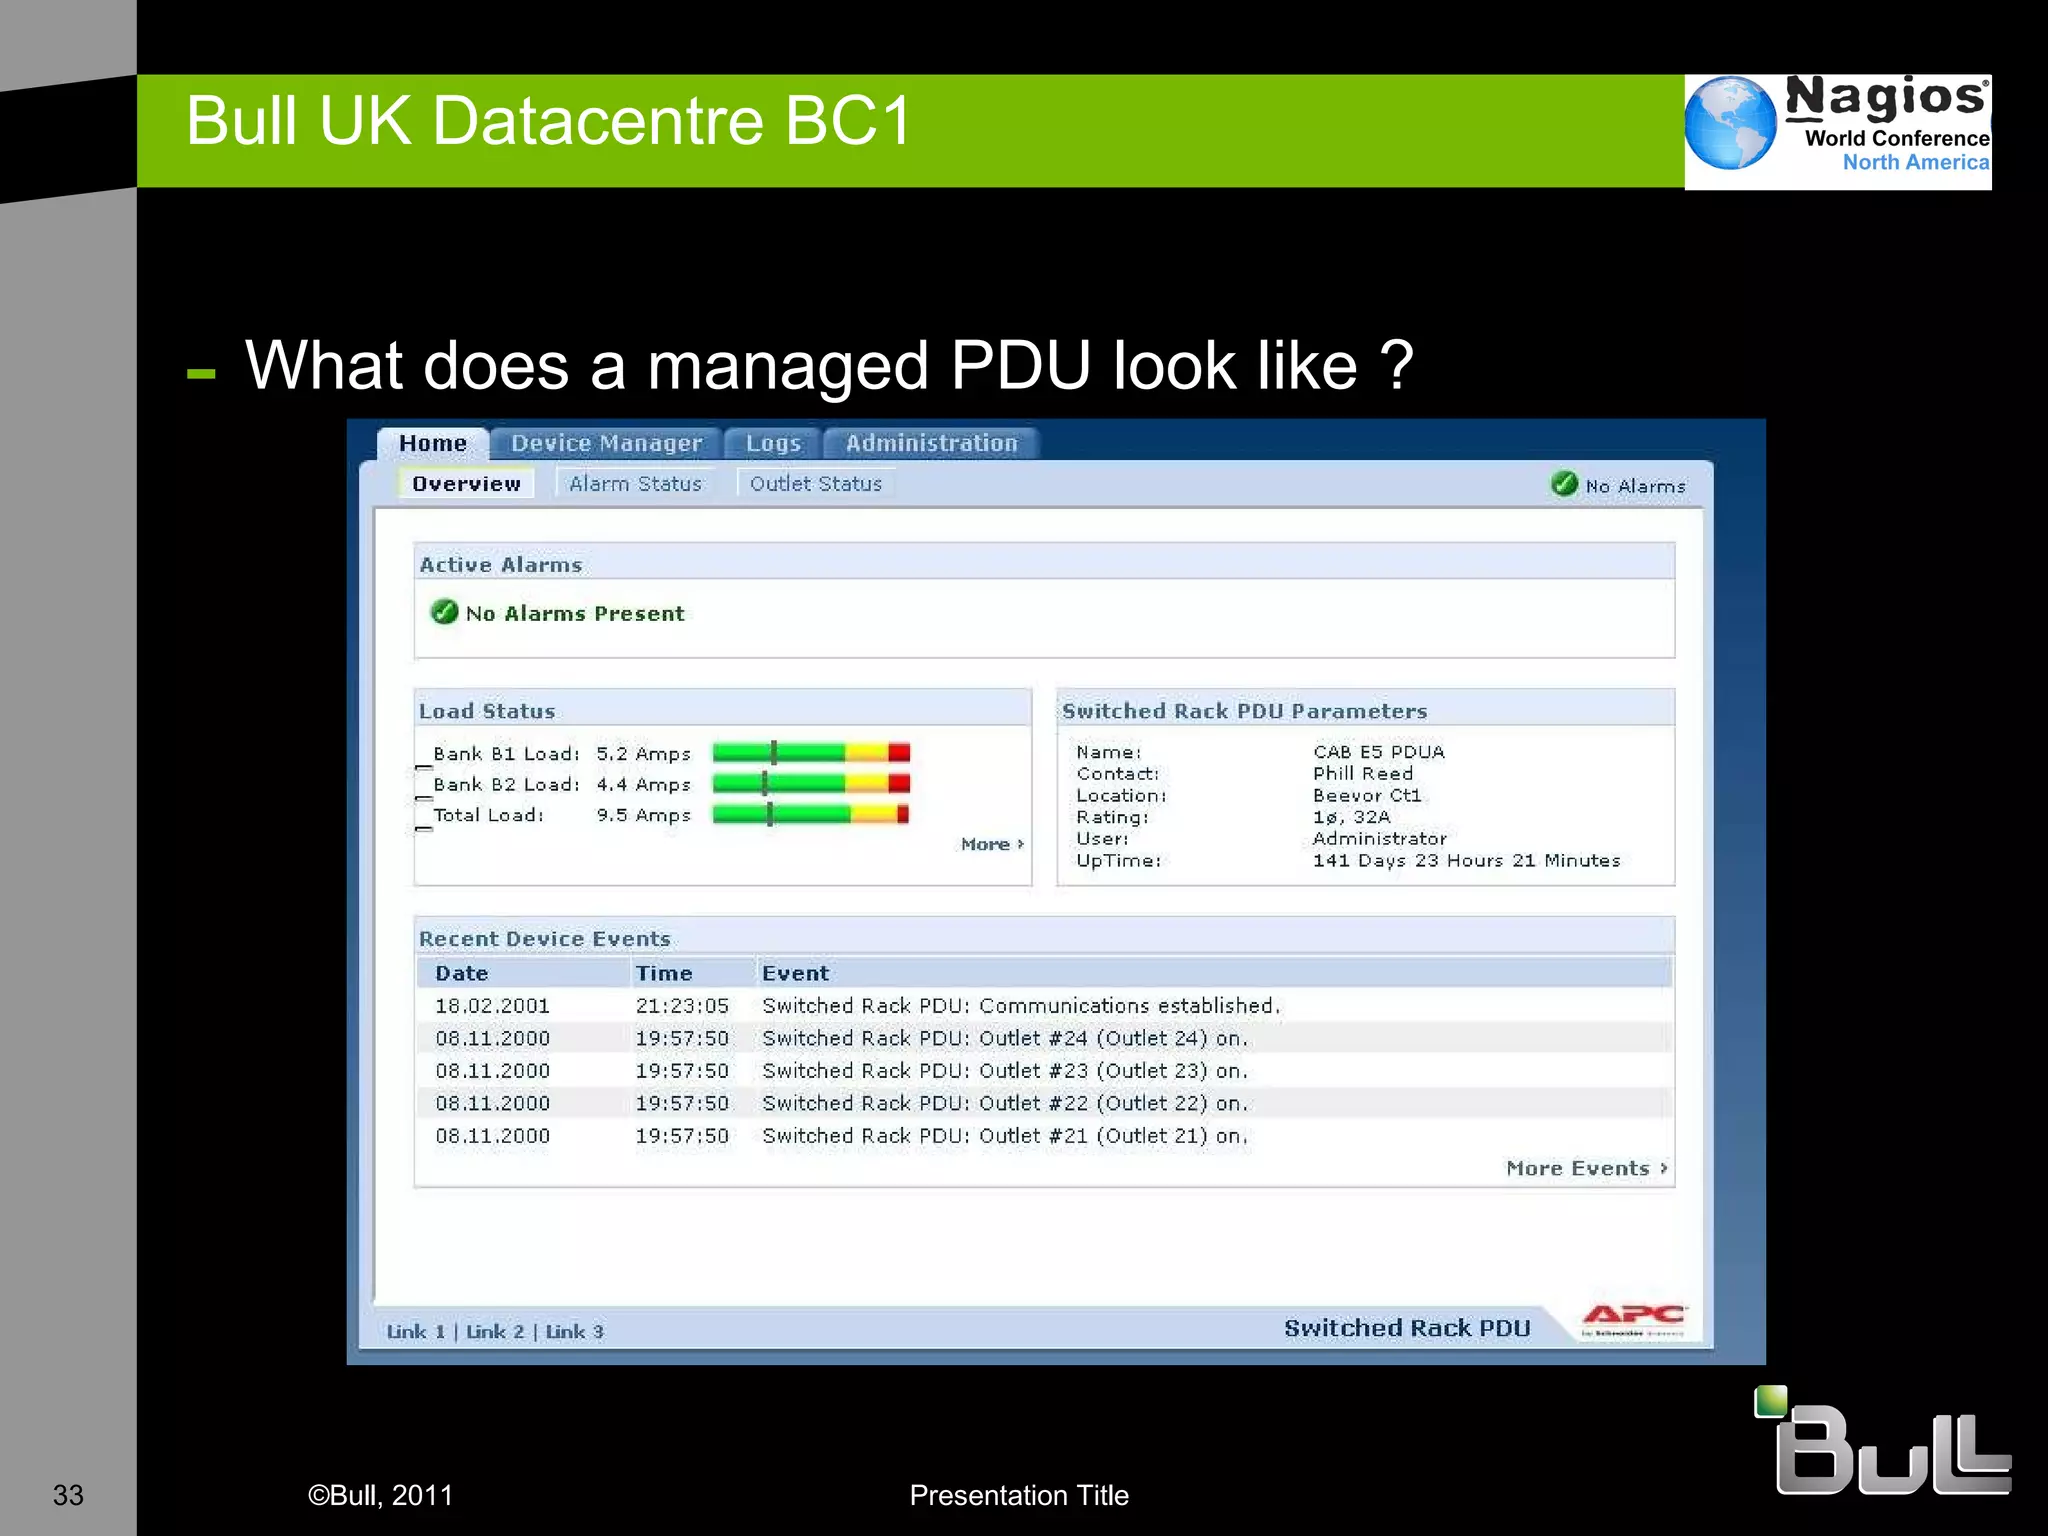
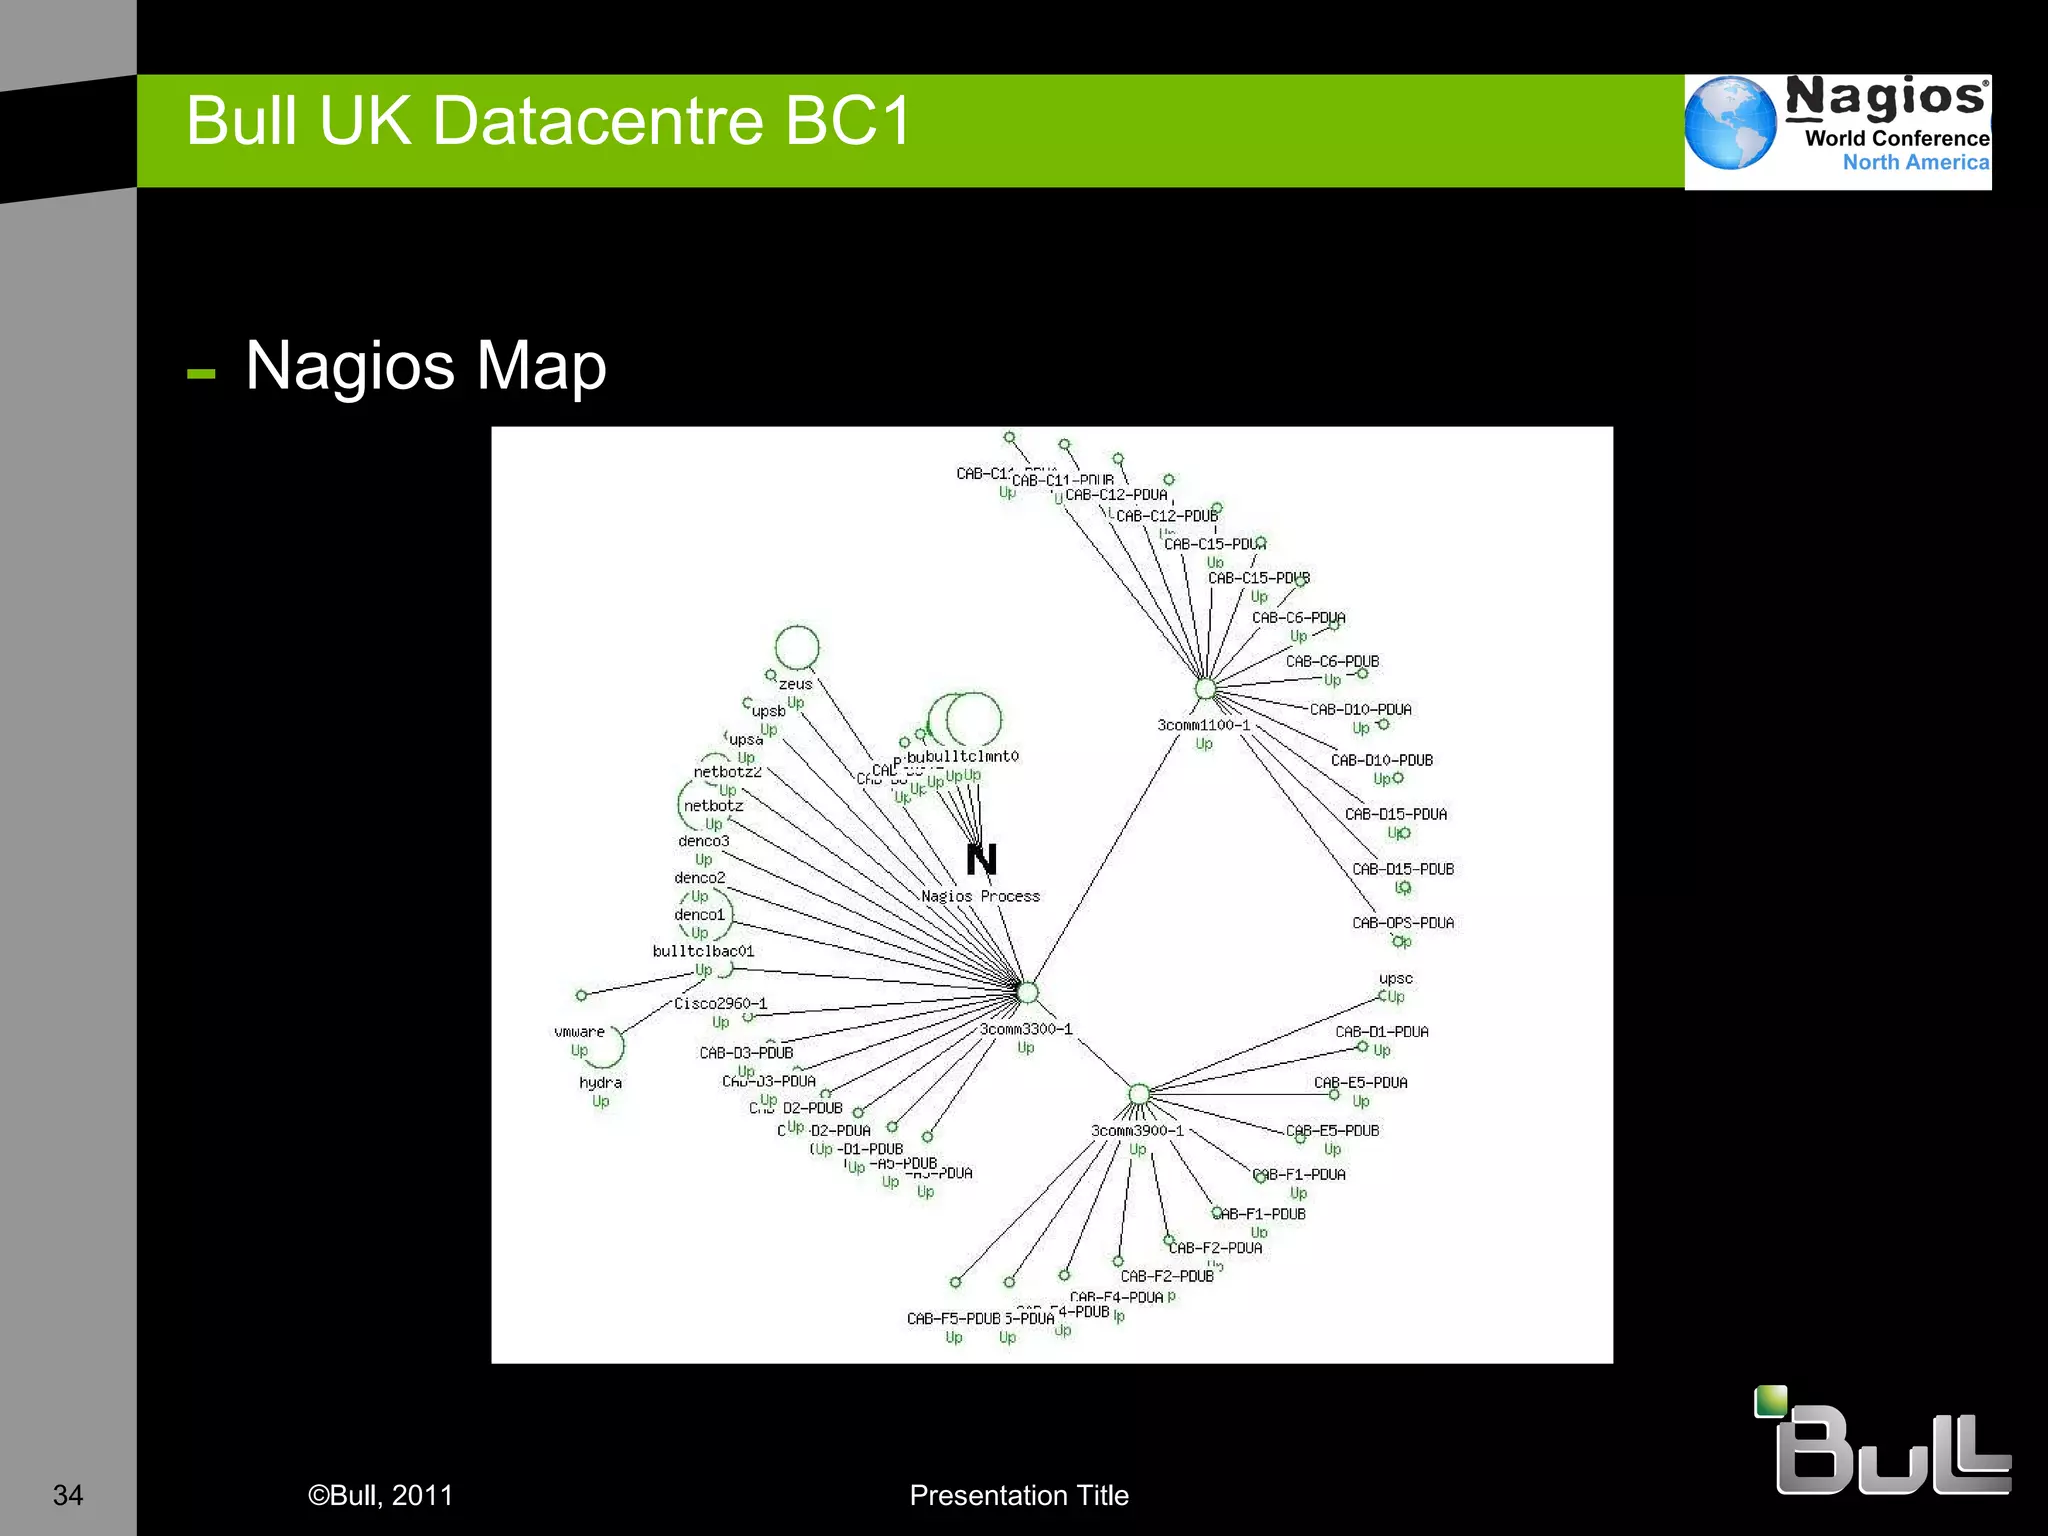
Nagios in the Real World Dave Williams  Technical Architect
Agenda
Agenda Introduction General Background System Monitoring Background Example Implementations of Nagios U K Customer Examples D atacentre Monitoring with Nagios What is a Datacentre ? Software & Hardware combinations Vision Conclusions
Background UK based Mainframe (IBM & Honeywell) Unix  (HP-UX, AIX, Solaris) Network (CASE, 3COM, CISCO)  W orking for Bull French Computer Manufacturer M ainframes, Unix, HPC, Security, Managed Services
Background System Monitoring OpenView Netview Open Master  Open Source Monitoring NetSaint on AIX Nagios
Example Implementations
Crown Office Procurator Fiscal Service Responsible for the prosecution of crime in Scotland  Investigation of suspicious deaths Complaints against the Police IT Locations in Glasgow & Edinburgh W indows at every Courts of Justice in Scotland AIX / Oracle DB at Glasgow & Edinburgh
Crown Office Procurator Fiscal Service Already used Solarwinds for some network monitoring S trategy demanded AIX based monitoring & reporting In a competitive tender Nagios selected Main success points were – simplicity, ease of customisation Fitted within AIX based distance data replication already in use
Crown Office Procurator Fiscal Service 60+ Windows systems monitored for CPU, Disk Space etc 2 AIX servers monitored for CPU, Disk Space etc T wo Oracle Instances monitored for performance and DBspace usage All alerts shown on monitor screen and if necessary SMS Text alerts Installed 2005, still working Provides ‘backstop’ to Solarwinds for capacity monitoring on the WAN & LAN.
Rother District Council “ Working with the community to improve the overall well-being of the District “ Responsible for Waste Collection, Housing, Planning & Building Control The District covers some 200 square miles and serves a population of around 90,000 inhabitants.
Rother District Council Monitoring 20+ Windows Servers for CPU, Disk Utilsation etc Monitoring numerous disparate Applications Reporting on Availability Monitoring Printer status Unexpected benefits
North Yorkshire County Council Internet Access system for 30,000 pupils Monitoring e-mail, internet access, IDS, AV, Webservers Reporting on Availability Monitoring Service Level Indicators Mix of application providers (Scalix, Plesk) Mix of appliance systems – Cisco, Panda, Radware, NetEnforcer, MyFilter
North Yorkshire County Council System Schematic
North Yorkshire County Council Uses NRPE to perform active checks on hosts Multi O/S support Debian RedHat Uses NSCA to accept check results from Windows Via NagiosEventLog
North Yorkshire County Council E-mail Scalix running on Redhat Cluster. Checking all processes, cluster state etc. PLESK Web server Checking availability of web sites via test installation Monitoring disk utilsation and processor utilisation AV systems Monitoring availability Checking on AV database Myfilter Monitoring email filters running Checking that sufficient email filters are available
North Yorkshire County Council E-mail Nagios server runs external email loopback test every 20 minutes to confirm external reachability. PLESK Web server Straightforward implementation of check_http NetBackup Monitoring that backups have run Checking that enough backup tapes are available Business Availability Define which services constitute a business line 07:00 check – tell support before the customers come on line
NYCC - Nagiosgraph Nagiosgraph Uses process_performance _data Example of Unix load average
NYCC – Nagios Monitoring Scalix Email System
NYCC Alerts sent via email to customers as well as support Backup notifications via SMS Text Use Nagios Looking Glass for Customer View nagiosgraph used to catch all service performance data Debian & Redhat perfomance metrics Network throughput from LAN switches LDAP response time
D atacentre Monitoring with Nagios
What is a DataCentre ? A data center (or datacentre) is a facility used to house computer systems and associated components, such as telecommunications and storage systems. It generally includes redundant or backup power supplies, redundant data communications connections, environmental controls and security devices.  (Wikipedia)
How good is your DataCentre ? The  TIA-942:Data  Center  Standards Overview  describes the requirements for the data centre infrastructure. The simplest is a Tier 1 data centre, which is basically a  server room , following basic guidelines for the installation of computer systems. The most stringent level is a Tier 4 data centre, which is designed to host mission critical computer systems, with fully redundant subsystems and compartmentalized security zones controlled by  biometric  access controls methods .  (Wikipedia)
What is a DataCentre ? Tier 1 Requirements Single non-redundant distribution path serving the IT equipment  Non-redundant capacity components  Basic site infrastructure guaranteeing 99.671% availability Tier 2 Requirements Fulfills all Tier 1 requirements  Redundant site infrastructure capacity components guaranteeing 99.741% availability  Tier 3 Requirements Fulfills all Tier 1 and Tier 2 requirements  Multiple independent distribution paths serving the IT equipment  All IT equipment must be dual-powered and fully compatible with the topology of a site's architecture Concurrently maintainable site infrastructure guaranteeing 99.982% availability  Tier 4 Requirements Fulfills all Tier 1, Tier 2 and Tier 3 requirements  All cooling equipment is independently dual-powered, including chillers and heating, ventilating and air-conditioning (HVAC) systems  Fault-tolerant site infrastructure with electrical power storage and distribution facilities guaranteeing 99.995% availability  © Uptime Institute
What is a Green DataCentre ? The most commonly used metric to determine the energy efficiency of a data centre is  power usage effectiveness , or PUE. This simple ratio is the total power entering the data centre divided by the power used by the IT equipment. PUE = Total facility Power / IT Equipment Power Power used by support equipment, often referred to as overhead load, mainly consists of cooling systems, power delivery, and other facility infrastructure like lighting. The average data centre in the US has a PUE of 2.0, meaning that the facility uses one Watt of overhead power for every Watt delivered to IT equipment. State-of-the-art data centre energy efficiency is estimated to be roughly 1.2.
Bull Datacentre BC1 ? New datacentre build on an already existing site Design criteria PUE 1.6  Easily expanded on demand Tier 3
Bull UK Datacentre BC1  What do you get for £1.2m ?
Bull UK Datacentre BC1 New Mains Incomer Took feed from 11Kv ring H ad to build own substation 1 .2Mw Generator Required 8000 litre fuel tank Switchgear to automatically start generator if mains incomer fails (10-45 seconds) 3 x Ambient CRAC Units Cooling via external temperature differential N+1 configuration Hot Aisle Containment I n-Line UPS UPS only required to keep IT equipment running until generator fires up Uses space in Cab rows, easily scalable according to load
Bull UK Datacentre BC1 - Monitoring Physical Environment APC Netbotz Devices Translate inputs from sensors Humidity, Temperature, Dew Point SEAL I/O Dry Contact Voltage indicators For CRAC, FM200, Generator, UPS Electrical Efficiency PowerLogic ION software reads from power meters Power meter on every Distribution Board Real-time calculation of PUE Power Distribution Every PDU strip (2 per Cab) monitored for power consumption & problems A number of PDU strips also have remote control down to socket level Management Network LAN infrastructure required to support the Datacentre Servers required to support the datacentre External alert mechanisms
Bull UK Datacentre BC1  What does Netbotz look like ?
Bull UK Datacentre BC1  What does SeaLevel look like ?
Bull UK Datacentre BC1  What does ION look like  ?
Bull UK Datacentre BC1  What does a metered PDU look like ?
Bull UK Datacentre BC1  What does a managed PDU look like ?
Bull UK Datacentre BC1  Nagios Map
Bull UK Datacentre BC1  Nagios Host Groups
Bull UK Datacentre BC1  Do things go wrong - yes
Bull UK Datacentre BC1  Do things go wrong - yes & no
Datacentre Monitoring Schematic
Nagios Products in use Nagios Core NRPE NSCA Nagios Looking Glass Nagvis EventDB SNMPTT Nagmap NDO
Other Open Source Products in use Nedi Arpwatch PSAD SMS-Client Bacula Confluence (Wiki) i-doit (ITIL CMDB) MRTG Routers2cgi
BC1 Datacentre Monitoring Elements Nagios Core Normal install with direct polling of devices Only looking at Datacentre Nagios Display System Central reporting Nagios  Absorbs updates from other Nagios instances Information Display Normal system with 5 heads Nagios Customer System Running on an appliance connected to Customer network Sends data via encrypted secured link to Display System Backup System Use tape library Hosts CMDB & WiKi
BC1 Datacentre Nagios Core Hardware Platform - Intel O/S Centos 5 X eon 2.8Ghz , 8Gb memory, 72GB RAID-1 disk  N agios 3.2.0 B uilt from source tarball Nagios Plugins 1.4.15-2 I nstalled from RPM
BC1 Datacentre Nagios Display System Hardware Platform - Intel O/S Fedora Core 9 P4 2.8Ghz , 2.5Gb memory, 76GB RAID-1 disk Nvidia dual monitor display Card – DVI interfaces N agios 3.0.6 B uilt from source tarball Nagios Plugins 1.4.13-9 I nstalled from RPM
BC1 Datacentre Normal Display System Hardware Platform - AMD O/S Centos 5 Athlon 1.2Ghz , 1.0 Gb memory, 3GB disk Matrox G200 Quad Head  Runs console displays – http/RDP/ssh
BC1 Datacentre Customer System Hardware Platform – Motion Tablet O/S Ubuntu 10.04 LTS Pentium M 1.5Ghz , 0.5 Gb memory, 30GB disk Touch Screen tablet system  Nagios 3.2.3 Built from tarball Nagios Plugins 1.4.15 Built from tarball Nagios NSCA Sends status (encrypted) to central reporting system
BC1 Datacentre Backup System Hardware Platform – Intel O/S Centos 5 Xeon 3.06Ghz , 2.0 Gb memory, 108GB disk Uses Bacula 5.0.3 Controls SDLT 20 slot tape library Backs up all Datacentre Infrastructure Windows Centos Ubuntu
Conclusions
Conclusions Strategic Overall Design Know what you need to monitor Know who needs to be told E xpect to throw the first version away Only when you have fully engineered the solution will you understand all of the issues Keep a record of design decisions You will have to make it pretty for management Accept that an attractive display will be required Reporting will become key I t must be reliable Make backups Consider clustering & recovery options
& Hints
Hints & Experience Separate Display systems from Monitoring systems If you are tracking 10,000’s of services you don’t want processor heavy graphics as well E scalation & Alerting take time Firstly to get right with your organisation Secondly to actually physically do ! Suppliers go out of their way to make it difficult Don’t give in – there is always a way to get Nagios involved Screen scrape, email, telnet,RS232 are all possible SNMP is your friend When in doubt use SNMP to help you out SNMP V3 with AES cypher is suitably secure for most implementations


Nagios Conference 2011 - Dave Williams - Nagios In The Real World - The Datacentre

  • 1.
    Nagios in theReal World Dave Williams Technical Architect
  • 2.
  • 3.
    Agenda Introduction GeneralBackground System Monitoring Background Example Implementations of Nagios U K Customer Examples D atacentre Monitoring with Nagios What is a Datacentre ? Software & Hardware combinations Vision Conclusions
  • 4.
    Background UK basedMainframe (IBM & Honeywell) Unix (HP-UX, AIX, Solaris) Network (CASE, 3COM, CISCO) W orking for Bull French Computer Manufacturer M ainframes, Unix, HPC, Security, Managed Services
  • 5.
    Background System MonitoringOpenView Netview Open Master Open Source Monitoring NetSaint on AIX Nagios
  • 6.
  • 7.
    Crown Office ProcuratorFiscal Service Responsible for the prosecution of crime in Scotland Investigation of suspicious deaths Complaints against the Police IT Locations in Glasgow & Edinburgh W indows at every Courts of Justice in Scotland AIX / Oracle DB at Glasgow & Edinburgh
  • 8.
    Crown Office ProcuratorFiscal Service Already used Solarwinds for some network monitoring S trategy demanded AIX based monitoring & reporting In a competitive tender Nagios selected Main success points were – simplicity, ease of customisation Fitted within AIX based distance data replication already in use
  • 9.
    Crown Office ProcuratorFiscal Service 60+ Windows systems monitored for CPU, Disk Space etc 2 AIX servers monitored for CPU, Disk Space etc T wo Oracle Instances monitored for performance and DBspace usage All alerts shown on monitor screen and if necessary SMS Text alerts Installed 2005, still working Provides ‘backstop’ to Solarwinds for capacity monitoring on the WAN & LAN.
  • 10.
    Rother District Council“ Working with the community to improve the overall well-being of the District “ Responsible for Waste Collection, Housing, Planning & Building Control The District covers some 200 square miles and serves a population of around 90,000 inhabitants.
  • 11.
    Rother District CouncilMonitoring 20+ Windows Servers for CPU, Disk Utilsation etc Monitoring numerous disparate Applications Reporting on Availability Monitoring Printer status Unexpected benefits
  • 12.
    North Yorkshire CountyCouncil Internet Access system for 30,000 pupils Monitoring e-mail, internet access, IDS, AV, Webservers Reporting on Availability Monitoring Service Level Indicators Mix of application providers (Scalix, Plesk) Mix of appliance systems – Cisco, Panda, Radware, NetEnforcer, MyFilter
  • 13.
    North Yorkshire CountyCouncil System Schematic
  • 14.
    North Yorkshire CountyCouncil Uses NRPE to perform active checks on hosts Multi O/S support Debian RedHat Uses NSCA to accept check results from Windows Via NagiosEventLog
  • 15.
    North Yorkshire CountyCouncil E-mail Scalix running on Redhat Cluster. Checking all processes, cluster state etc. PLESK Web server Checking availability of web sites via test installation Monitoring disk utilsation and processor utilisation AV systems Monitoring availability Checking on AV database Myfilter Monitoring email filters running Checking that sufficient email filters are available
  • 16.
    North Yorkshire CountyCouncil E-mail Nagios server runs external email loopback test every 20 minutes to confirm external reachability. PLESK Web server Straightforward implementation of check_http NetBackup Monitoring that backups have run Checking that enough backup tapes are available Business Availability Define which services constitute a business line 07:00 check – tell support before the customers come on line
  • 17.
    NYCC - NagiosgraphNagiosgraph Uses process_performance _data Example of Unix load average
  • 18.
    NYCC – NagiosMonitoring Scalix Email System
  • 19.
    NYCC Alerts sentvia email to customers as well as support Backup notifications via SMS Text Use Nagios Looking Glass for Customer View nagiosgraph used to catch all service performance data Debian & Redhat perfomance metrics Network throughput from LAN switches LDAP response time
  • 20.
  • 21.
    What is aDataCentre ? A data center (or datacentre) is a facility used to house computer systems and associated components, such as telecommunications and storage systems. It generally includes redundant or backup power supplies, redundant data communications connections, environmental controls and security devices. (Wikipedia)
  • 22.
    How good isyour DataCentre ? The TIA-942:Data Center Standards Overview describes the requirements for the data centre infrastructure. The simplest is a Tier 1 data centre, which is basically a server room , following basic guidelines for the installation of computer systems. The most stringent level is a Tier 4 data centre, which is designed to host mission critical computer systems, with fully redundant subsystems and compartmentalized security zones controlled by biometric access controls methods . (Wikipedia)
  • 23.
    What is aDataCentre ? Tier 1 Requirements Single non-redundant distribution path serving the IT equipment Non-redundant capacity components Basic site infrastructure guaranteeing 99.671% availability Tier 2 Requirements Fulfills all Tier 1 requirements Redundant site infrastructure capacity components guaranteeing 99.741% availability Tier 3 Requirements Fulfills all Tier 1 and Tier 2 requirements Multiple independent distribution paths serving the IT equipment All IT equipment must be dual-powered and fully compatible with the topology of a site's architecture Concurrently maintainable site infrastructure guaranteeing 99.982% availability Tier 4 Requirements Fulfills all Tier 1, Tier 2 and Tier 3 requirements All cooling equipment is independently dual-powered, including chillers and heating, ventilating and air-conditioning (HVAC) systems Fault-tolerant site infrastructure with electrical power storage and distribution facilities guaranteeing 99.995% availability © Uptime Institute
  • 24.
    What is aGreen DataCentre ? The most commonly used metric to determine the energy efficiency of a data centre is power usage effectiveness , or PUE. This simple ratio is the total power entering the data centre divided by the power used by the IT equipment. PUE = Total facility Power / IT Equipment Power Power used by support equipment, often referred to as overhead load, mainly consists of cooling systems, power delivery, and other facility infrastructure like lighting. The average data centre in the US has a PUE of 2.0, meaning that the facility uses one Watt of overhead power for every Watt delivered to IT equipment. State-of-the-art data centre energy efficiency is estimated to be roughly 1.2.
  • 25.
    Bull Datacentre BC1? New datacentre build on an already existing site Design criteria PUE 1.6 Easily expanded on demand Tier 3
  • 26.
    Bull UK DatacentreBC1 What do you get for £1.2m ?
  • 27.
    Bull UK DatacentreBC1 New Mains Incomer Took feed from 11Kv ring H ad to build own substation 1 .2Mw Generator Required 8000 litre fuel tank Switchgear to automatically start generator if mains incomer fails (10-45 seconds) 3 x Ambient CRAC Units Cooling via external temperature differential N+1 configuration Hot Aisle Containment I n-Line UPS UPS only required to keep IT equipment running until generator fires up Uses space in Cab rows, easily scalable according to load
  • 28.
    Bull UK DatacentreBC1 - Monitoring Physical Environment APC Netbotz Devices Translate inputs from sensors Humidity, Temperature, Dew Point SEAL I/O Dry Contact Voltage indicators For CRAC, FM200, Generator, UPS Electrical Efficiency PowerLogic ION software reads from power meters Power meter on every Distribution Board Real-time calculation of PUE Power Distribution Every PDU strip (2 per Cab) monitored for power consumption & problems A number of PDU strips also have remote control down to socket level Management Network LAN infrastructure required to support the Datacentre Servers required to support the datacentre External alert mechanisms
  • 29.
    Bull UK DatacentreBC1 What does Netbotz look like ?
  • 30.
    Bull UK DatacentreBC1 What does SeaLevel look like ?
  • 31.
    Bull UK DatacentreBC1 What does ION look like ?
  • 32.
    Bull UK DatacentreBC1 What does a metered PDU look like ?
  • 33.
    Bull UK DatacentreBC1 What does a managed PDU look like ?
  • 34.
    Bull UK DatacentreBC1 Nagios Map
  • 35.
    Bull UK DatacentreBC1 Nagios Host Groups
  • 36.
    Bull UK DatacentreBC1 Do things go wrong - yes
  • 37.
    Bull UK DatacentreBC1 Do things go wrong - yes & no
  • 38.
  • 39.
    Nagios Products inuse Nagios Core NRPE NSCA Nagios Looking Glass Nagvis EventDB SNMPTT Nagmap NDO
  • 40.
    Other Open SourceProducts in use Nedi Arpwatch PSAD SMS-Client Bacula Confluence (Wiki) i-doit (ITIL CMDB) MRTG Routers2cgi
  • 41.
    BC1 Datacentre MonitoringElements Nagios Core Normal install with direct polling of devices Only looking at Datacentre Nagios Display System Central reporting Nagios Absorbs updates from other Nagios instances Information Display Normal system with 5 heads Nagios Customer System Running on an appliance connected to Customer network Sends data via encrypted secured link to Display System Backup System Use tape library Hosts CMDB & WiKi
  • 42.
    BC1 Datacentre NagiosCore Hardware Platform - Intel O/S Centos 5 X eon 2.8Ghz , 8Gb memory, 72GB RAID-1 disk N agios 3.2.0 B uilt from source tarball Nagios Plugins 1.4.15-2 I nstalled from RPM
  • 43.
    BC1 Datacentre NagiosDisplay System Hardware Platform - Intel O/S Fedora Core 9 P4 2.8Ghz , 2.5Gb memory, 76GB RAID-1 disk Nvidia dual monitor display Card – DVI interfaces N agios 3.0.6 B uilt from source tarball Nagios Plugins 1.4.13-9 I nstalled from RPM
  • 44.
    BC1 Datacentre NormalDisplay System Hardware Platform - AMD O/S Centos 5 Athlon 1.2Ghz , 1.0 Gb memory, 3GB disk Matrox G200 Quad Head Runs console displays – http/RDP/ssh
  • 45.
    BC1 Datacentre CustomerSystem Hardware Platform – Motion Tablet O/S Ubuntu 10.04 LTS Pentium M 1.5Ghz , 0.5 Gb memory, 30GB disk Touch Screen tablet system Nagios 3.2.3 Built from tarball Nagios Plugins 1.4.15 Built from tarball Nagios NSCA Sends status (encrypted) to central reporting system
  • 46.
    BC1 Datacentre BackupSystem Hardware Platform – Intel O/S Centos 5 Xeon 3.06Ghz , 2.0 Gb memory, 108GB disk Uses Bacula 5.0.3 Controls SDLT 20 slot tape library Backs up all Datacentre Infrastructure Windows Centos Ubuntu
  • 47.
  • 48.
    Conclusions Strategic OverallDesign Know what you need to monitor Know who needs to be told E xpect to throw the first version away Only when you have fully engineered the solution will you understand all of the issues Keep a record of design decisions You will have to make it pretty for management Accept that an attractive display will be required Reporting will become key I t must be reliable Make backups Consider clustering & recovery options
  • 49.
  • 50.
    Hints & ExperienceSeparate Display systems from Monitoring systems If you are tracking 10,000’s of services you don’t want processor heavy graphics as well E scalation & Alerting take time Firstly to get right with your organisation Secondly to actually physically do ! Suppliers go out of their way to make it difficult Don’t give in – there is always a way to get Nagios involved Screen scrape, email, telnet,RS232 are all possible SNMP is your friend When in doubt use SNMP to help you out SNMP V3 with AES cypher is suitably secure for most implementations
  • 51.
  • 52.
  • 53.
  • 54.

Editor's Notes

  • #24 99.995 uptime = 27 minutes a year 99.982 = 1.6 hours downtime per year 99.741 = 22 hours downtime a year 99.671 = 28.8 hours downtime
  • #25 99.671 = 28.8 hours downtime DCiE = IT Equipment Power / Total Facility Power Data Centre infrastructure Efficiency
  • #28 BC1 Latitude 53 degrees – good for ambient cooling! Fuel for 48 hours running time
  • #29 BC1 Latitude 53 degrees – good for ambient cooling! Fuel for 48 hours running time