Download to read offline

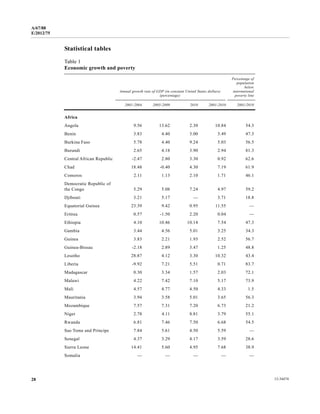
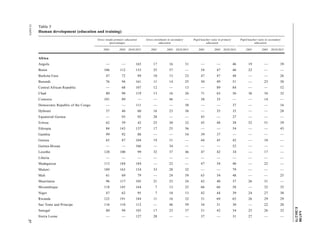
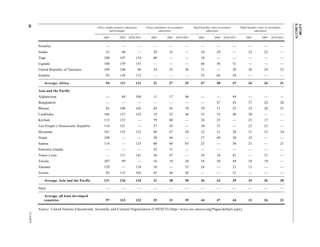
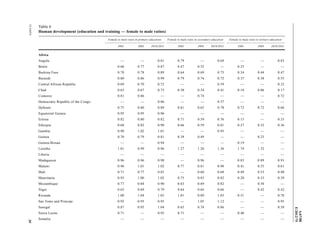
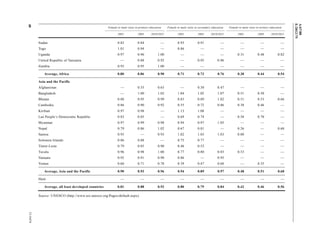
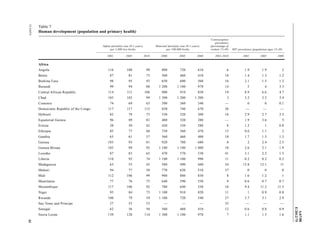
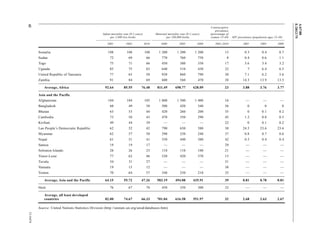
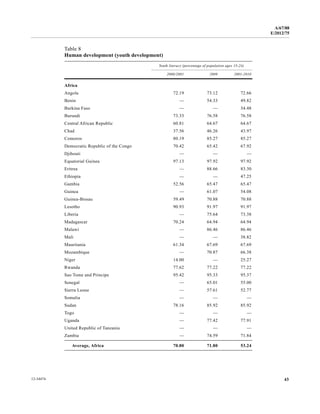
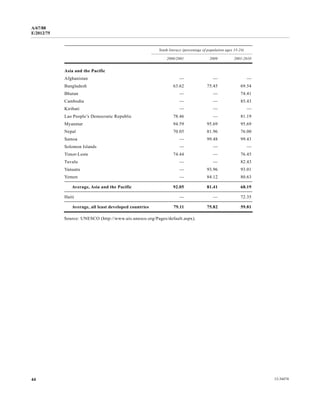

This document provides a summary of the Secretary-General's report on progress implementing the Istanbul Programme of Action for Least Developed Countries. It finds that while GDP growth in LDCs accelerated over the past decade, reaching an average of 6.6% annually between 2001-2010, the growth has been uneven and slowed since the global recession. Poverty reduction progress has also been mixed. The report analyzes trends in key priority areas for LDCs, finding limited structural economic transformation or increases in productive capacity and infrastructure access. It concludes by calling for growth that creates jobs and enables greater poverty reduction and social development progress in LDCs.


