Download to read offline


![Further Resources
QSR video tutorials: http://www.qsrinternational.com/support_tutorials.aspx
Follow QSR on twitter for information about free training seminars, updates and tips: @QSRInt
Mantra practical on research data management (data files are in NVivo 9):
http://datalib.edina.ac.uk/mantra/softwarepracticals.html
Bazeley, P. Resources for qualitative data analysis and users of NVivo
http://www.researchsupport.com.au/ (website with freely available resources)
Bazeley, P. and Jackson, K. (2013). Doing qualitative data analysis with NVivo. 2nd Ed. London:
SAGE.
LinkedIn NVivo Users Group – good source of advice from experienced users. Free, but requires
a LinkedIn account and application to join the grouhttps://www.linkedin.com/groups/NVivo-Users-
Group-145388/about
Learn Nvivo: the basics [video tutorial course]. Lynda. Released 23 Nov 2016. (uses the basic
NVivo 11 Starter version) https://www.lynda.com/NVivo-tutorials/Learn-NVivo-Basics/530082-
2.html?org=ed.ac.uk](https://image.slidesharecdn.com/nvivoprogram-171108065338/85/N-vivo-program-34-320.jpg)

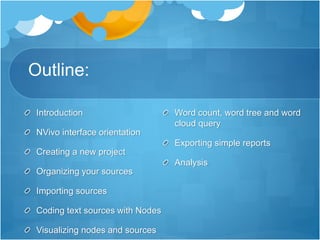
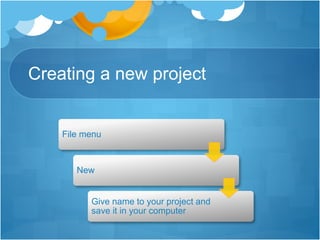
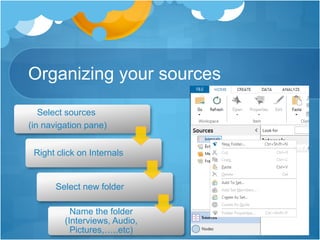
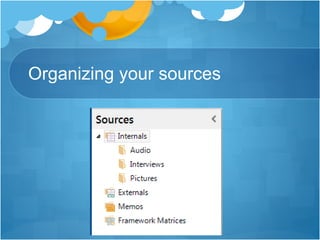
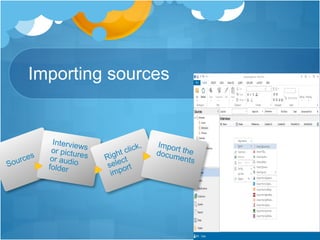
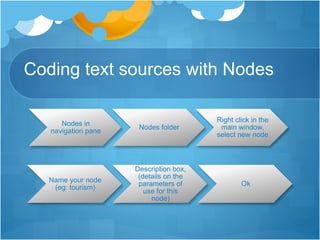
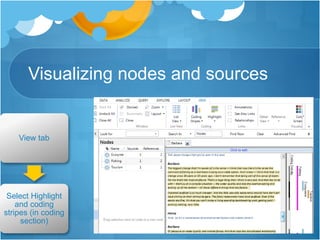
This document provides an overview of how to use NVivo, a qualitative data analysis software. It outlines the NVivo interface and how to create a new project. It describes how to organize sources by importing them into the project and coding them with nodes. It also discusses how to visualize nodes and sources, perform word queries, and export simple reports. The document serves as an introduction to the basic functions and analysis capabilities of NVivo.


