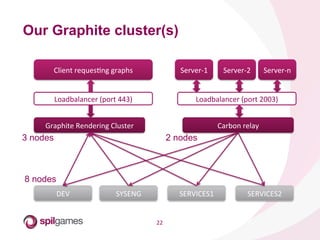
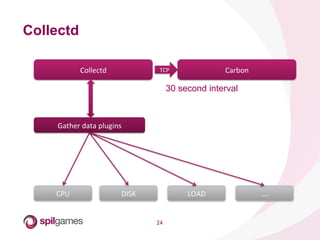
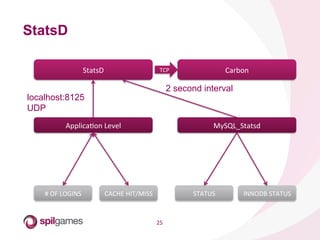
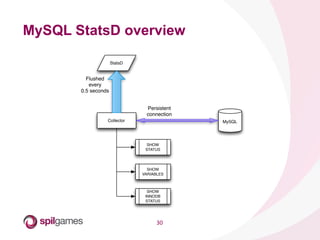
This document discusses monitoring MySQL performance using StatsD and Graphite. It provides an overview of the tools and how they are used. StatsD collects metrics from applications and services and sends them to Graphite for storage and visualization. The document describes how a custom MySQL StatsD daemon was created to gather MySQL metrics and send them to StatsD in real-time for high granularity monitoring and graphing in Graphite.


![17
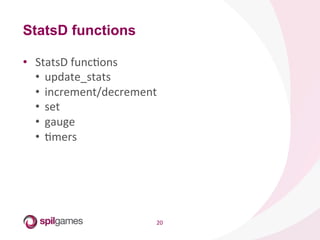
• Each
metric
is
in
its
own
bucket
• Periods
make
folders
• prod.syseng.mmm.<hostname>.admin_offline
• Metric
types
• Counters
• Gauge
• RetenHon
can
be
set
using
a
regex
• [mysql]
• pasern
=
^prod.syseng.mysql..*$
• retenHons
=
2s:1d,1m:3d,5m:7d,1h:5y
Graphite’s capabilities](https://image.slidesharecdn.com/mysql-performance-monitoring-130826072409-phpapp02/85/MySQL-Performance-Monitoring-17-320.jpg)
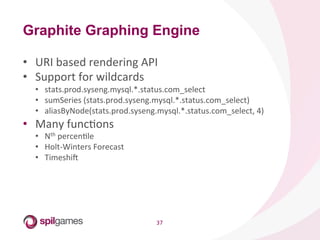
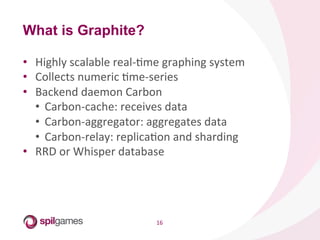
![38
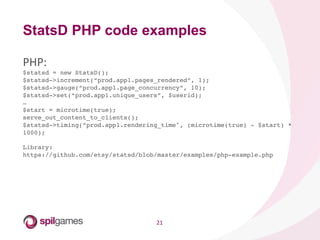
Graphite Aggregator
syseng => {!
nodes => [”databasehost1", ”databasehost2"],!
copying_relay_instances => 8,!
hashing_relay_instances => 8,!
cache_instances => 8,!
aggregation => {!
0 => {!
name => ”mysql",!
pattern => '.*.mysql..*',!
send_raw => 1,!
},!
}!
}!
!
!
stats.<env>.syseng.mysql.cluster1.status.questions.all (2) = !
!sum stats.<env>.syseng.mysql.*.status.questions!
!](https://image.slidesharecdn.com/mysql-performance-monitoring-130826072409-phpapp02/85/MySQL-Performance-Monitoring-38-320.jpg)