This document provides an introduction and overview of StatsD, including:
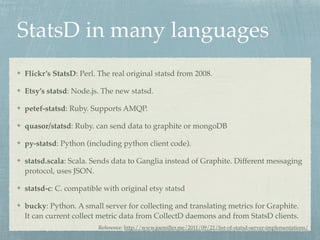
- A brief history of StatsD and how it was originally created by Flickr and implemented by Etsy.
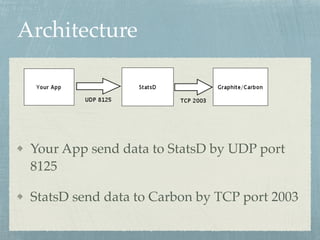
- An overview of the StatsD architecture which involves sending metrics from applications over UDP to the StatsD server, which then sends the data to Carbon over TCP.
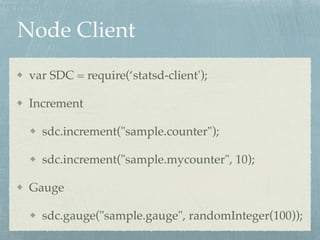
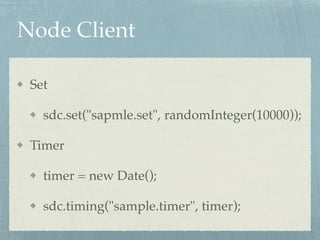
- An explanation of the different metric types StatsD supports - counters, gauges, sets, and timings - and examples of common use cases.
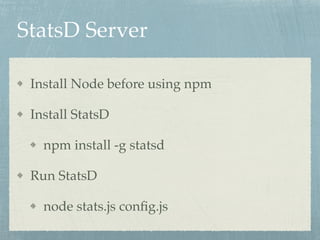
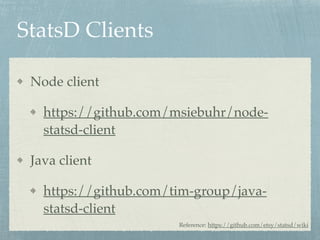
- Instructions for installing and running a StatsD server as well as examples of using StatsD clients in Node.js and Java applications.
Do you gather metrics from your application? Can you combine them and easily generate custom graphs out of them? Can your developers measure whatever they want at any point of your application without breaking it or making it slower?
In our next itnig friday, Víctor Martínez will show us how easy it is to roll on your own Graphite installation and how to use Etsy's statsd collector to flush your metrics. You will learn what Graphite is, how all of its components work, how to get your real time&historic metrics into Carbon, Graphite's database, and how to plot them in different manners. Víctor will show us some Graphite dashboards, alternative statds implementations, detailed common Graphite configuration gotchas, design limitations and how to deal with them.
<a>Visit details</a>
MySQL performance monitoring using Statsd and Graphite (PLUK2013)spil-engineering
MySQL performance monitoring using Statsd and Graphite (PLUK2013)
Note: this is a placeholder for the presentation next Tuesday at the Percona Live London
Initially presented at OpenWest 2014 conference.
Graphite and StatsD gather line series data and offer a robust set of APIs to access that data. While the tools are robust, the dashboards are straight from 1992 and alerting off the data is nonexistent. Nark, an opensource project, solves both of these problems. It provides easy to use dashboards and readily available alerts and notifications to users. It has been used in production at Lucid Software for almost a year. Related to Nark are the tools required to make Graphite highly available.
How to measure everything - a million metrics per second with minimal develop...Jos Boumans
Krux is an infrastructure provider for many of the websites you
use online today, like NYTimes.com, WSJ.com, Wikia and NBCU. For
every request on those properties, Krux will get one or more as
well. We grew from zero traffic to several billion requests per
day in the span of 2 years, and we did so exclusively in AWS.
To make the right decisions in such a volatile environment, we
knew that data is everything; without it, you can't possibly make
informed decisions. However, collecting it efficiently, at scale,
at minimal cost and without burdening developers is a tremendous
challenge.
Join me in this session to learn how we overcame this challenge
at Krux; I will share with you the details of how we set up our
global infrastructure, entirely managed by Puppet, to capture over
a million data points every second on virtually every part of the
system, including inside the web server, user apps and Puppet itself,
for under $2000/month using off the shelf Open Source software and
some code we've released as Open Source ourselves. In addition, I’ll
show you how you can take (a subset of) these metrics and send them
to advanced analytics and alerting tools like Circonus or Zabbix.
This content will be applicable for anyone collecting or desiring to
collect vast amounts of metrics in a cloud or datacenter setting and
making sense of them.
InfluxDB IOx Tech Talks: A Rusty Introduction to Apache Arrow and How it App...InfluxData
InfluxDB IOx Tech Talks - December 2020
A Rusty Introduction to Apache Arrow and How it Applies to a Time Series Database
This session will start with a tech talk from an InfluxDB IOx team member. This is your chance to interact directly with Influxers who are available to answer your questions about all things InfluxDB IOx and time series — including Paul Dix, Founder and CTO of InfluxData. This event will last about an hour and there will be time for live Q&A.
Meet the Experts: Visualize Your Time-Stamped Data Using the React-Based Gira...InfluxData
Giraffe is the open source React-based visualization library that powers data visualizations in the InfluxDB 2.0 UI. Giraffe can be used to display your data within your own app and is Fluxlang-supported! It uses algorithms to handle visualizing high volumes of time series data that InfluxDB can ingest and query.
Kristina Robinson, the engineering manager for the Giraffe team at InfluxData, will dive into:
The basics of using the Giraffe library including how to query your data with Flux
Specific Giraffe visualization types for dashboards (e.g. single number, table and graph)
How to incorporate visualizations in your own custom apps
Business Dashboards using Bonobo ETL, Grafana and Apache AirflowRomain Dorgueil
Zero-to-one hands-on introduction to building a business dashboard using Bonobo ETL, Apache Airflow, and a bit of Grafana (because graphs are cool). The talk is based on the early version of our tools to visualize apercite.fr website. Plan, Implementation, Visualization, Monitoring and Iterate from there.
Creating and Using the Flux SQL Datasource | Katy Farmer | InfluxData InfluxData
This talk introduces the SQL data source for Flux. It will start with examples of using data from MySQL or Postgres with time series data from InfluxDB. It will then go over the details of how the SQL data source was created.
Graphite is often regarded as very slow and not easily scalable. As a data driven company, we couldn't give up the statistical functions of Graphite. In this talk we show how SimilarWeb scaled its graphite stack to meet the demand.
This presentation was inspired post read of "TimeSeries Databases" -- Ted Dunning & Ellen Friedman.
I have tried to summarize a lot of the previous bench marks. Hope others find it useful. The slides were compiled early 2015 so some of the results might have changed but the core literature should still hold.
Kenneth Knowles - Apache Beam - A Unified Model for Batch and Streaming Data...Flink Forward
http://flink-forward.org/kb_sessions/apache-beam-a-unified-model-for-batch-and-streaming-data-processing/
Unbounded, unordered, global-scale datasets are increasingly common in day-to-day business, and consumers of these datasets have detailed requirements for latency, cost, and completeness. Apache Beam (incubating) defines a new data processing programming model that evolved from more than a decade of experience within Google, including MapReduce, FlumeJava, MillWheel, and Cloud Dataflow. Beam handles both batch and streaming use cases and neatly separates properties of the data from runtime characteristics, allowing pipelines to be portable across multiple runtimes, both open-source (e.g., Apache Flink, Apache Spark, et al.) and proprietary (e.g., Google Cloud Dataflow). This talk will cover the basics of Apache Beam, touch on its evolution, describe main concepts in the programming model, and compare with similar systems. We’ll go from a simple scenario to a relatively complex data processing pipeline, and finally demonstrate execution of that pipeline on multiple runtimes.
Stream Processing Live Traffic Data with Kafka StreamsTim Ysewyn
In this workshop we will set up a streaming framework which will process realtime data of traffic sensors installed within the Belgian road system.
Starting with the intake of the data, you will learn best practices and the recommended approach to split the information into events in a way that won't come back to haunt you.
With some basic stream operations (count, filter, ... ) you will get to know the data and experience how easy it is to get things done with Spring Boot & Spring Cloud Stream.
But since simple data processing is not enough to fulfill all your streaming needs, we will also let you experience the power of windows. After this workshop, tumbling, sliding and session windows hold no more mysteries and you will be a true streaming wizard.
Storm is a distributed realtime computation system. Similar to how Hadoop provides a set of general primitives for doing batch processing, Storm provides a set of general primitives for doing realtime computation.
Storm often coexists in Big Data architectures with Hadoop. We will talk about different approaches to this interoperability between the systems, their benefits & trade-offs, and a new open source library available for high throughput use.
How we reduced our Hadoop batch processing time from 6 hours to 1 minute by implementing a Lambda Architecture with the addition of Storm and Twitter's SummingBird during our internal hackathon.
Storm is a distributed realtime computation system. Similar to how Hadoop provides a set of general primitives for doing batch processing, Storm provides a set of general primitives for doing realtime computation. Storm is simple, can be used with any programming language, and is a lot of fun to use!
Presto talk @ Global AI conference 2018 Bostonkbajda
Presented at Global AI Conference in Boston 2018:
http://www.globalbigdataconference.com/boston/global-artificial-intelligence-conference-106/speaker-details/kamil-bajda-pawlikowski-62952.html
Presto, an open source distributed SQL engine, is widely recognized for its low-latency queries, high concurrency, and native ability to query multiple data sources. Proven at scale in a variety of use cases at Facebook, Airbnb, Netflix, Uber, Twitter, LinkedIn, Bloomberg, and FINRA, Presto experienced an unprecedented growth in popularity in both on-premises and cloud deployments in the last few years. Presto is really a SQL-on-Anything engine in a single query can access data from Hadoop, S3-compatible object stores, RDBMS, NoSQL and custom data stores. This talk will cover some of the best use cases for Presto, recent advancements in the project such as Cost-Based Optimizer and Geospatial functions as well as discuss the roadmap going forward.
Analyzing 2TB of Raw Trace Data from a Manufacturing Process: A First Use Cas...Databricks
As the development of semiconductor devices, manufacturing system leads to improve productivity and efficiency for wafer fabrication. Owing to such improvement, the number of wafers yielded from the fabrication process has been rapidly increasing. However, current software systems for semiconductor wafers are not aimed at processing large number of wafers. To resolve this issue, the BISTel (a world-class provider of manufacturing intelligence solutions and services for manufacturers) tries to build several products for big data such as Trace Analyzer (TA) and Map Analyzer (MA) using Apache Spark. TA is to analyze raw trace data from a manufacturing process. It captures details on all variable changes, big and small and give the traces' statistical summary (i.e.: min, max, slope, average, etc.). Several BISTel's customers, which are the top-tier semiconductor company in the world use the TA to analyze the massive raw trace data from their manufacturing process. Especially, TA is able to manage terabytes of data by applying Apache Spark's APIs. MA is an advanced pattern recognition tool that sorts wafer yield maps and automatically identify common yield loss patterns. Also, some semiconductor companies use MA to identify clustering patterns for more than 100,000 wafers, which can be considered as big data in the semiconductor area. This talk will introduce these two products which are developed based on the Apache Spark and present how to handle the large-scale semiconductor data in the aspects of software techniques.
Speakers: Seungchul Lee, Daeyoung Kim
Best practices for monitoring your IT infrastructure using StatsD. Find dashboard examples here: https://p.datadoghq.com/sb/9b246c4ade
Monitor StatsD easily with Datadog. Learn more at https://www.datadoghq.com
This slide show is from my presentation on what JSON and REST are. It aims to provide a number of talking points by comparing apples and oranges (JSON vs. XML and REST vs. web services).
This is a talk I gave to the late crew at the DevOps KC meetup outlining why/what/how of setting up a Graphite server using Python end-to-end for getting stats.
Spark Streaming is an extension of the core Spark API that enables continuous data stream processing. It is particularly useful when data needs to be processed in real-time. Carol McDonald, HBase Hadoop Instructor at MapR, will cover:
+ What is Spark Streaming and what is it used for?
+ How does Spark Streaming work?
+ Example code to read, process, and write the processed data
Machine Learning with H2O, Spark, and Python at Strata 2015Sri Ambati
Machine Learning with H2O, Spark, and Python at Strata SJ 2015-by Cliff Click and Michal Malohlava
- Powered by the open source machine learning software H2O.ai. Contributors welcome at: https://github.com/h2oai
- To view videos on H2O open source machine learning software, go to: https://www.youtube.com/user/0xdata
Michael DeSa will go over some of the advanced topics in Kapacitor such as joins, templated tasks, and debugging your tasks. Prerequisite: Intro To Kapacitor.
A detailed overview of Kapacitor, InfluxDB’s native data processing engine. How to install, configure and build custom TICKscripts enable alerting and anomaly detection
Lightning Fast Analytics with Cassandra and SparkTim Vincent
Presentation on the integration of Apache Cassandra with Apache Spark to deliver near real-time analytics against operational data in your Cassandra distributed database
Porting a Streaming Pipeline from Scala to RustEvan Chan
How we at Conviva ported a streaming data pipeline in months from Scala to Rust. What are the important human and technical factors in our port, and what did we learn?
Use C++ and Intel® Threading Building Blocks (Intel® TBB) for Hardware Progra...Intel® Software
In this presentation, we focus on an alternative approach that uses nodes that contain Intel® Xeon® processors and Intel® Xeon Phi™ coprocessors. Programming models and the development tools are identical for these resources, greatly simplifying development. We discuss how the same models for vectorization and threading can be used across these compute resources to create software that performs well on them. We further propose an extension to the Intel® Threading Building Blocks (Intel® TBB) flow graph interface that enables intra-node distributed memory programming, simplifying communication, and load balancing between the processors and coprocessors. Finally, we validate this approach by presenting a benchmark of a risk analysis implementation that achieves record-setting performance.
This presentation includes a comprehensive introduction to Apache Spark. From an explanation of its rapid ascent to performance and developer advantages over MapReduce. We also explore its built-in functionality for application types involving streaming, machine learning, and Extract, Transform and Load (ETL).
Beautiful Monitoring With Grafana and InfluxDBleesjensen
Query your data streams with the time series database InfluxDB and then visualize the results with stunning Grafana dashboards. Quick and easy to set up. Fully scalable to millions of metrics per second.
How can we visualize data in machine learning with VS Code? This is a C# wrapper for the GraphViz graph generator for dotnet core. Further bindings for Python GraphViz are shown and exports to MS Power BI all in MS Visual Code, Jupyter and dotnet core.
Your Timestamps Deserve Better than a Generic Databasejavier ramirez
If you are storing records with a timestamp in your database, it is very likely a time series database can make your life easier.
However, time series databases are still the great unknown for a large part of the tech community.
In this talk, I will show you what use cases they are good for, what they give you that you cannot get from a traditional database, and when it is a good idea (and when it is not) to use them.
For the demos, we will be using QuestDB, the fastest open-source time series database.
Presenting 3 real-life use cases of Apache Beam in production. Code reusability for bounded and unbounded data as well as running Apache Beam to write into different cloud providers are some of the aspects that will be treated in this presentation.
Instrumenting and Scaling Databases with EnvoyDaniel Hochman
Every request to a database at Lyft is proxied by Envoy, providing complete visibility into the L3/L4 aspects of database interactions. This allows engineers to easily visualize changes to a database's load profile and pinpoint the root cause if necessary. Lyft has also open-sourced codecs for MongoDB, DynamoDB, and Redis. Protocol codecs in combination with custom filters yield benefits ranging from operation-level observability to horizontal scalability via sharding. Using Envoy for this purpose means that enhancements are implemented once and usable across a polyglot stack. The talk demonstrates Envoy's utility beyond traditional RPC service interactions in the network.
Introduction to WSO2 Data Analytics PlatformSrinath Perera
WSO2 have had several analytics products: WSO2 BAM and WSO2 CEP for some time (or Big Data products if you prefer the term). We are added WSO2 Machine Learner, a product to create, evaluate, and deploy predictive models and renamed WSO2 BAM to WSO2 DAS ( Data Analytics Server).
The platform let you publish ( collect data) once and process them through batch ( Spark) , realtime ( CEP), search the data ( Lucene) and build machine learning models.
This post describes how all those fit within to a single story.
For more information, see https://iwringer.wordpress.com/2015/03/18/introducing-wso2-analytics-platform-note-for-architects/
MC INTERNATIONALS | TRAVEL COMPANY IN JHANGAshBhatt4
Experience the world with MC Internationals travel and tourism. From foreign getways to cultural concentration, we tailor unforgettable journeys for every traveler. Let us turn your dream into reality and create lasting memories. Explore with us today. #TRAVEL,COMPANY #BEST,TRAVEL,COMPANY #VISIT,VISA #EMPLOYMENT,VISA #STUDY,VISA #HAJJ,AND,UMRAH
How To Talk To a Live Person at American Airlinesflyn goo
This page by FlynGoo can become your ultimate guide to connecting with a live person at American Airlines. Have you ever felt lost in the automated maze of customer service menus? FlynGoo is here to rescue you from endless phone trees and automated responses. With just a click or a call to a specific number, we ensure you get the human touch you deserve. No more frustration, no more waiting on hold - we simplify the process, making your travel experience smoother and more enjoyable.
Discover the wonders of the Wenatchee River with a variety of river tours in Monitor, WA. Whether you're seeking thrilling whitewater rafting, peaceful kayaking, family-friendly float trips, or scenic sunset cruises, there's something for everyone. Enjoy fishing, wildlife spotting, bird watching, and more in this beautiful natural setting, perfect for outdoor enthusiasts and families alike.
Discover Palmer, Puerto Rico, through an immersive cultural tour that unveils its rich history and vibrant traditions. Experience lively festivals, savor authentic cuisine, and explore local markets. Visit historical landmarks, museums, and stunning colonial architecture. Engage with friendly locals, enjoy live music, and hike scenic nature trails, all while participating in cultural workshops and discovering unique artisan crafts.
How To Change Name On Volaris Ticket.pdfnamechange763
How to change name on Volaris ticket? This is one of the most common questions asked by travelers flying with Volaris Airlines. The mentioned details can help you with your name rectification on the airline ticket. If you are still facing difficulties call the consolidation desk at +1-800-865-1848.
The Cherry Blossom season in Hunza begins in the second week of March and lasts until the end of April, varying with altitude. During this enchanting period, tourists from around the world flock to Hunza Valley to witness its transformation into a vibrant tapestry of white, pink, and green. The valley comes alive with cherry blossoms, creating a picturesque and mesmerizing landscape that captivates visitors.
About the Company:
The Cherry Blossom season in Hunza starts in the second week of March and extends until the end of April, depending on the altitude. During this enchanting period, tourists from around the globe travel to Hunza Valley to witness its transformation into a vibrant tapestry of white, pink, and green. The valley comes alive with cherry blossoms, creating a picturesque and mesmerizing landscape that captivates all who visit. For the best experience, join Hunza Adventure Tours, the top tour company in Pakistan, and immerse yourself in this breathtaking seasonal spectacle.
During the coldest months, Italy transforms into a winter wonderland, providing visitors with a very unique experience. From the Settimana Bianca ski event to the lively Carnevale celebrations, Italy's winter festivities provide something for everyone. Enjoy hot cocoa, eat hearty comfort foods, and buy during winter deals. Explore the country's rich cultural past by participating in Settimana Bianca, and Carnevale, sipping hot chocolate, shopping during winter deals, and indulging in winter comfort foods. Visit our website https://timeforsicily.com/ for more information.
Antarctica- Icy wilderness of extremes and wondertahreemzahra82
In this presentation, we delve into the captivating realm of Antarctica, Earth's southernmost continent. This icy wilderness stands as a testament to extremes, with record-breaking cold temperatures and vast expanses of pristine ice. Antarctica's landscape is dominated by towering glaciers, colossal icebergs, and expansive ice shelves. Yet, amidst this frozen expanse, a rich tapestry of unique wildlife thrives, including penguins, seals, and seabirds, all finely attuned to survive in this harsh environment. Beyond its natural wonders, Antarctica also serves as a vital hub for scientific exploration, providing invaluable insights into climate change and the Earth's history
The Power of a Glamping Go-To-Market Accelerator Plan.pptxRezStream
Unlock the secrets to success with our comprehensive 8-Step Glamping Accelerator Go-To-Market Plan! Watch our FREE webinar, where you'll receive expert guidance and invaluable insights on every aspect of launching and growing your glamping business.
BTW UK Visa Application Process, Uk Visa complete guide, Uk Visa fees, requirements and application process. Know all about uk visa and best way to apply for the uk visa. Get to know about the requirements that allows you for the faster visa appliaction. BTW UK Visa Application Process, Uk Visa complete guide, Uk Visa fees, requirements and application process. Know all about uk visa and best way to apply for the uk visa. Get to know about the requirements that allows you for the faster visa appliaction. BTW UK Visa Application Process, Uk Visa complete guide, Uk Visa fees, requirements and application process. Know all about uk visa and best way to apply for the uk visa. Get to know about the requirements that allows you for the faster visa appliaction. BTW UK Visa Application Process, Uk Visa complete guide, Uk Visa fees, requirements and application process. Know all about uk visa and best way to apply for the uk visa. Get to know about the requirements that allows you for the faster visa appliaction. BTW UK Visa Application Process, Uk Visa complete guide, Uk Visa fees, requirements and application process. Know all about uk visa and best way to apply for the uk visa. Get to know about the requirements that allows you for the faster visa appliaction. BTW UK Visa Application Process, Uk Visa complete guide, Uk Visa fees, requirements and application process. Know all about uk visa and best way to apply for the uk visa. Get to know about the requirements that allows you for the faster visa appliaction. BTW UK Visa Application Process, Uk Visa complete guide, Uk Visa fees, requirements and application process. Know all about uk visa and best way to apply for the uk visa. Get to know about the requirements that allows you for the faster visa appliaction. BTW UK Visa Application Process, Uk Visa complete guide, Uk Visa fees, requirements and application process. Know all about uk visa and best way to apply for the uk visa. Get to know about the requirements that allows you for the faster visa appliaction. Get information in this PDF and simplyfy your visa process.
Exploring Montreal's Artistic Heritage Top Art Galleries and Museums to VisitSpade & Palacio Tours
Montreal boasts a vibrant artistic heritage, showcased in its top art galleries and museums. From the expansive collections at the Montreal Museum of Fine Arts to the cutting-edge exhibits at the Musée d'art contemporain, discover the city's rich cultural landscape. Experience dynamic street art, indigenous works, and contemporary pieces, reflecting Montreal's diverse and innovative art scene.
4 DAYS MASAI MARA WILDEBEEST MIGRATION SAFARI TOUR PACKAGE KENYABush Troop Safari
Join our 4-day Masai Mara Wildebeest Migration Safari in Kenya. Witness the incredible wildebeest migration, enjoy exciting game drives, and stay in comfortable lodges. Get up close and personal with one of nature's most amazing exhibits! Book Your Safari Today at - https://bushtroop-safaris.com/
LUXURY TRAVEL THE ULTIMATE TOKYO EXPERIENCE FROM SINGAPORE.pdfDiper Tour
Get off on the most luxurious Tokyo itinerary from Singapore. Experience Tokyo’s sophisticated modernism and rich tradition with first-class travel, sumptuous lodging, fine food, and special tours. Savor the finest that this energetic city has to offer for an experience that will never be forgotten.
Its running cost is among the diverse vital aspects you must consider before buying an electric scooter. Calculate the cost of getting e-scooter charge for your regular usage to calculate its economic efficiency, similar to people who investigate the mileage of petrol or diesel-driven scooters.
London Country Tours, the foremost travel partner offers customized Stonehenge tours from London coming with private tour guides and direct access to the inner circles. Visit: https://www.londoncountrytours.co.uk/tour/tours-to-stonehenge-oxford/
3. History
StatsD is a front-end proxy for the Graphite/
Carbon metrics server.!
Originally written by Etsy’s Erik Kastner!
The first idea from Flickr by Cal Henderson!
Implemented in Node
4. StatsD in many languages
Flickr’s StatsD: Perl. The real original statsd from 2008.!
Etsy’s statsd: Node.js. The new statsd.!
petef-statsd: Ruby. Supports AMQP.!
quasor/statsd: Ruby. can send data to graphite or mongoDB!
py-statsd: Python (including python client code).!
statsd.scala: Scala. Sends data to Ganglia instead of Graphite. Different messaging
protocol, uses JSON.!
statsd-c: C. compatible with original etsy statsd!
bucky: Python. A small server for collecting and translating metrics for Graphite.
It can current collect metric data from CollectD daemons and from StatsD clients.
Reference: http://www.joemiller.me/2011/09/21/list-of-statsd-server-implementations/
5. Architecture
Your App send data to StatsD by UDP port
8125!
StatsD send data to Carbon by TCP port 2003
6. Metric Types
Count [key]:[value]|c!
sample.counter:1|c!
At each flush the current count is sent and reset to 0!
Sampling!
sample.counter:1|c@0.1!
sent sampled every 1/10th of the time!
Scenarios!
View count
Reference: https://github.com/etsy/statsd/blob/master/docs/metric_types.md
7. Metric Types
Gauge [key]:[value]|g!
sample.gauge:75|g!
If the gauge is not updated at the next flush,
it will send the previous value.!
Scenarios!
Resource number
8. Metric Types
Set [key]:[value]|s!
sapmle.set:4219|s!
Counting unique occurrences of events between
flushes, using a Set to store all occurring events.!
Scenarios!
Unique user count
9. Metric Types
Timing [key]:[value]|ms!
sample.timer:10000|ms!
Scenarios!
To calculate the difference time!
Response time calculation
19. Further Items
StatsD Cluster Proxy!
Refactor 3DS FrontServer!
Collect response time during component
communication!
Collect data from GPS (Windows)