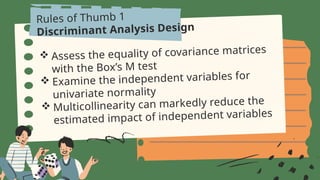
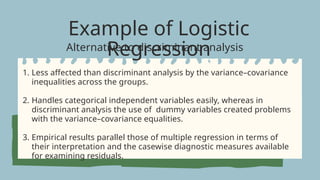
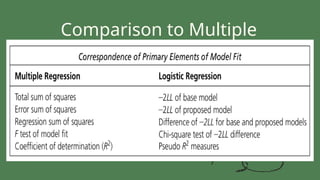
PEM 300
(Advanced Statistics)
FLORHEN B. DE LEON-BARA
Multivariate Data
Analysis
Lesson Outline
• Multiple Discriminant
Analysis
• Logistic Regression:
Regression with a Binary
Dependent Variable
Multiple regression is
widely used
multivariate
dependence technique.
its ability to predict and
explain metric
variables
Multiple
Discriminant
Analysis
to identify the
group to which
an object
belongs
Discriminant Analysis
Purpose:
To estimate the relationship
between single nonmetric
(categorical) dependent
variable and metric
independent variables
Y1 = X1 + X2 + X3 + …+Xn
(Metric)
(Nonmetric)
Metric Variable
Variable with constant unit of
measurement
Nonmetric Variable
Variable with values as label or
means of identification
• Categorical, qualitative,
nominal, binary
Male Female
Yes No
Logistic Regression is
where dependent
variable is nonmetric
and limited to binary
dependent variables
Yes No
Discriminant Analysis
Analysis involves deriving a variate
Capable of handling either two groups or multiple (three or more)
groups.
Two Classification
– two-group
discriminant
analysis
When 3 or more
classifications,
Multiple discriminant
analysis (MDA)
Zjk = a + W1X1k + W2X2k + . . . WnXnk
Discriminant function
Known as the variate of discriminant analysis.
Has equation like multiple regression:
= Discriminant Z score of discriminant function j for object k
= Discriminant weight for independent variable i
= intercept
Zjk
a
Wi
Xik = independent variable i for object k
 Dependent variable must be nonmetric
 Minimize the number of categories
 In converting metric variables to
nonmetric scale, use extreme groups to
maximize the group differences
Rules of Thumb 1
Discriminant Analysis Design
 Independent variable must identify
differences at least 2 groups
 Sample size must
 At least 1 observation per group, 20
cases/ group
 Maximize number of observation/variable
w/min. ratio of 5 observations
Rules of Thumb 1
Discriminant Analysis Design
 Assess the equality of covariance matrices
with the Box’s M test
 Examine the independent variables for
univariate normality
 Multicollinearity can markedly reduce the
estimated impact of independent variables
Rules of Thumb 1
Discriminant Analysis Design
Logistic
Regression:
Regression with a
Binary Dependent
Variable
relies strictly on assumptions
of multivariate normality and
equal
variance–covariance matrices
across groups
 does not face these strict
assumptions
 it is similar to multiple
regression
 two-group discriminant
analysis
Logistic Regression
Discriminant
analysis
Y1 = X1 + X2 + X3 + . . . Xn
Logistic Regression
Form of regression to predict and explain a binary (two-
group) categorical variable rather than metric dependent
measure.
(Binary
nonmetric) (nonmetric and metric)
 Method for two-group (binary)
dependent variable
 Sample size focused on the size of each
group (10x the n of est. model
coefficients)
 Model sig. test made w/ chi-square test
Rules of Thumb 1
Logistic
Regression
 Coefficient are expressed in: original and
exponentiated
 Interpretation of coefficients
 Direction – directly or indirectly in
exponentiated coefficient
 Magnitude – assessed by
exponentiated coefficient
Rules of Thumb 1
Logistic
Regression
Example of Logistic
Regression
1. Less affected than discriminant analysis by the variance–covariance
inequalities across the groups.
2. Handles categorical independent variables easily, whereas in
discriminant analysis the use of dummy variables created problems
with the variance–covariance equalities.
3. Empirical results parallel those of multiple regression in terms of
their interpretation and the casewise diagnostic measures available
for examining residuals.
Alternative to discriminant analysis
Comparison to Multiple
Regression
Thank
You

multiple discriminant analysis-logistic regression.pptx

  • 1.
    PEM 300 (Advanced Statistics) FLORHENB. DE LEON-BARA Multivariate Data Analysis
  • 2.
    Lesson Outline • MultipleDiscriminant Analysis • Logistic Regression: Regression with a Binary Dependent Variable
  • 3.
    Multiple regression is widelyused multivariate dependence technique. its ability to predict and explain metric variables
  • 4.
  • 5.
    Discriminant Analysis Purpose: To estimatethe relationship between single nonmetric (categorical) dependent variable and metric independent variables Y1 = X1 + X2 + X3 + …+Xn (Metric) (Nonmetric)
  • 6.
    Metric Variable Variable withconstant unit of measurement Nonmetric Variable Variable with values as label or means of identification • Categorical, qualitative, nominal, binary Male Female Yes No
  • 7.
    Logistic Regression is wheredependent variable is nonmetric and limited to binary dependent variables Yes No
  • 8.
    Discriminant Analysis Analysis involvesderiving a variate Capable of handling either two groups or multiple (three or more) groups. Two Classification – two-group discriminant analysis When 3 or more classifications, Multiple discriminant analysis (MDA)
  • 9.
    Zjk = a+ W1X1k + W2X2k + . . . WnXnk Discriminant function Known as the variate of discriminant analysis. Has equation like multiple regression: = Discriminant Z score of discriminant function j for object k = Discriminant weight for independent variable i = intercept Zjk a Wi Xik = independent variable i for object k
  • 11.
     Dependent variablemust be nonmetric  Minimize the number of categories  In converting metric variables to nonmetric scale, use extreme groups to maximize the group differences Rules of Thumb 1 Discriminant Analysis Design
  • 12.
     Independent variablemust identify differences at least 2 groups  Sample size must  At least 1 observation per group, 20 cases/ group  Maximize number of observation/variable w/min. ratio of 5 observations Rules of Thumb 1 Discriminant Analysis Design
  • 13.
     Assess theequality of covariance matrices with the Box’s M test  Examine the independent variables for univariate normality  Multicollinearity can markedly reduce the estimated impact of independent variables Rules of Thumb 1 Discriminant Analysis Design
  • 14.
  • 15.
    relies strictly onassumptions of multivariate normality and equal variance–covariance matrices across groups  does not face these strict assumptions  it is similar to multiple regression  two-group discriminant analysis Logistic Regression Discriminant analysis
  • 16.
    Y1 = X1+ X2 + X3 + . . . Xn Logistic Regression Form of regression to predict and explain a binary (two- group) categorical variable rather than metric dependent measure. (Binary nonmetric) (nonmetric and metric)
  • 17.
     Method fortwo-group (binary) dependent variable  Sample size focused on the size of each group (10x the n of est. model coefficients)  Model sig. test made w/ chi-square test Rules of Thumb 1 Logistic Regression
  • 18.
     Coefficient areexpressed in: original and exponentiated  Interpretation of coefficients  Direction – directly or indirectly in exponentiated coefficient  Magnitude – assessed by exponentiated coefficient Rules of Thumb 1 Logistic Regression
  • 19.
    Example of Logistic Regression 1.Less affected than discriminant analysis by the variance–covariance inequalities across the groups. 2. Handles categorical independent variables easily, whereas in discriminant analysis the use of dummy variables created problems with the variance–covariance equalities. 3. Empirical results parallel those of multiple regression in terms of their interpretation and the casewise diagnostic measures available for examining residuals. Alternative to discriminant analysis
  • 20.
  • 21.

Editor's Notes

  • #3 Multiple regression is undoubtedly the most widely used multivariate dependence technique. The primary basis for the popularity of regression has been its ability to predict and explain metric variables. But what happens when nonmetric dependent variables make multiple regression unsuitable? This chapter introduces a technique—discriminant analysis—that addresses the situation of a nonmetric dependent variable.
  • #4 Multiple discriminant analysis has widespread application in situations in which the primary objective is to identify the group to which an object (e.g., person, firm, or product) belongs.
  • #5 The basic purpose of discriminant analysis is to estimate the relationship between a single nonmetric (categorical) dependent variable and a set of metric independent variables in this general form: Discriminant analysis is the appropriate statistical techniques when the dependent variable is a categorical (nominal or nonmetric) variable and the independent variables are metric variables.
  • #6 To apply discriminant analysis, the researcher first must specify which variables are to be independent measures and which variable is to be the dependent measure. In many instances we do not have the metric measure necessary for multiple regression. Instead, we are only able to ascertain whether someone is in a particular group (e.g., good or bad credit risk).
  • #7 A second technique—logistic regression—is also appropriate for handling research questions where the dependent variable is nonmetric. However, logistic regression is limited to those situations with binary dependent variables (e.g., Yes/No, Purchase/Nonpurchase, etc.). The reader is encouraged to review logistic regression, because it presents many useful features in terms of interpretation of the impacts of the independent variables.
  • #8 The discriminant variate is the linear combination of the two (or more) independent variables that will discriminate best between the objects (persons, firms, etc.) in the groups defined a priori.
  • #9 Discrimination is achieved by calculating the variate’s weights for each independent variable to maximize the differences between the groups (i.e., the between-group variance relative to the within-group variance).
  • #10 The top diagram represents the distributions of discriminant scores for a function that separates the groups well, showing minimal overlap (the shaded area) between the groups. The lower diagram shows the distributions of discriminant scores on a discriminant function that is a relatively poor discriminator between groups A and B. The shaded areas of overlap represent the instances where misclassifying objects from group A into group B, and vice versa, can occur.
  • #12 The sample size must be large enough to: • Have at least one more observation per group than the number of independent variables, but striving for at least 20 cases per group • Maximize the number of observations per variable, with a minimum ratio of five observations per independent variable • Have a large enough sample to divide it into estimation and holdout samples, each meeting the above requirements
  • #13 Assess the equality of covariance matrices with the Box’s M test, but apply a conservative significance level of .01 and become even more conservative as the analysis becomes more complex with a larger number of groups and/or independent variables • Examine the independent variables for univariate normality, because that is most direct remedy for ensuring both multivariate normality and equality of covariance matrices • Multicollinearity among the independent variables can markedly reduce the estimated impact of independent variables in the derived discriminant function(s), particularly if a stepwise estimation process is used
  • #14 Logistic regression is a specialized form of regression that is formulated to predict and explain a binary (two-group) categorical variable rather than a metric dependent measure. The form of the logistic regression variate is similar to the variate in multiple regression. The variate represents a single multivariate relationship, with regression-like coefficients indicating the relative impact of each predictor variable. The differences between logistic regression and discriminant analysis will become more apparent in our discussion of logistic regression’s unique characteristics. Yet many similarities also exist between the two methods. When the basic assumptions of both methods are met, they each give comparable predictive and classificatory results and employ similar diagnostic measures. Logistic regression, however, has the advantage of being less affected than discriminant analysis when the basic assumptions, particularly normality of the variables, are not met. It also can accommodate nonmetric variables through dummy-variable coding, just as regression can. Logistic Regression is limited, however, to prediction of only a two-group dependent measure.
  • #15 Discriminant analysis relies on strictly meeting the assumptions of multivariate normality and equal variance–covariance matrices across groups—assumptions that are not met in many situations Logistic Regression
  • #16 Logistic regression may be described as estimating the relationship between a single non metric (binary) dependent variable and a set of metric or nonmetric independent variables, in this general form: applications include predicting anything where the outcome is binary (e.g., Yes/No)
  • #19 Less affected than discriminant analysis by the variance–covariance inequalities across the groups, a basic assumption of discriminant analysis. Handles categorical independent variables easily, whereas in discriminant analysis the use of dummy variables created problems with the variance–covariance equalities. Empirical results parallel those of multiple regression in terms of their interpretation and the casewise diagnostic measures available for examining residuals.