Download as PDF, PPTX


![(:Agents)-[:ORCHESTRATED_IN]->( )](https://image.slidesharecdn.com/datadaytx-25-250128162507-e8084c5f/75/Multimodal-Graph-RAG-mmGraphRAG-Incorporating-Vision-in-Search-and-Analytics-16-2048.jpg)


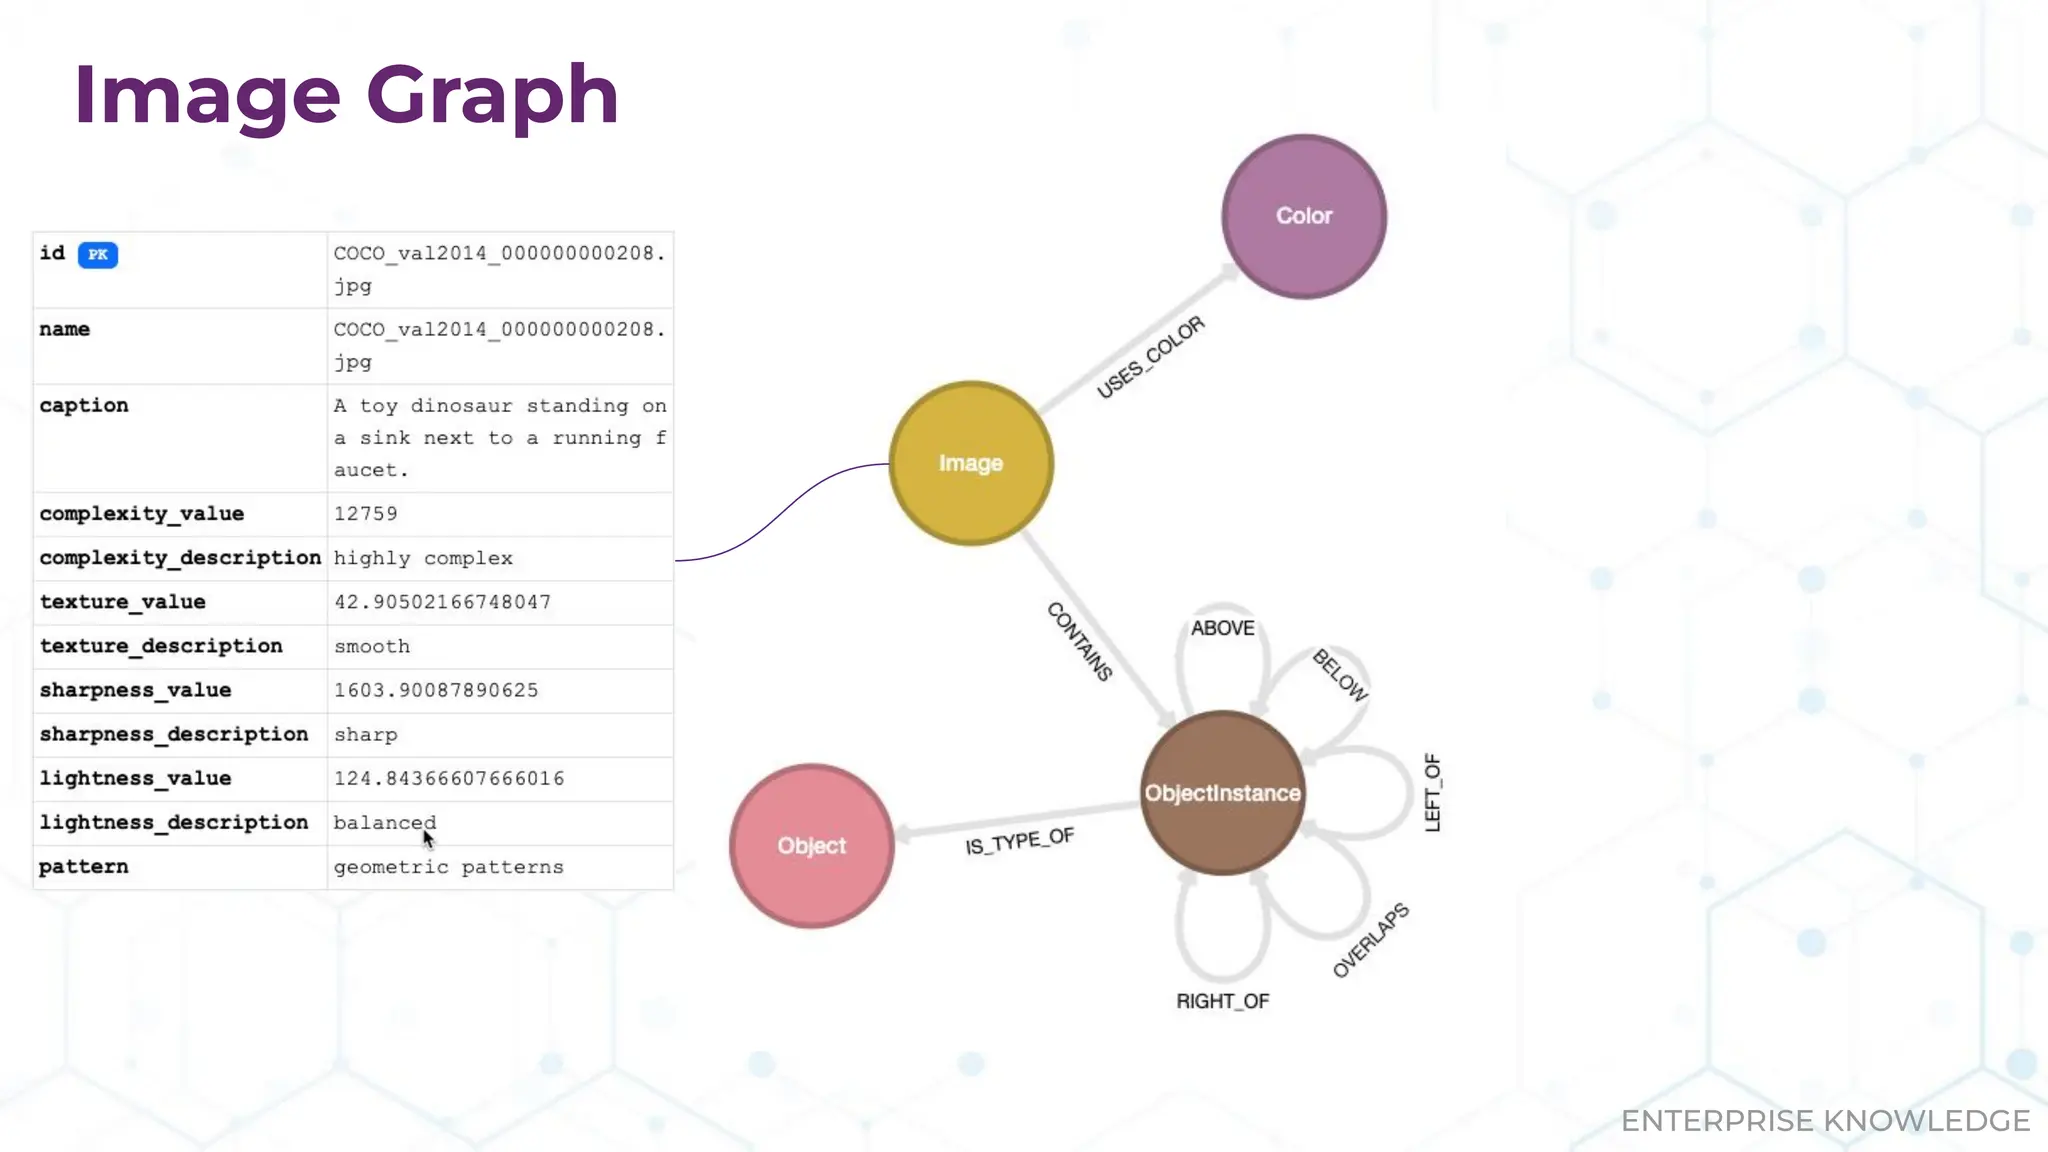

![ENTERPRISE KNOWLEDGE
Request & Agent Processing
{
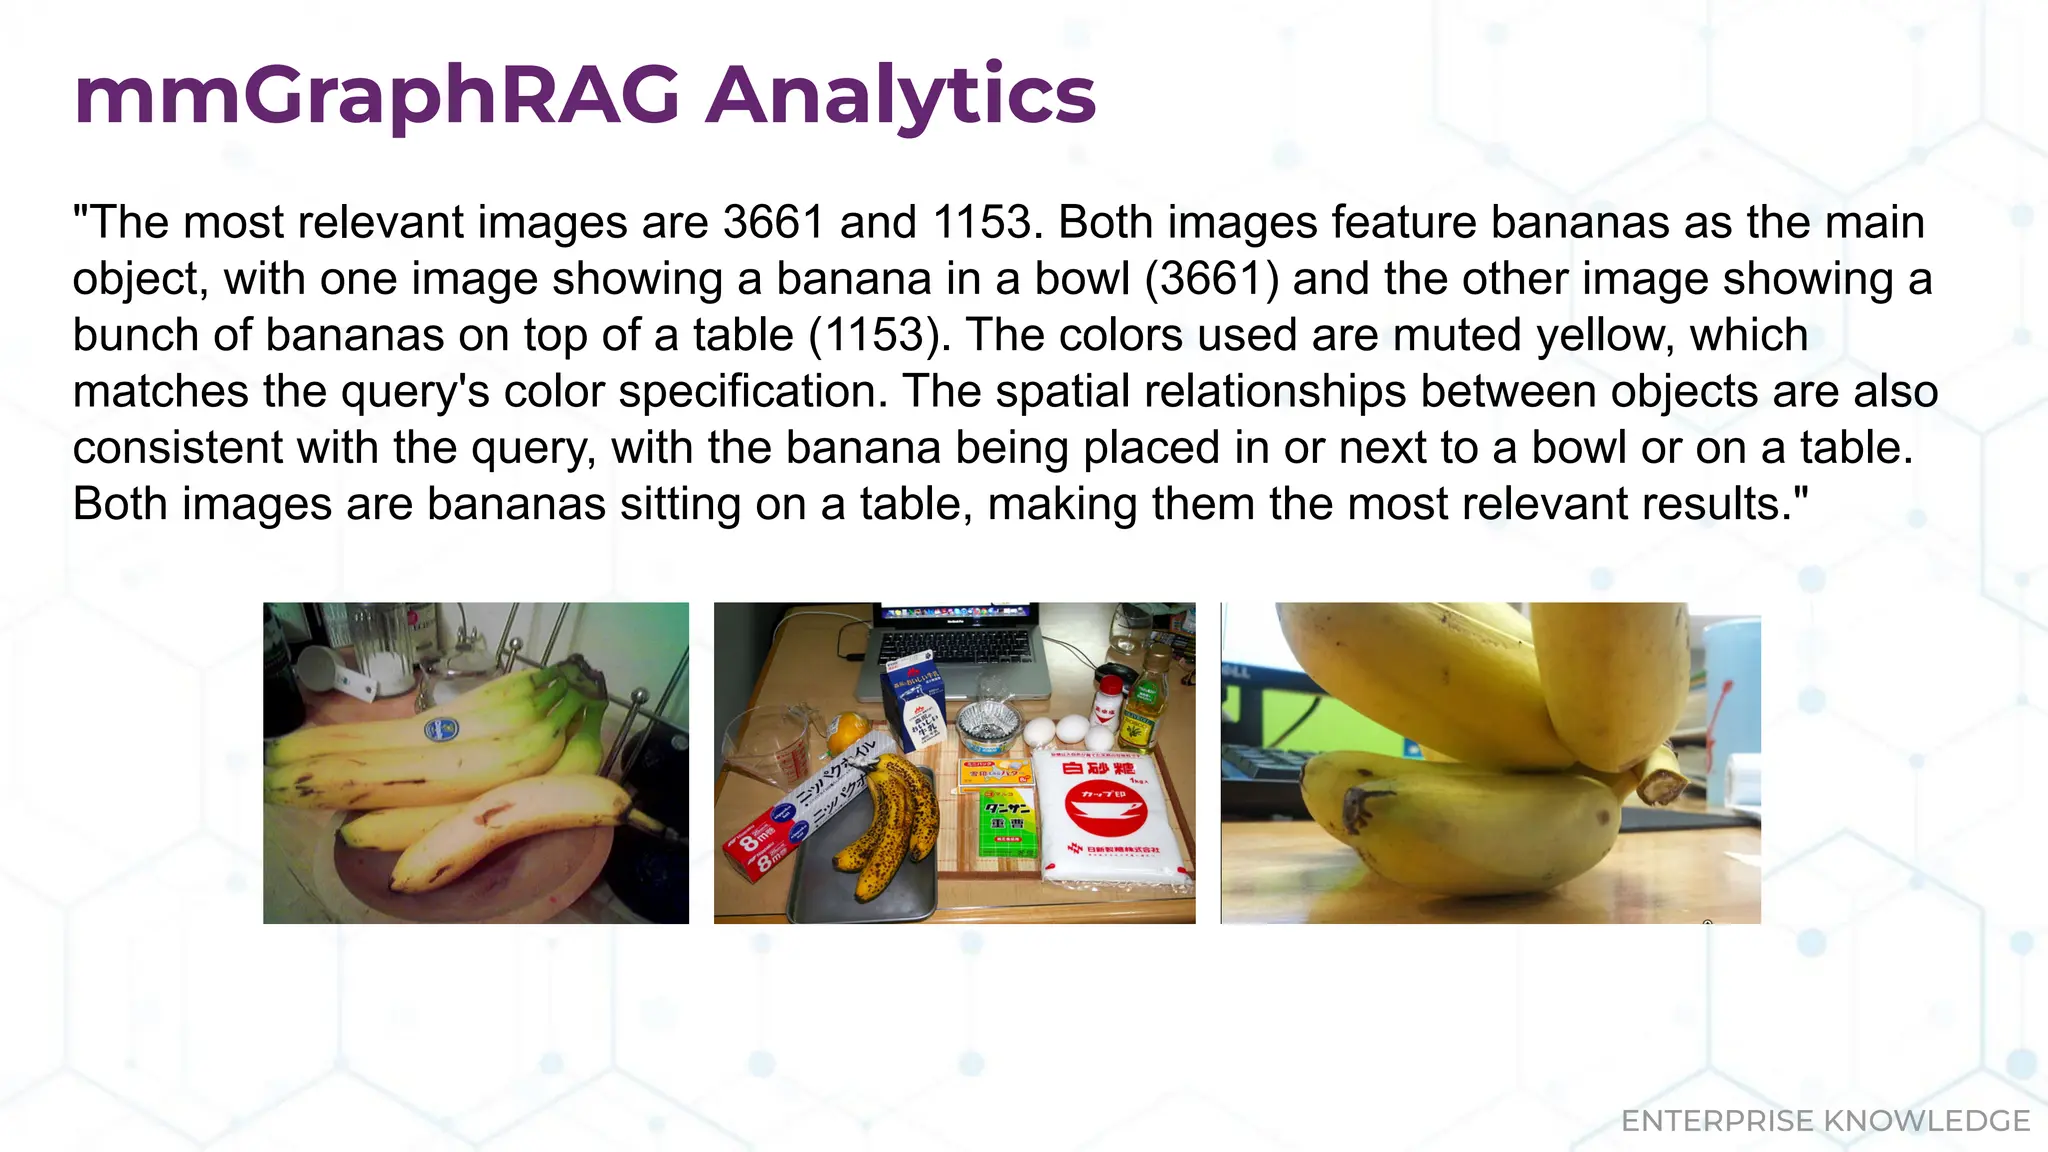
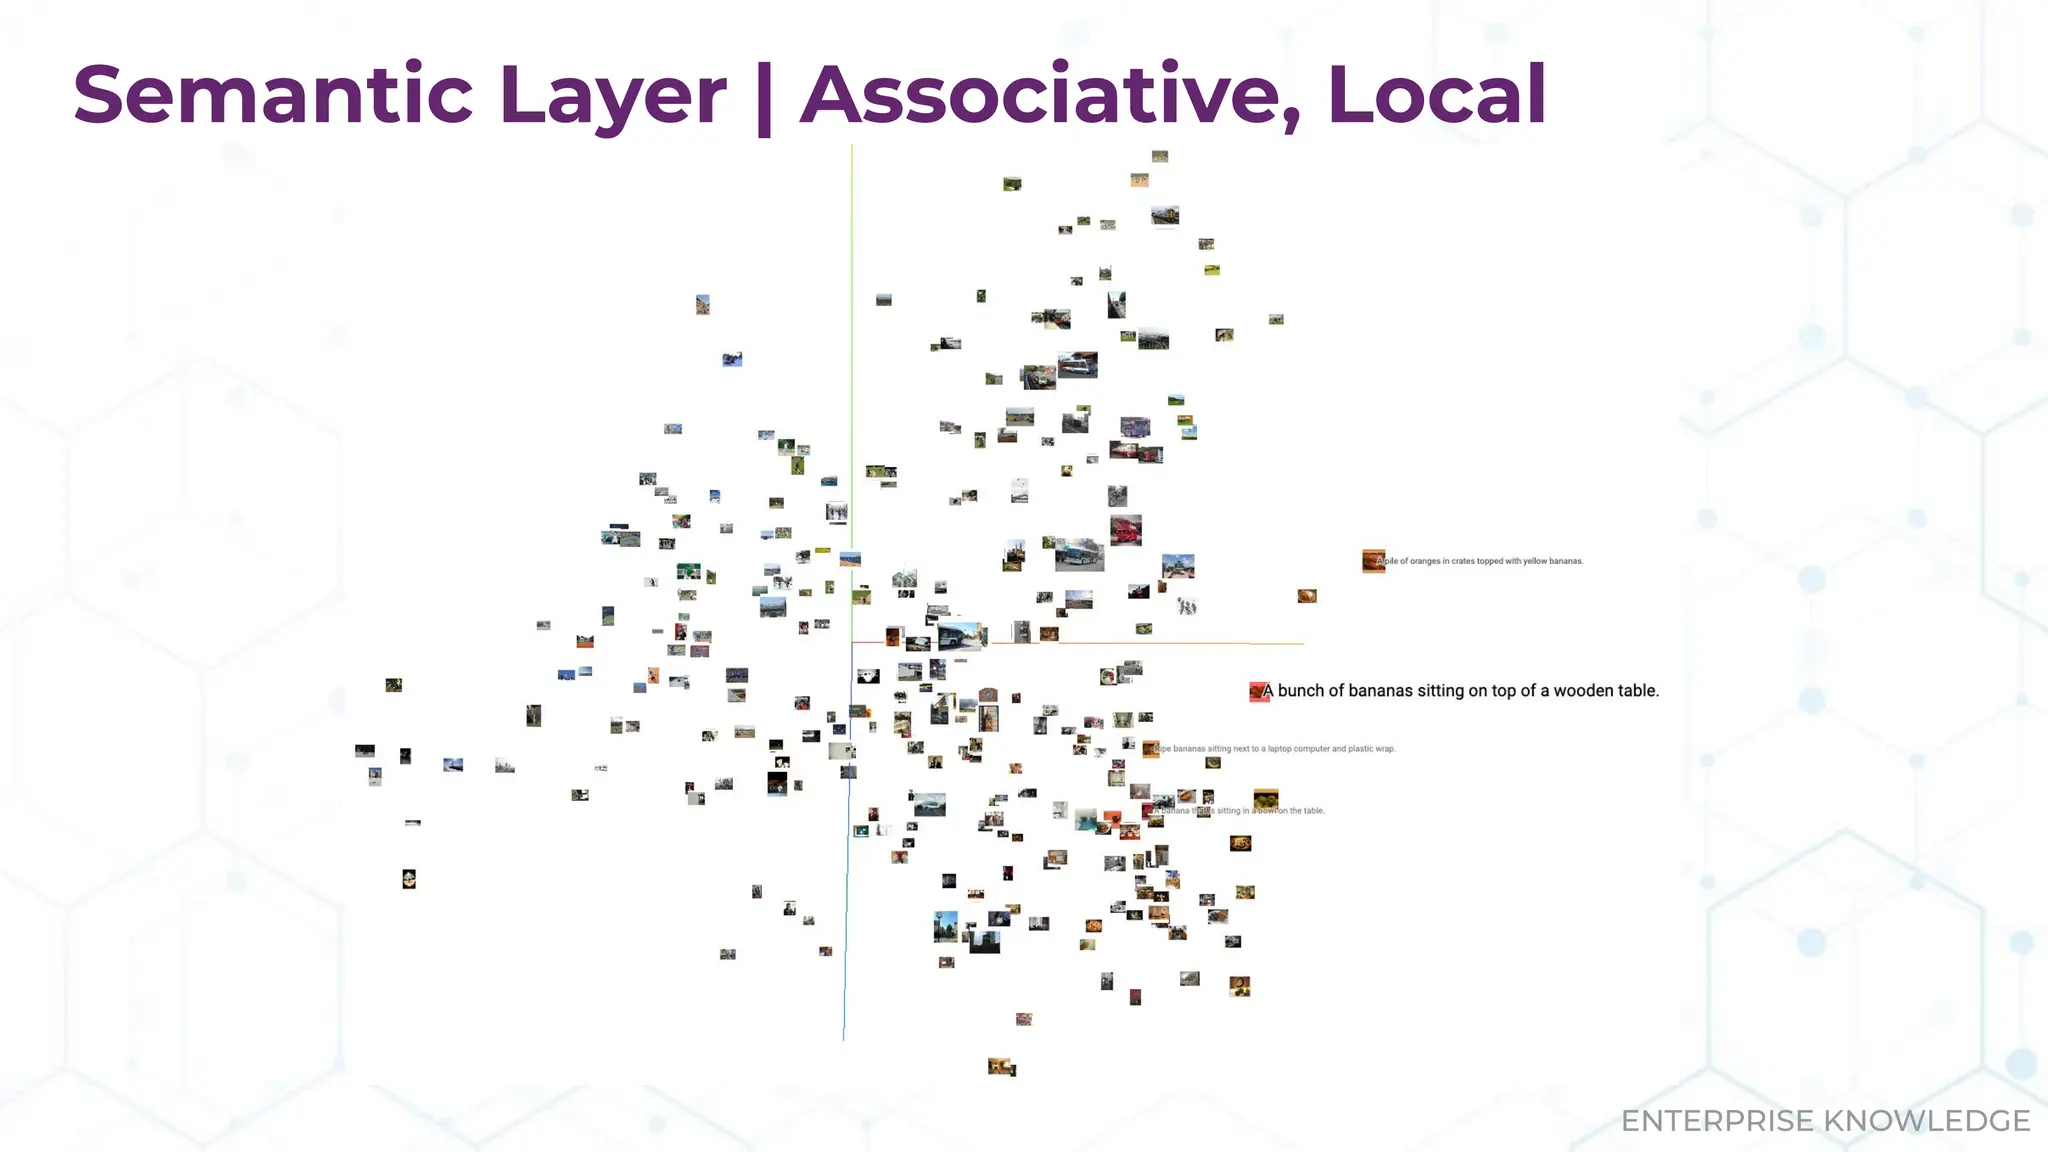
“request”:”Find images of bananas on a brown wooden table.”
"query_features": {
"objects": [
"bananas",
"table"
],
"colors": [
"brown"
],
"caption": "A bunch of bananas sitting on top of a brown wooden table."
}](https://image.slidesharecdn.com/datadaytx-25-250128162507-e8084c5f/75/Multimodal-Graph-RAG-mmGraphRAG-Incorporating-Vision-in-Search-and-Analytics-29-2048.jpg)
![ENTERPRISE KNOWLEDGE
Vector Similarity Search Results
"results": [
{
"name": "COCO_val2014_000000003661.jpg",
"similarity_score": 0.7162067890167236,
"objects": [
"banana"
],
"colors": [
"dark, vivid yellow"
],
"caption": "A bunch of bananas sitting on top of a wooden table.",
"complexity": "unknown",
"pattern": "none"
}](https://image.slidesharecdn.com/datadaytx-25-250128162507-e8084c5f/75/Multimodal-Graph-RAG-mmGraphRAG-Incorporating-Vision-in-Search-and-Analytics-30-2048.jpg)
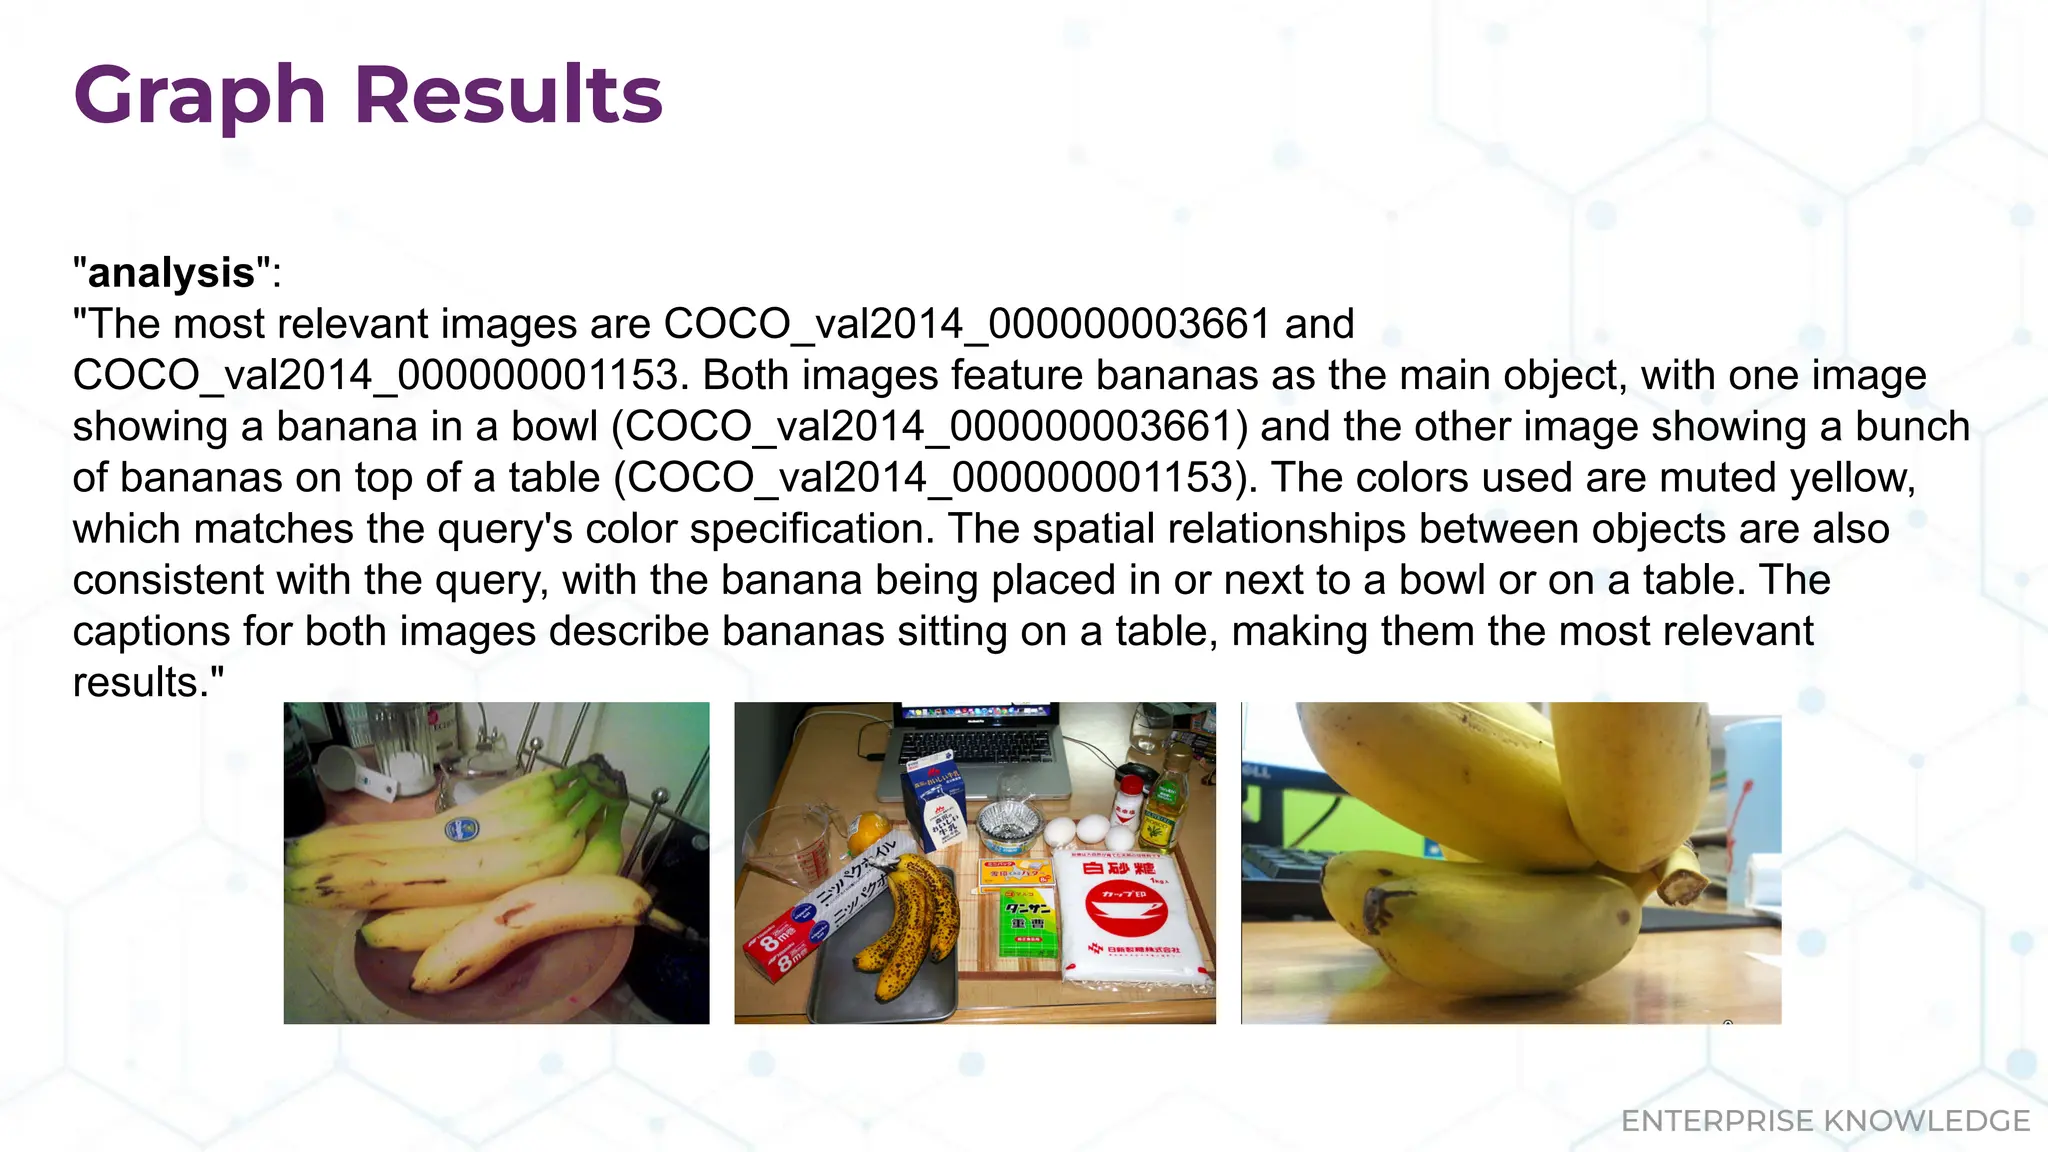
![ENTERPRISE KNOWLEDGE
Graph Results
"results": [
{
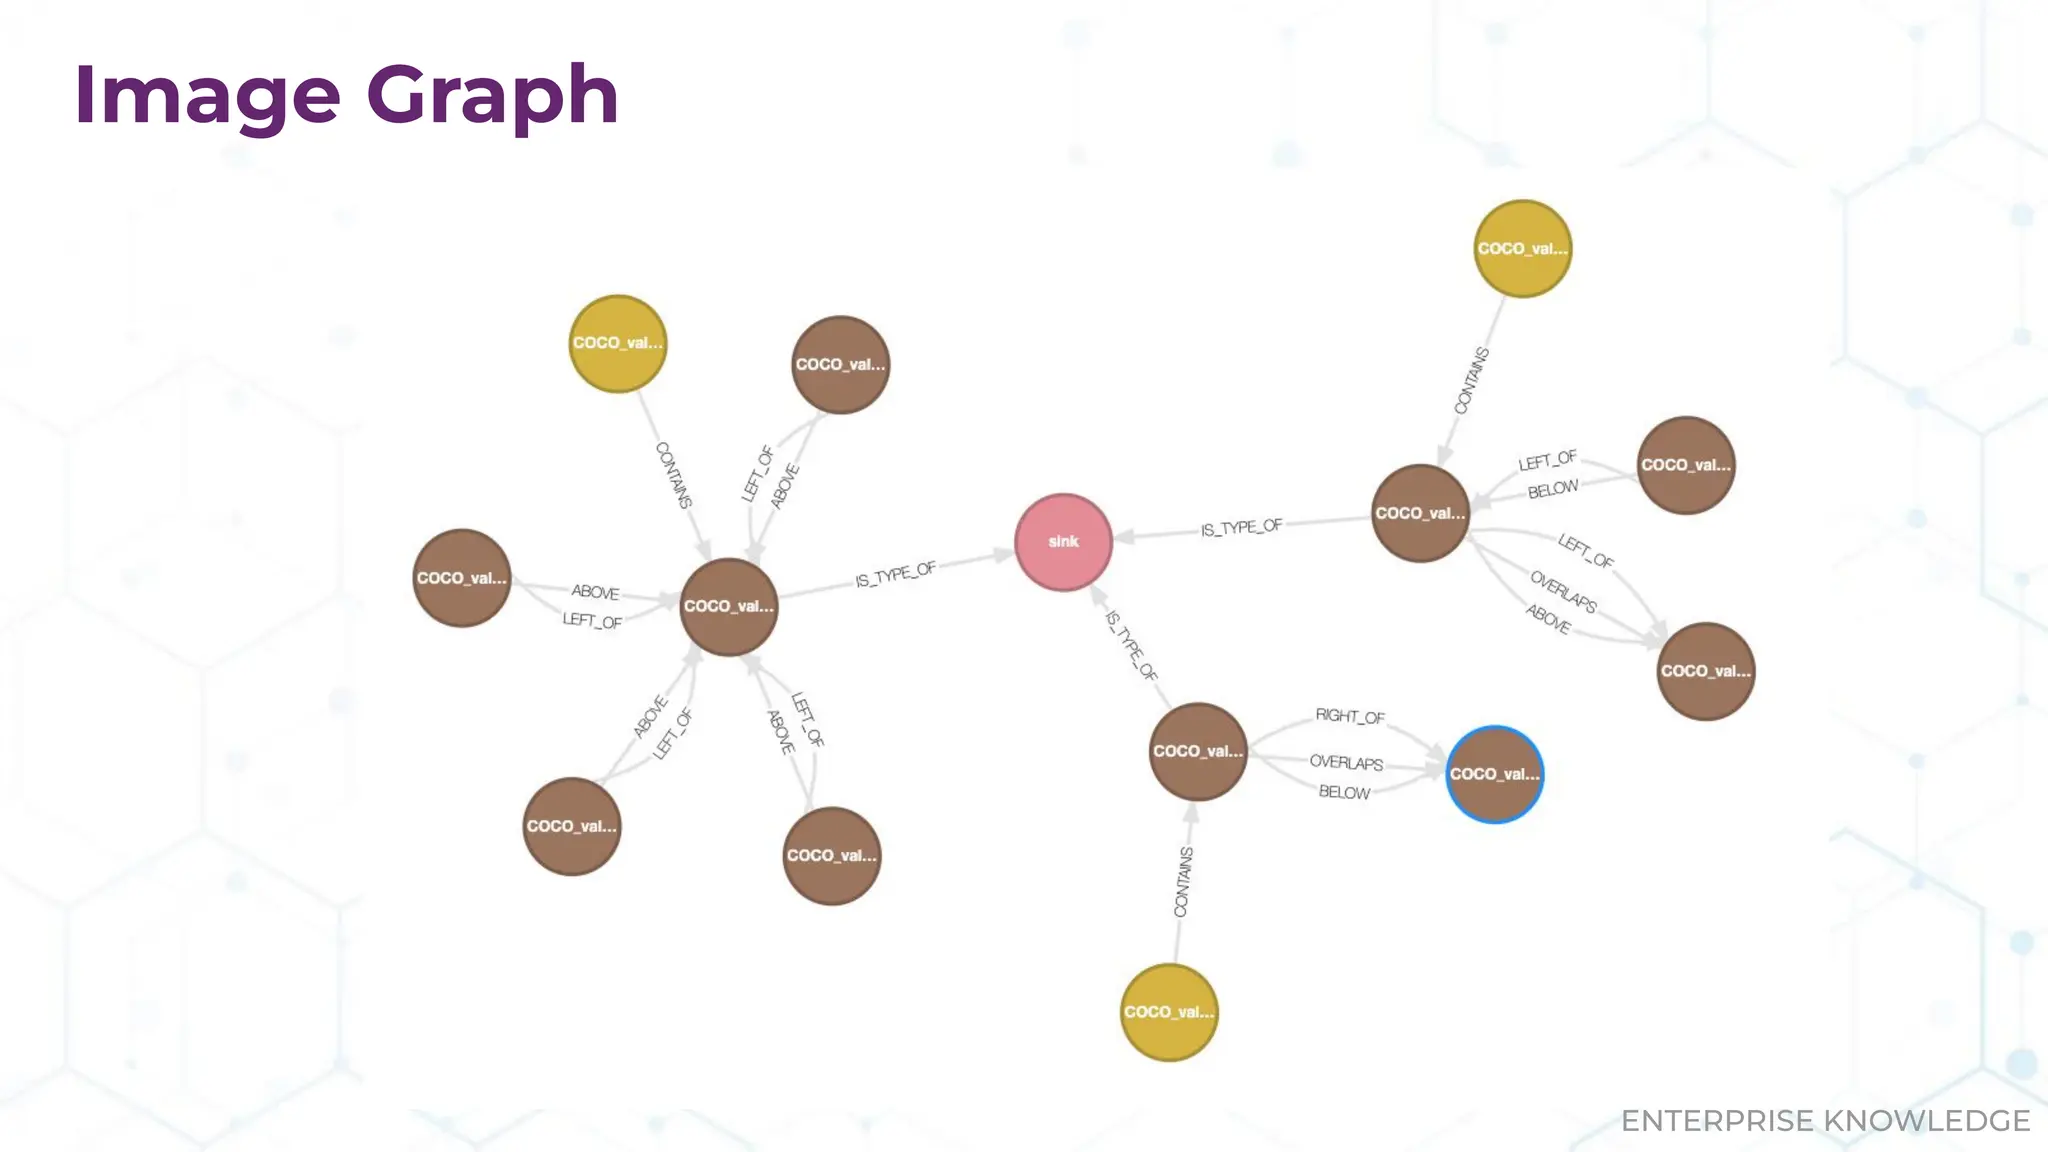
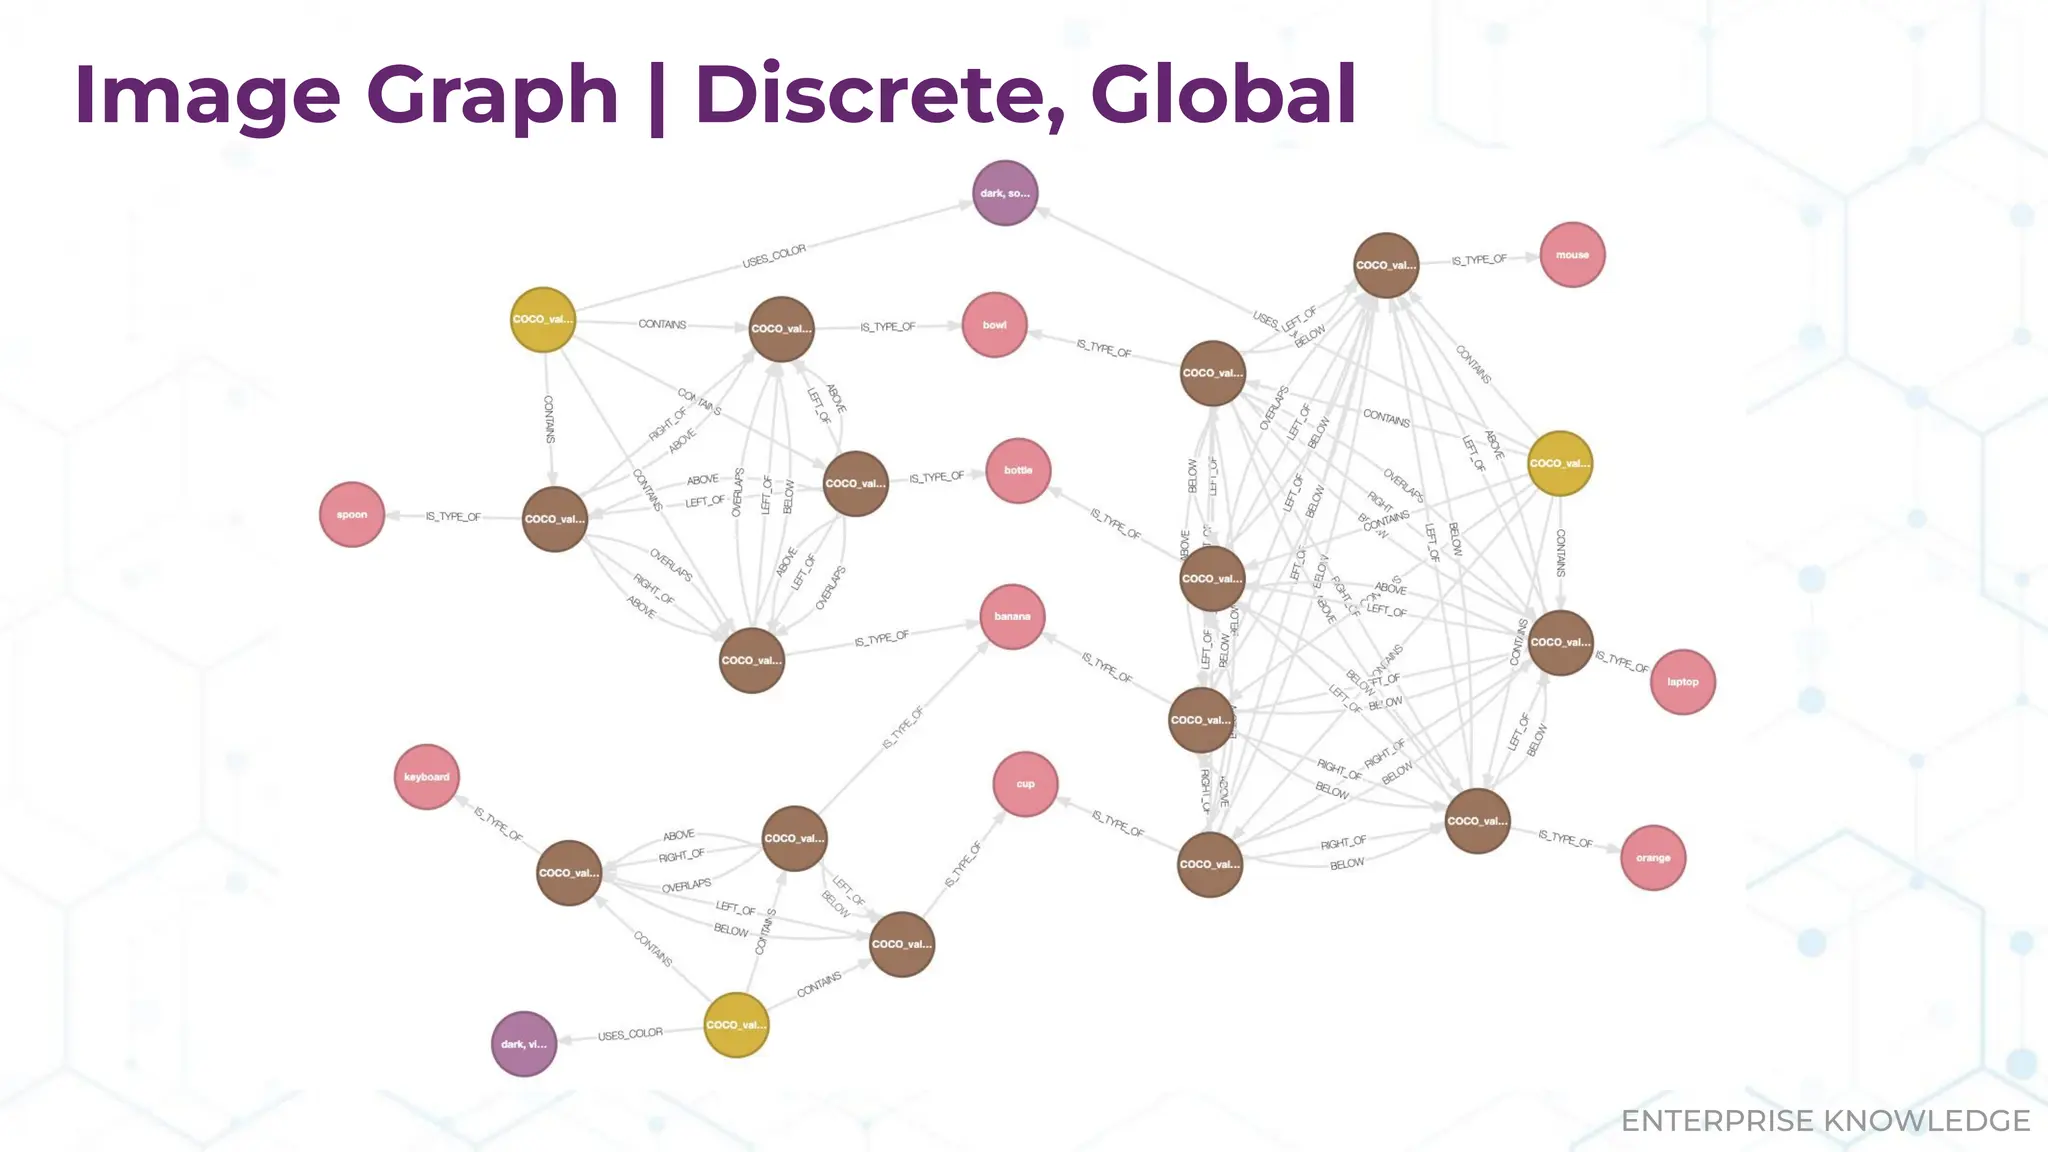
"name": "COCO_val2014_000000003661.jpg",
"similarity_score": 0.7162067890167236,
"objects": [
"medium, muted yellow bowl (LEFT_OF: banana, RIGHT_OF: spoon, ABOVE: spoon, BELOW:
banana, OVERLAPS: banana, ABOVE: bottle, LEFT_OF: bottle)",
"medium, soft yellow banana (LEFT_OF: bowl, RIGHT_OF: spoon, ABOVE: spoon, BELOW: bowl,
OVERLAPS: bowl, OVERLAPS: spoon, OVERLAPS: bottle, ABOVE: bottle, LEFT_OF: bottle)",
"medium, muted yellow spoon (LEFT_OF: bottle, RIGHT_OF: bowl, ABOVE: bowl, OVERLAPS:
banana, ABOVE: banana, ABOVE: bottle, RIGHT_OF: banana)",
"medium, muted yellow bottle (LEFT_OF: bowl, ABOVE: bowl, OVERLAPS: banana, ABOVE:
banana, ABOVE: spoon, LEFT_OF: banana, LEFT_OF: spoon)"
],
"colors": [
"dark, soft yellow"
],
"caption": "A banana that is sitting in a bowl on the table."
},](https://image.slidesharecdn.com/datadaytx-25-250128162507-e8084c5f/75/Multimodal-Graph-RAG-mmGraphRAG-Incorporating-Vision-in-Search-and-Analytics-31-2048.jpg)

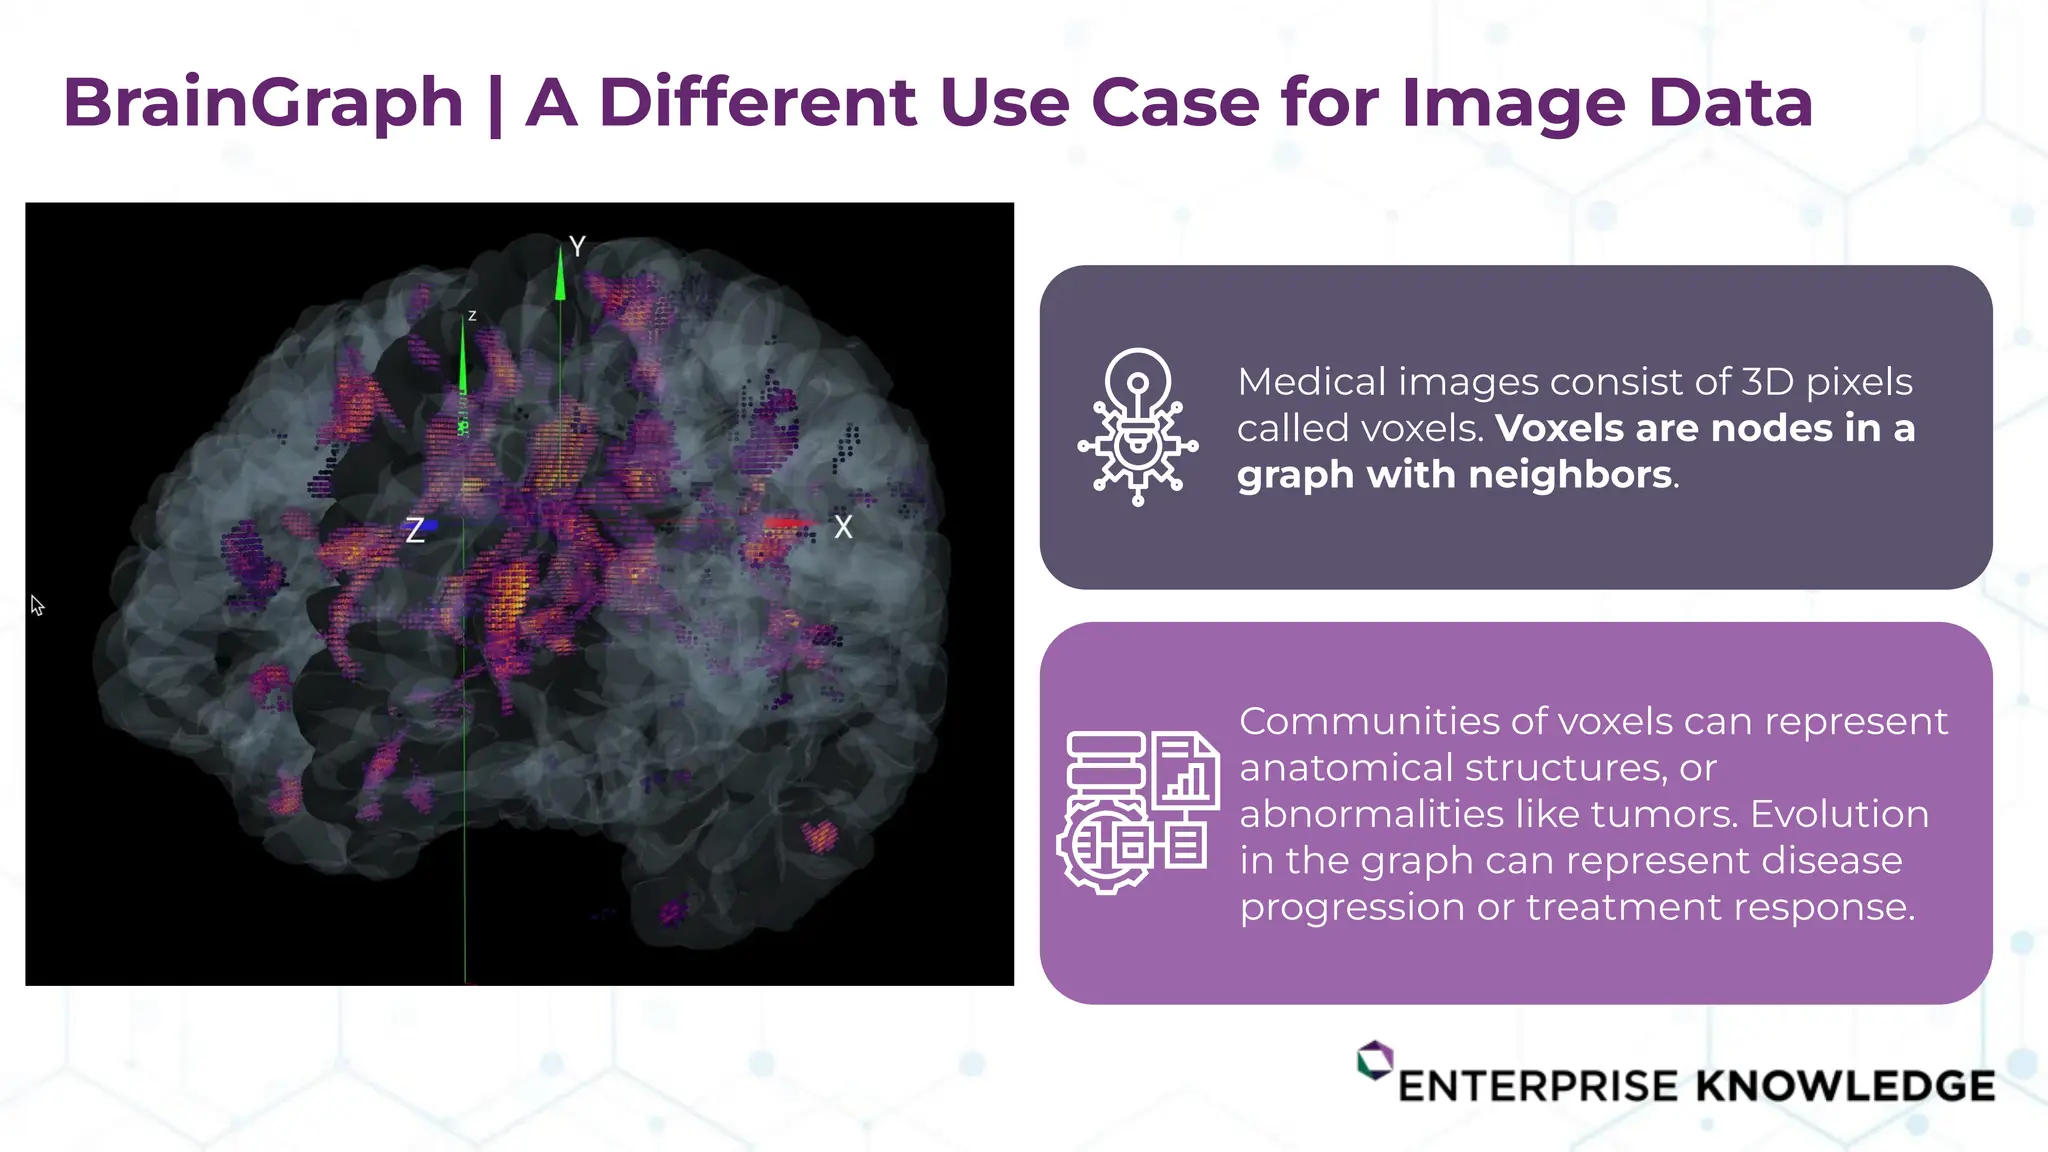


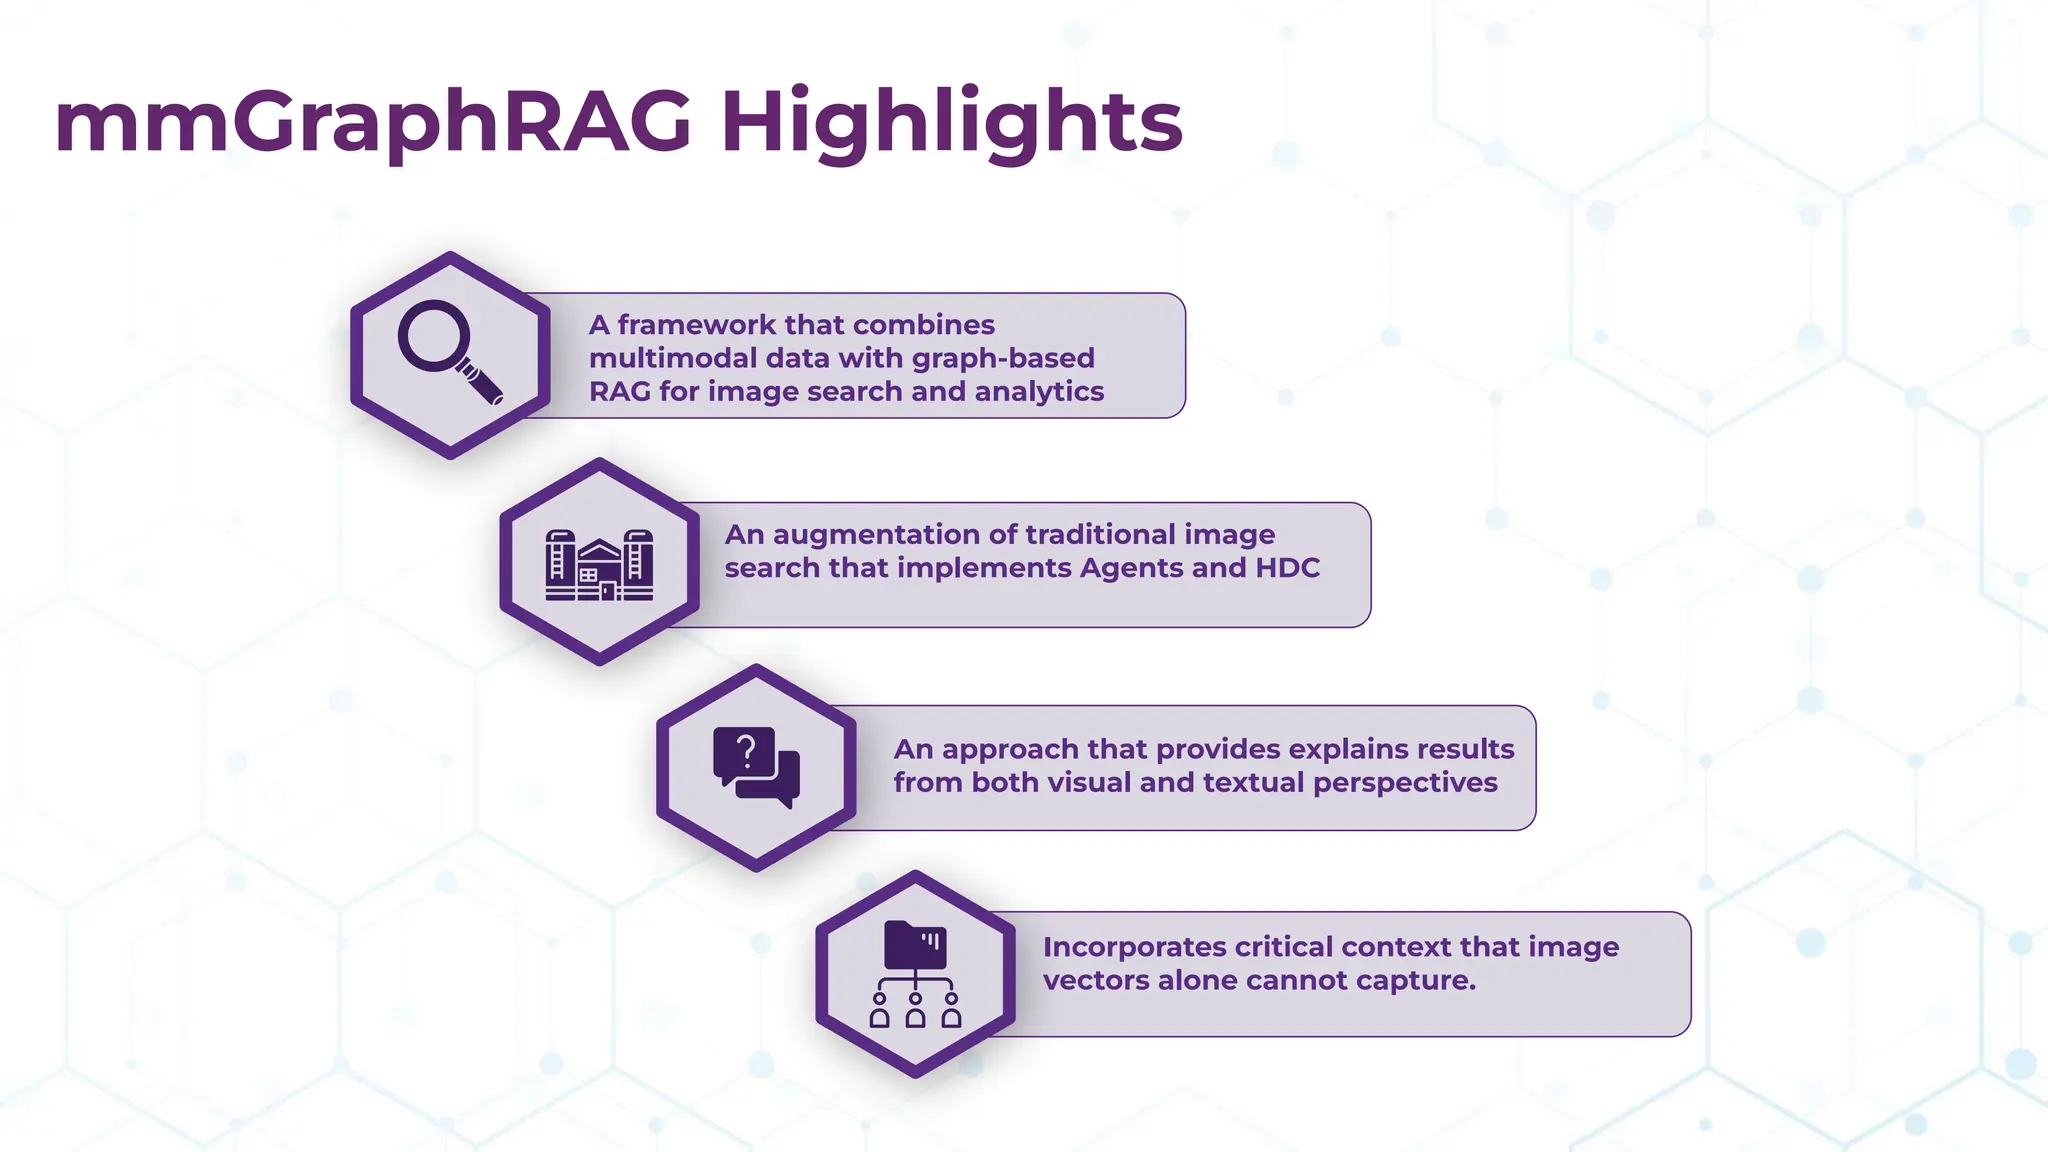
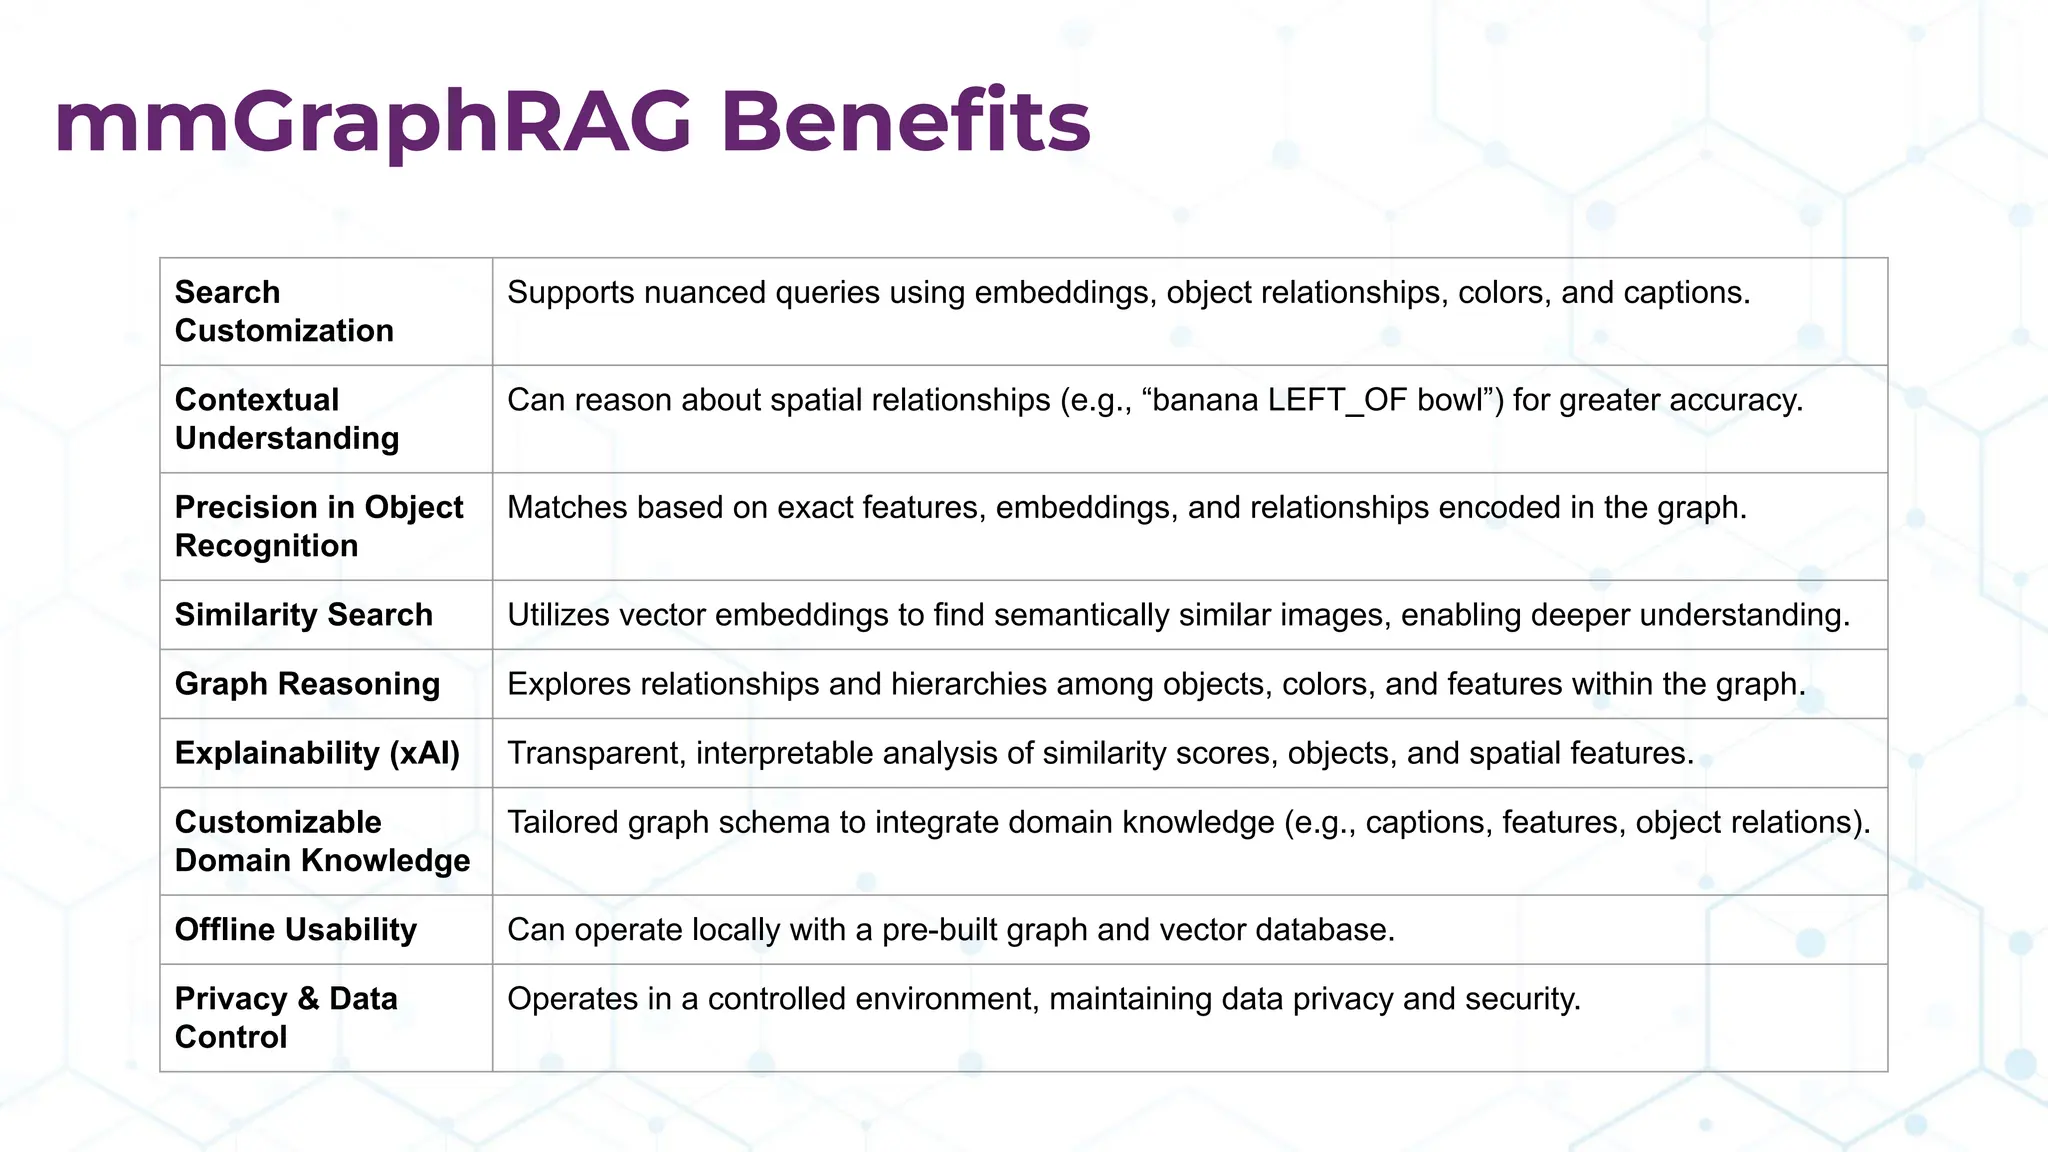
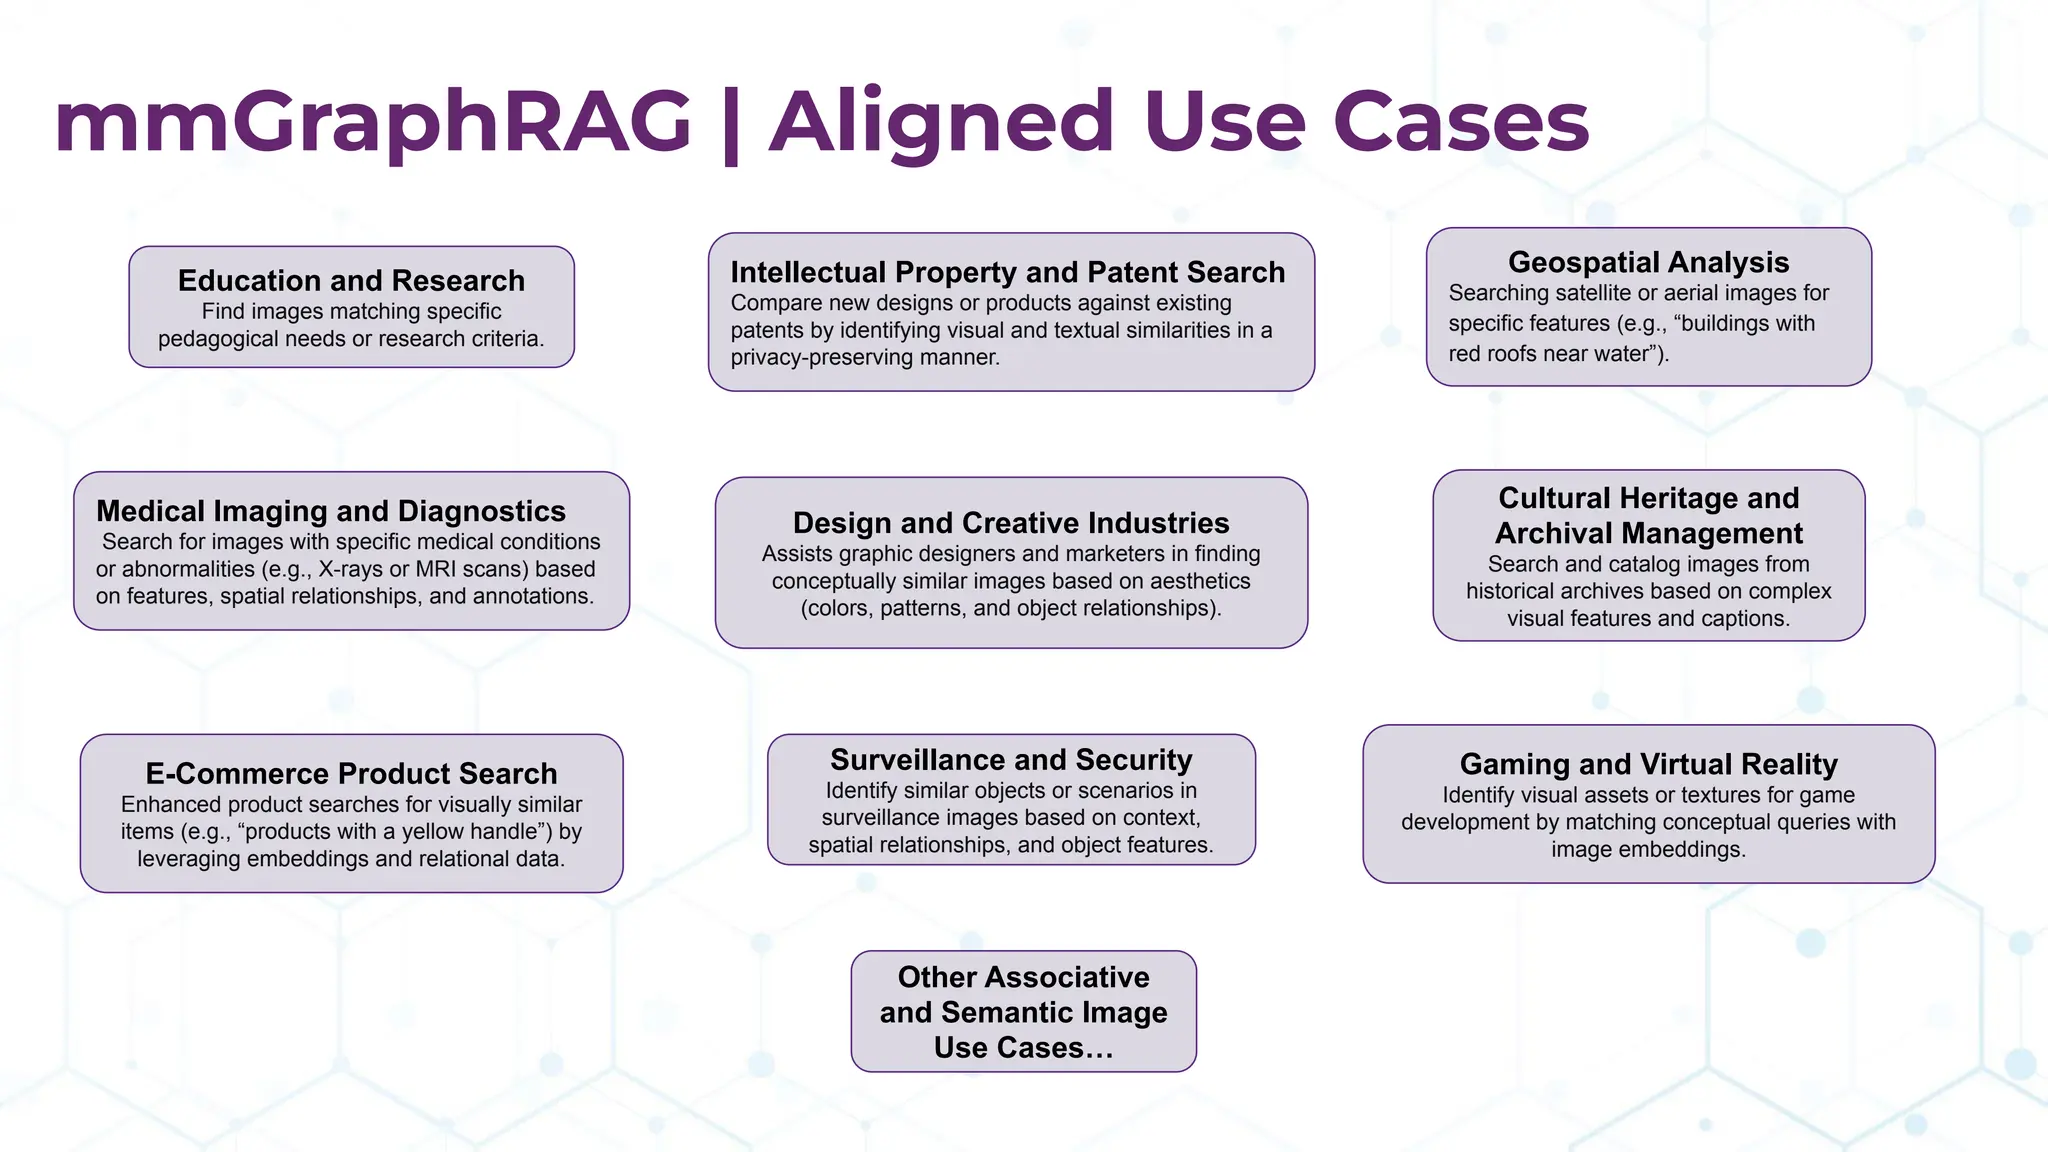
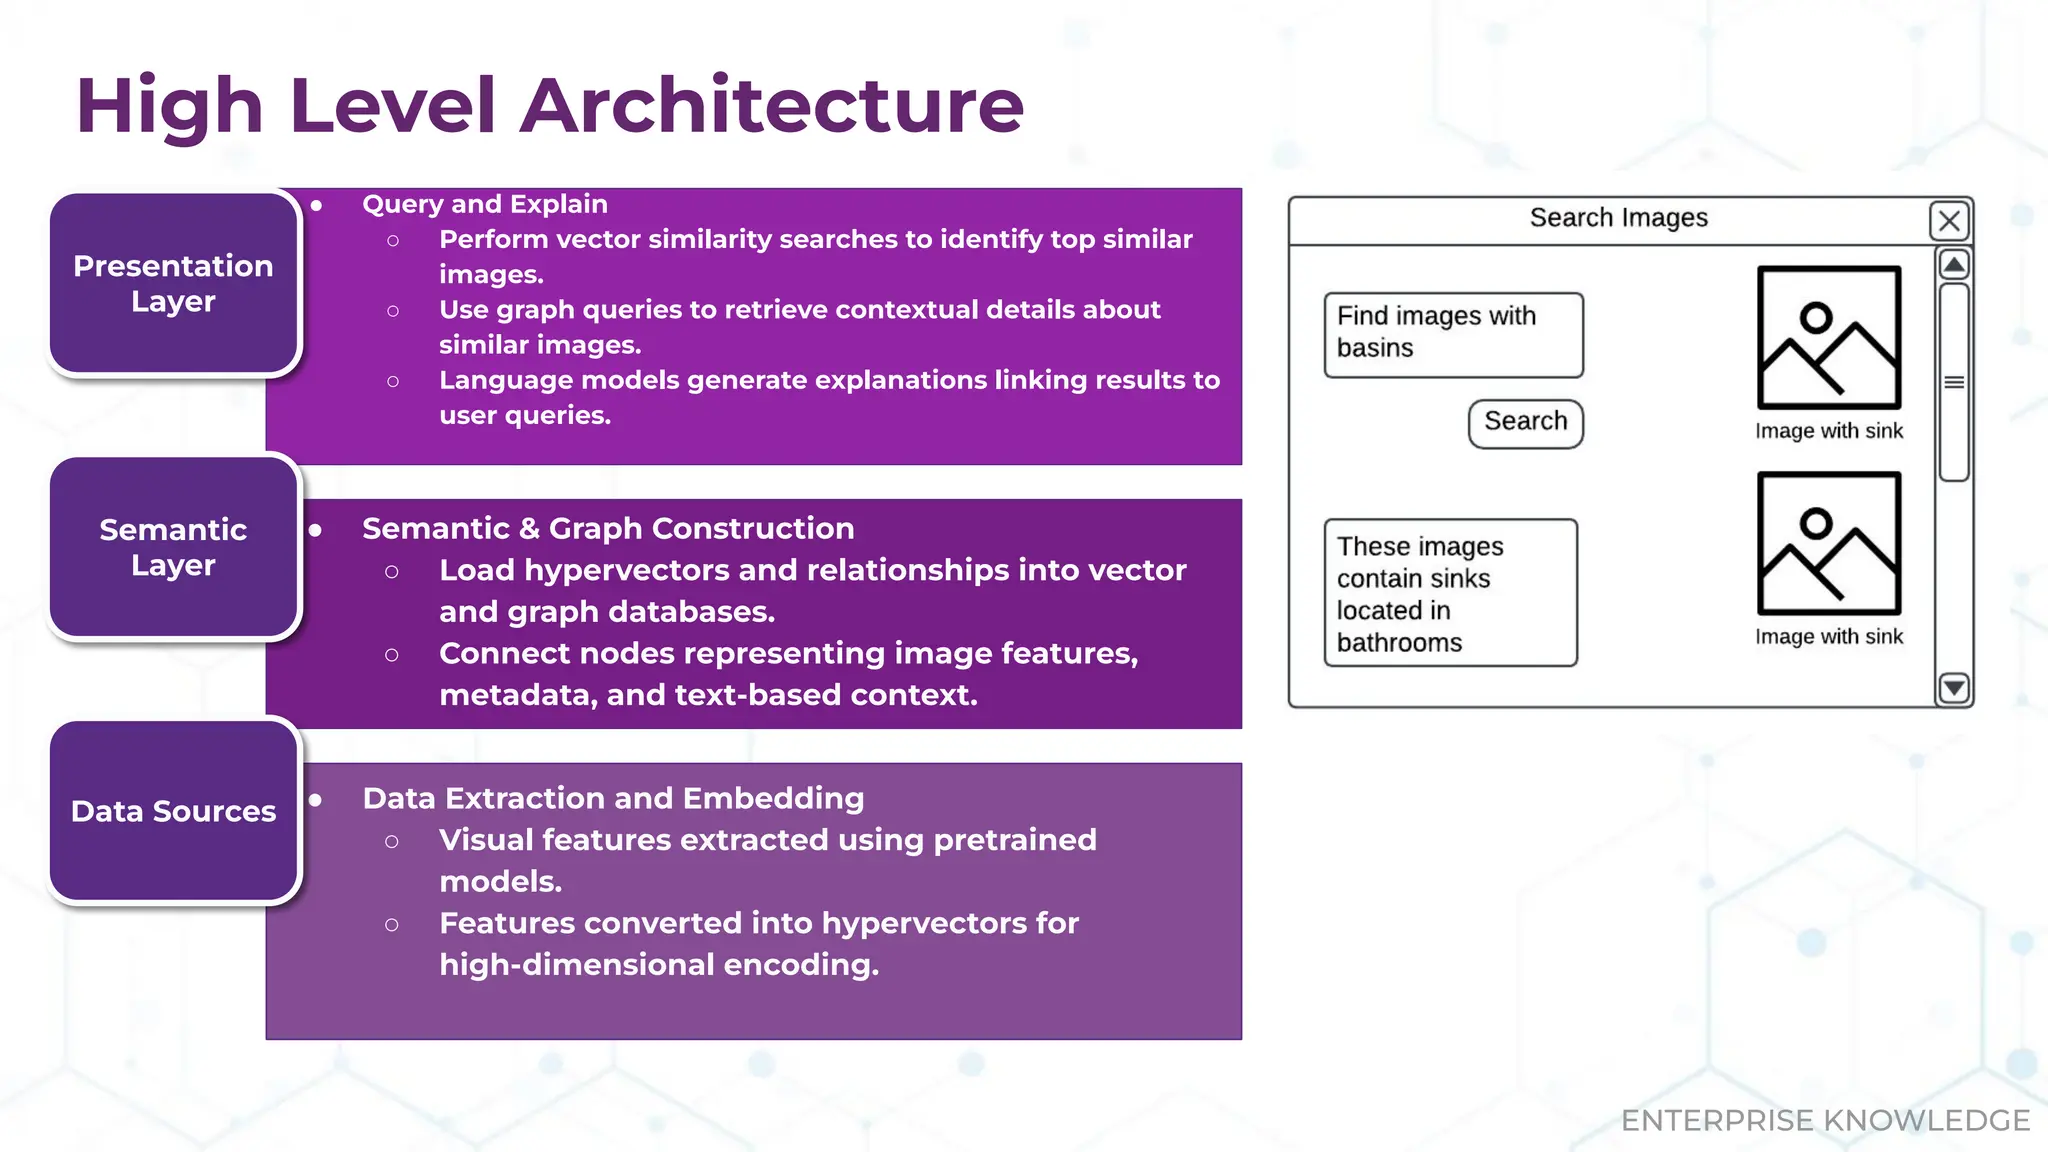
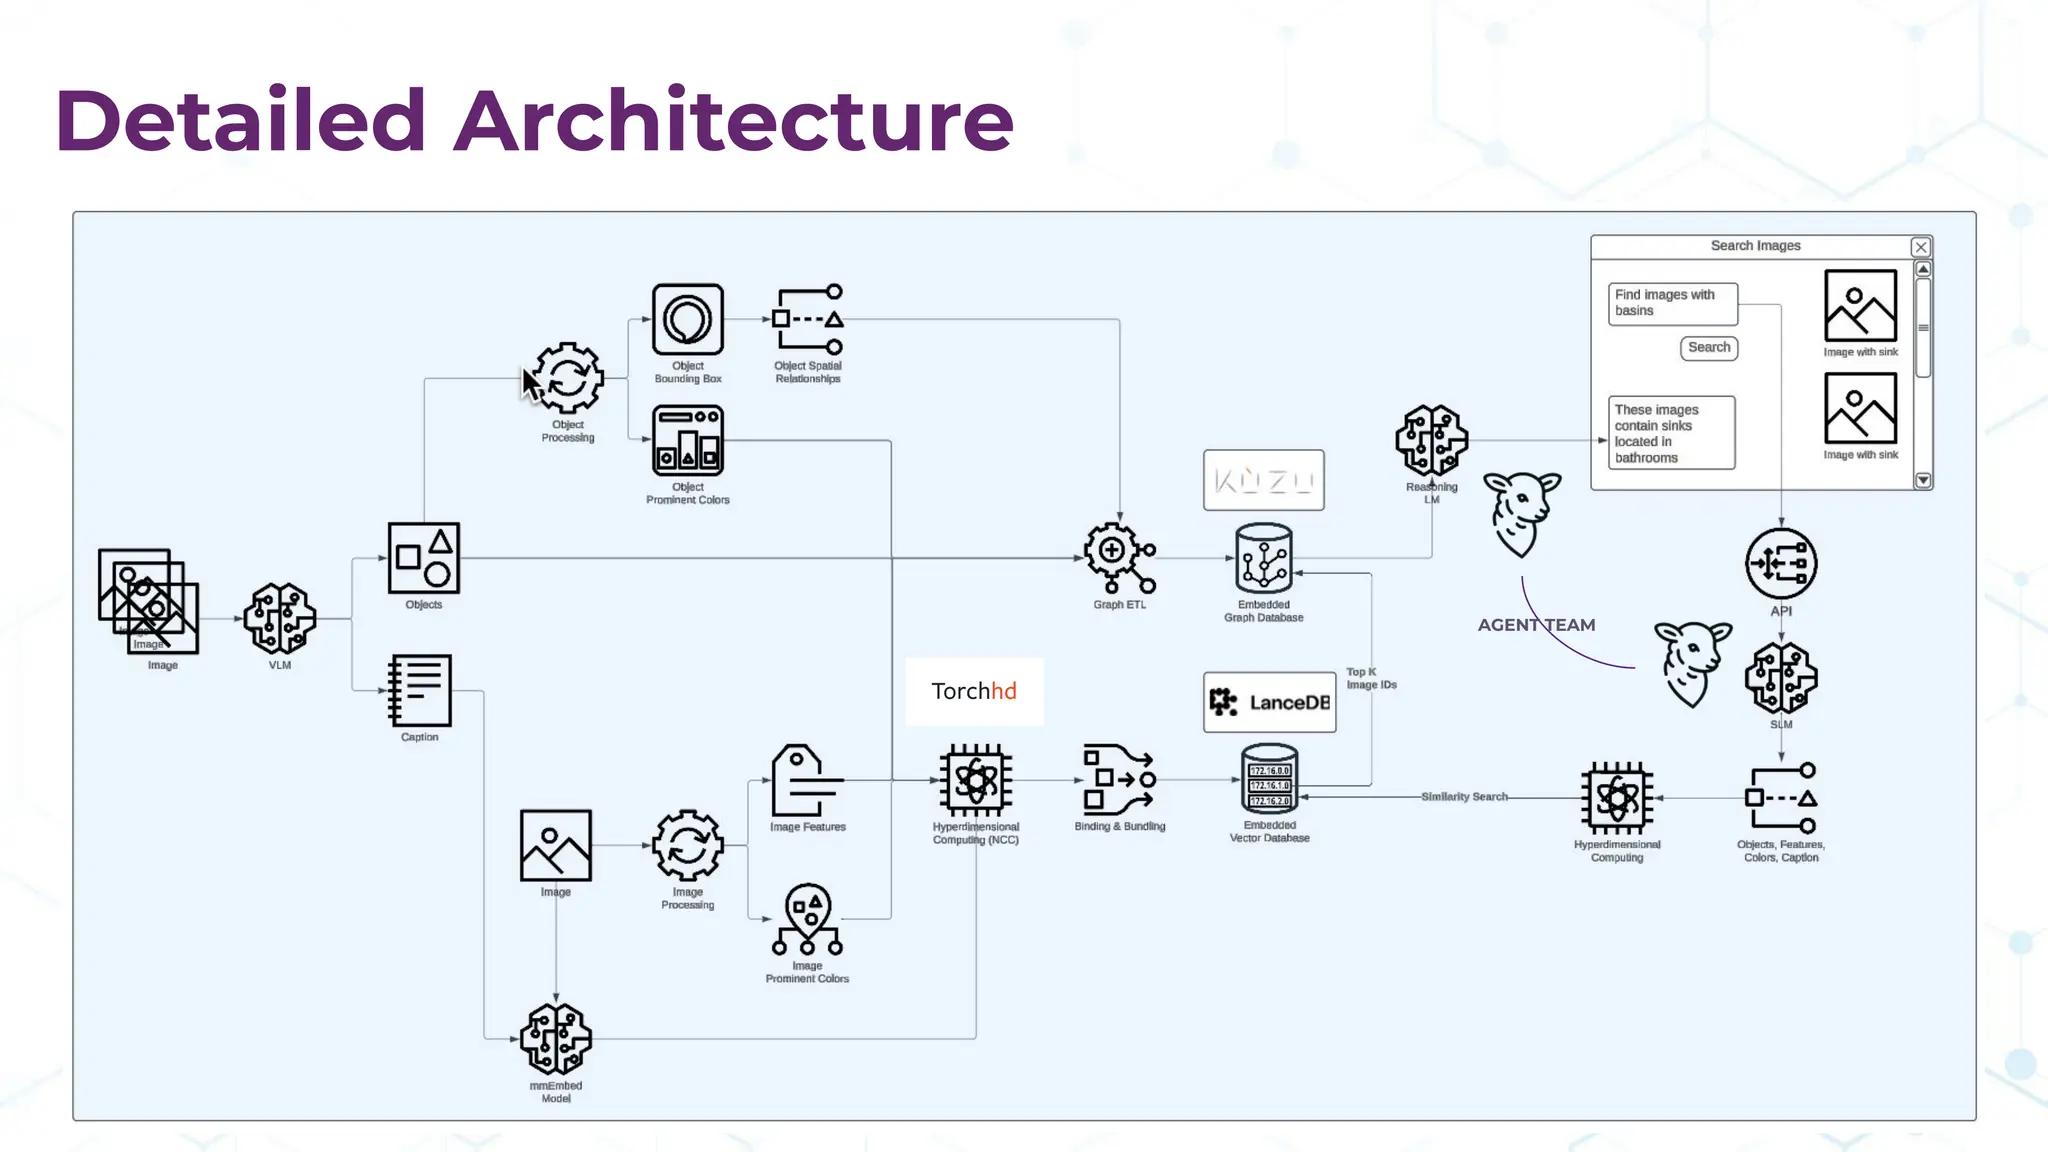
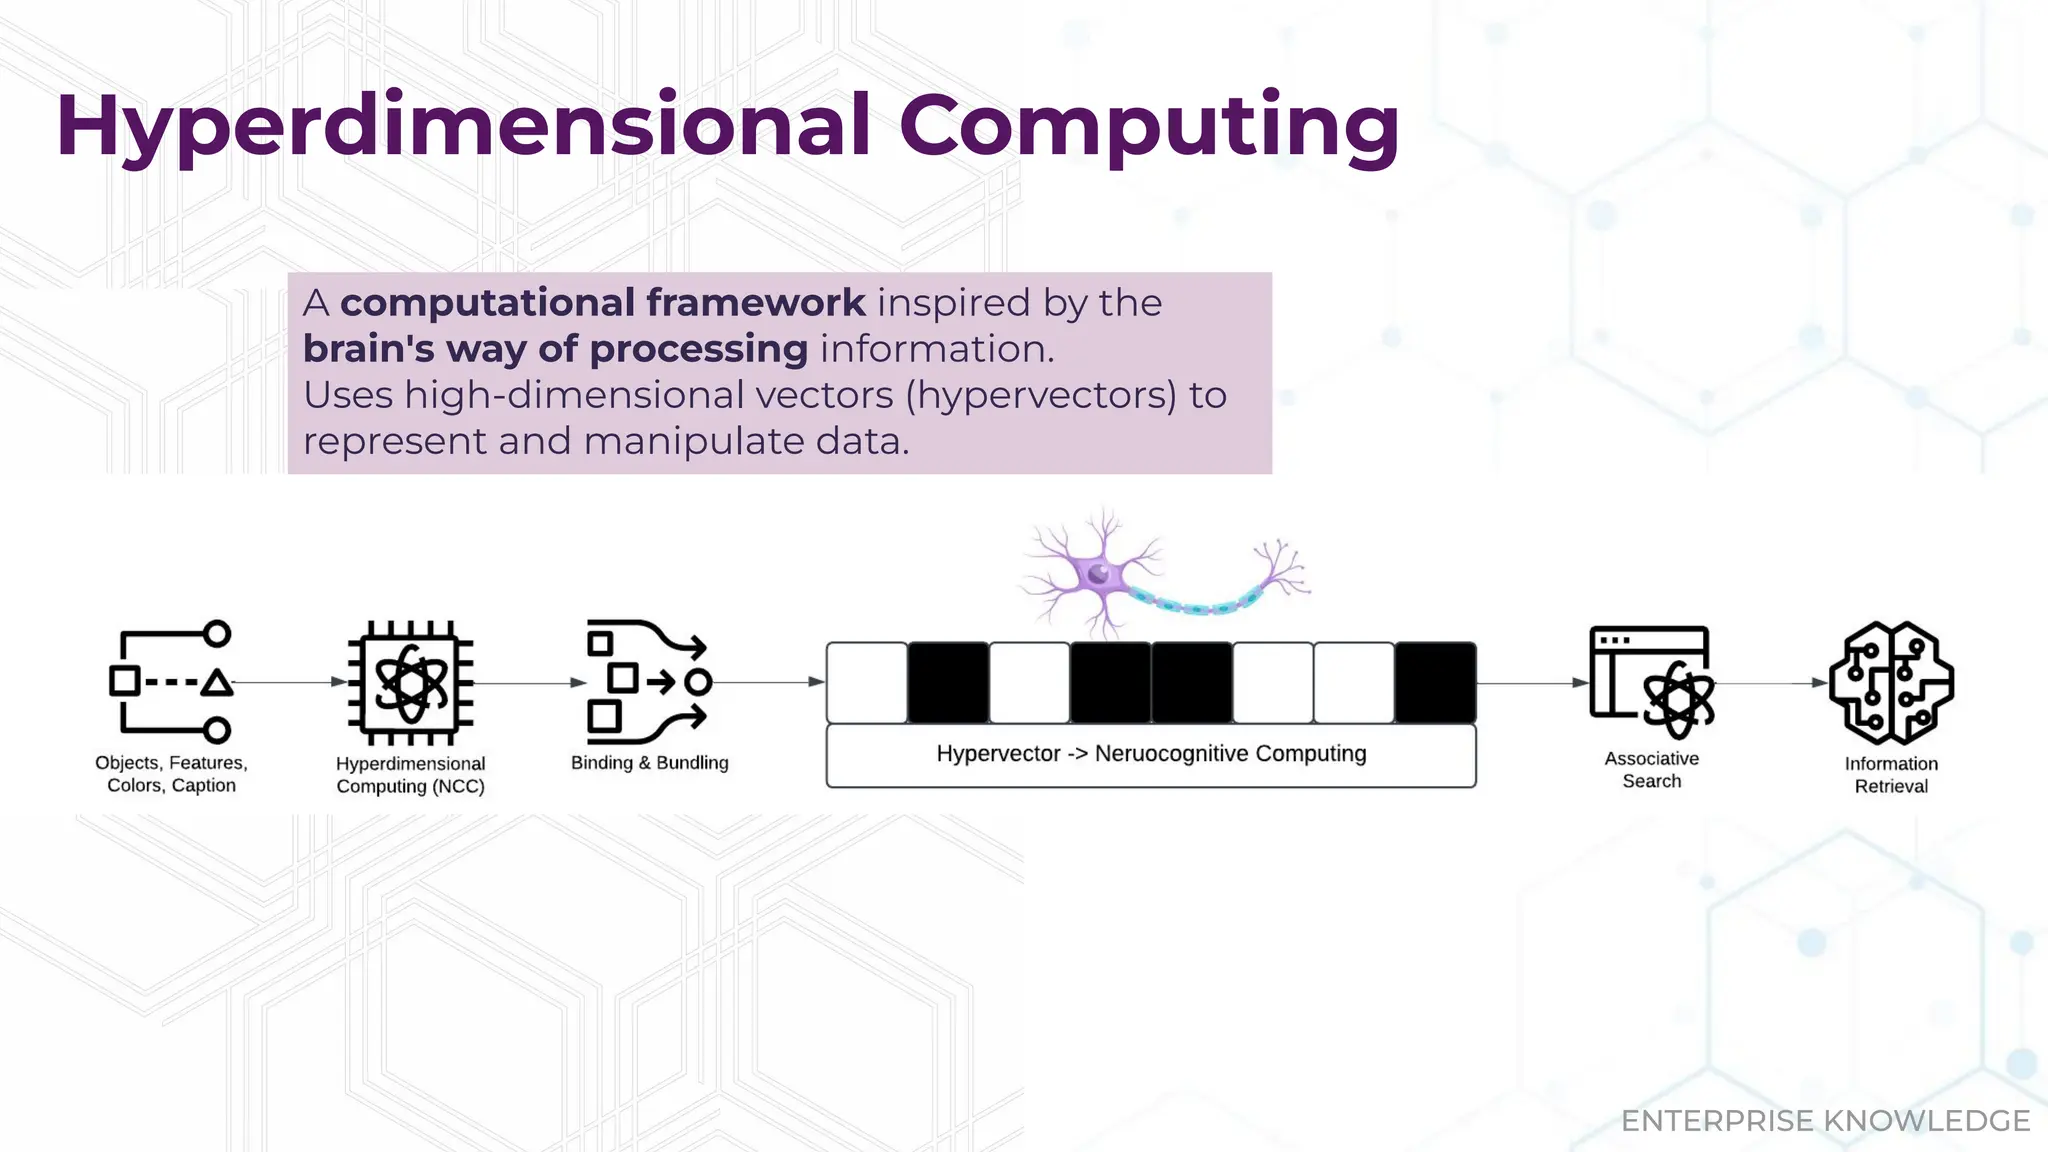
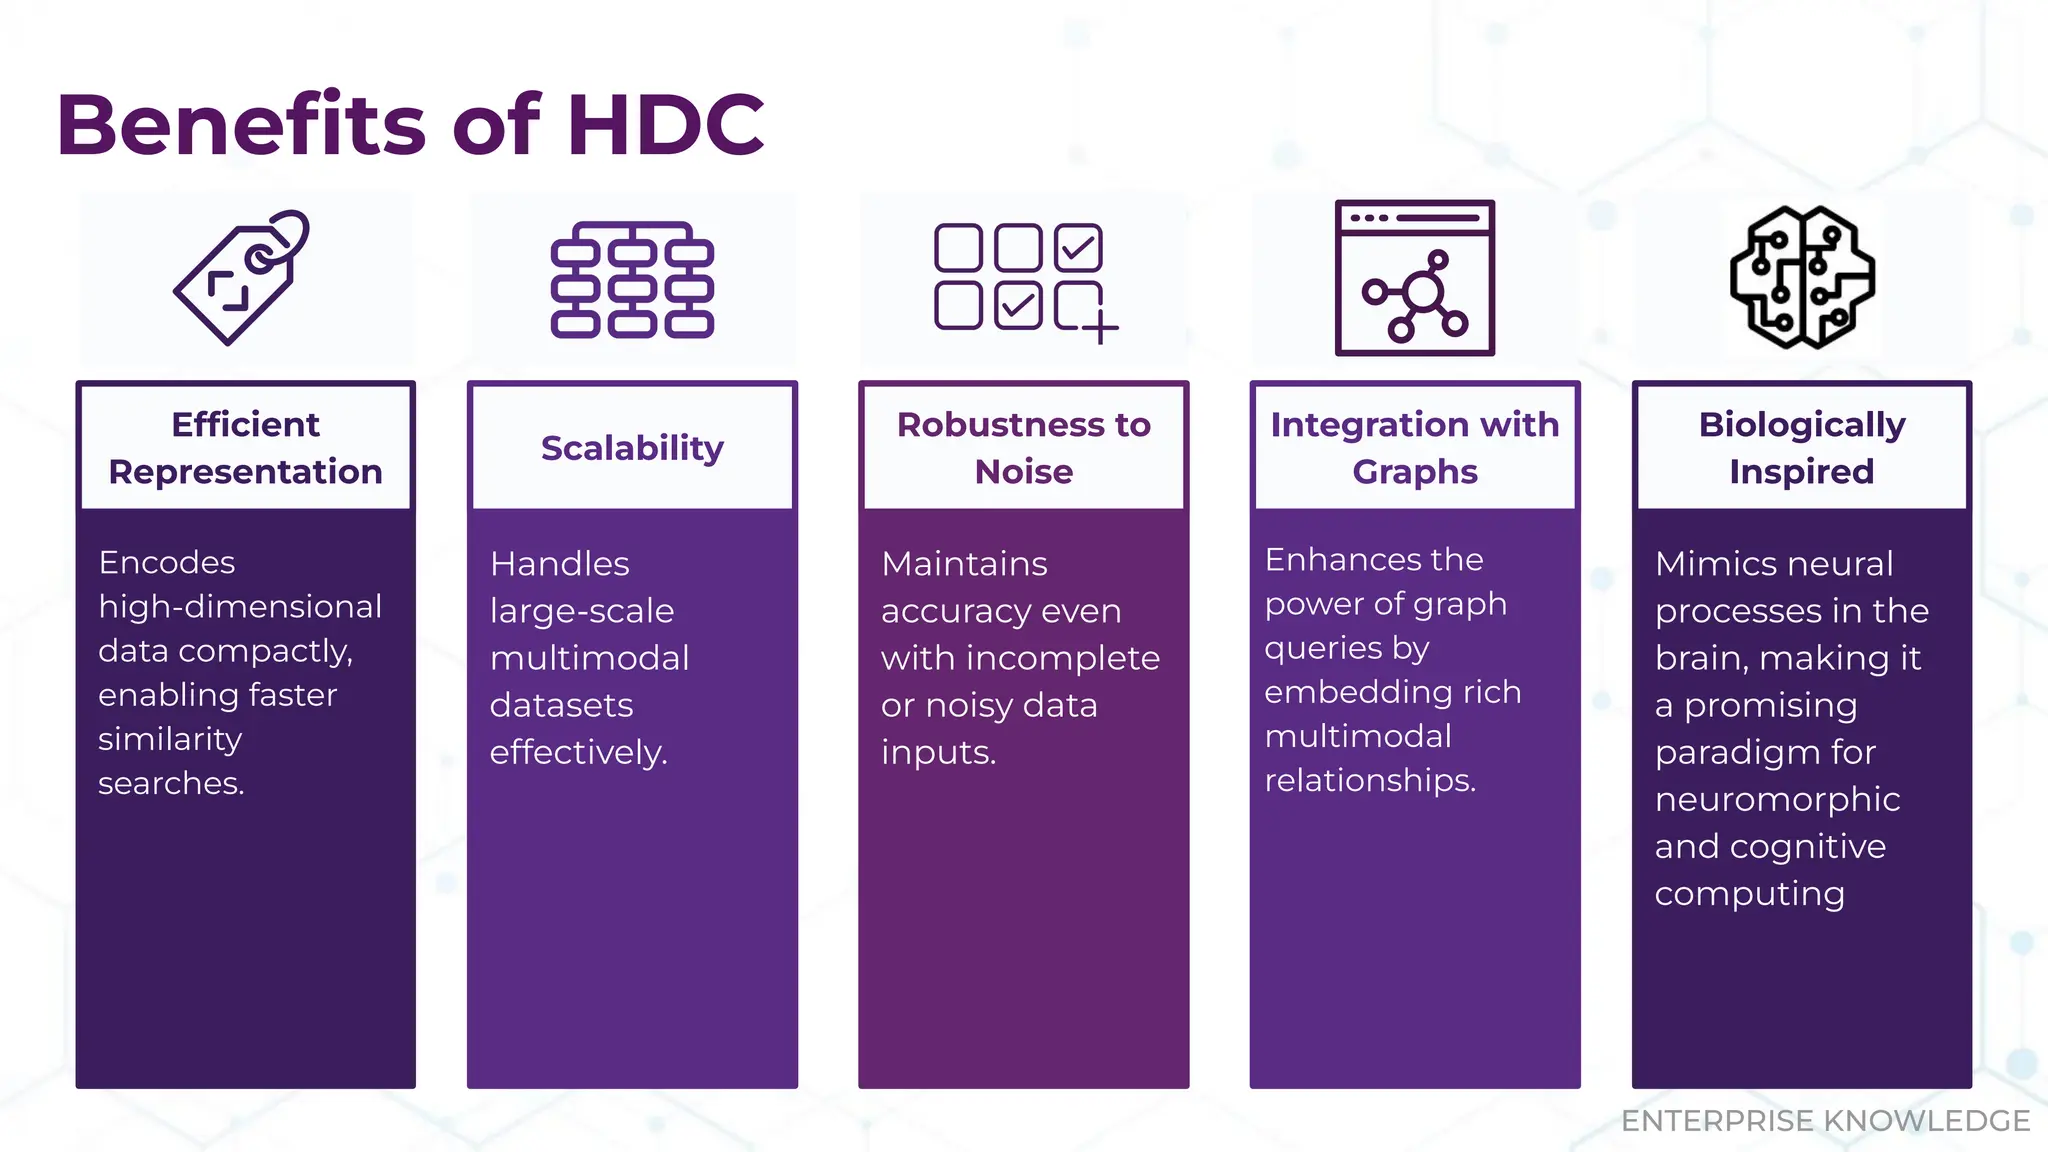
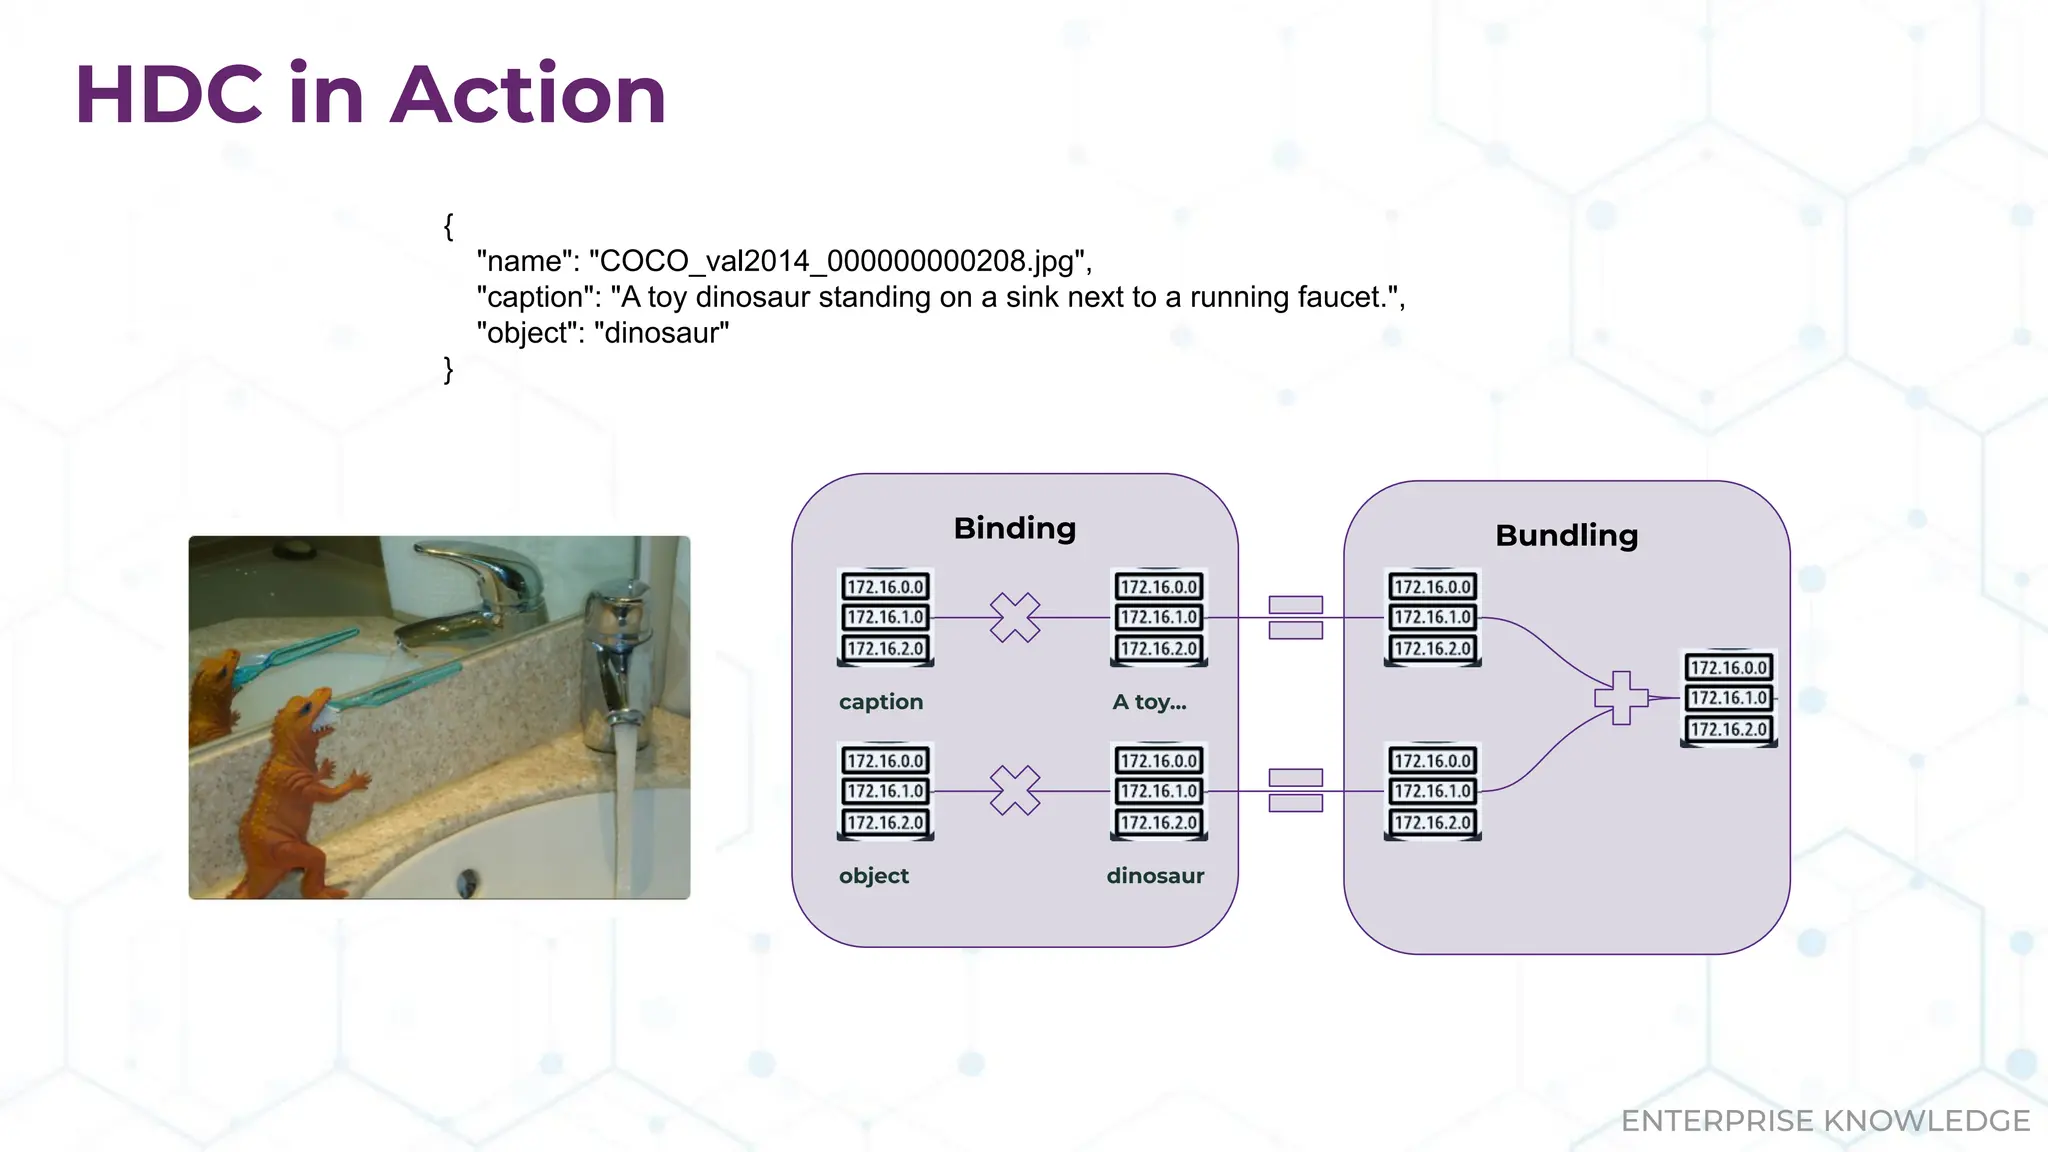
The document discusses the multimodal graph RAG (mmgraphrag) framework, which integrates visual and textual data in image search and analytics to enhance search accuracy and interpretability. It emphasizes the importance of addressing challenges posed by siloed data and outlines various use cases such as patent searches, medical imaging, and e-commerce. Additionally, it introduces hyperdimensional computing as a method for effectively handling large-scale multimodal datasets, enhancing the potential for innovative applications.


