Module 3: Poverty,Inequality
and Development
PREPARED BY: MRS. CATHERINE U. MALIG, MBA
REFERENCE: ECONOMIC DEVELOPMENT BY: M.TODARO AND SMITH
6.
Poverty and Inequality
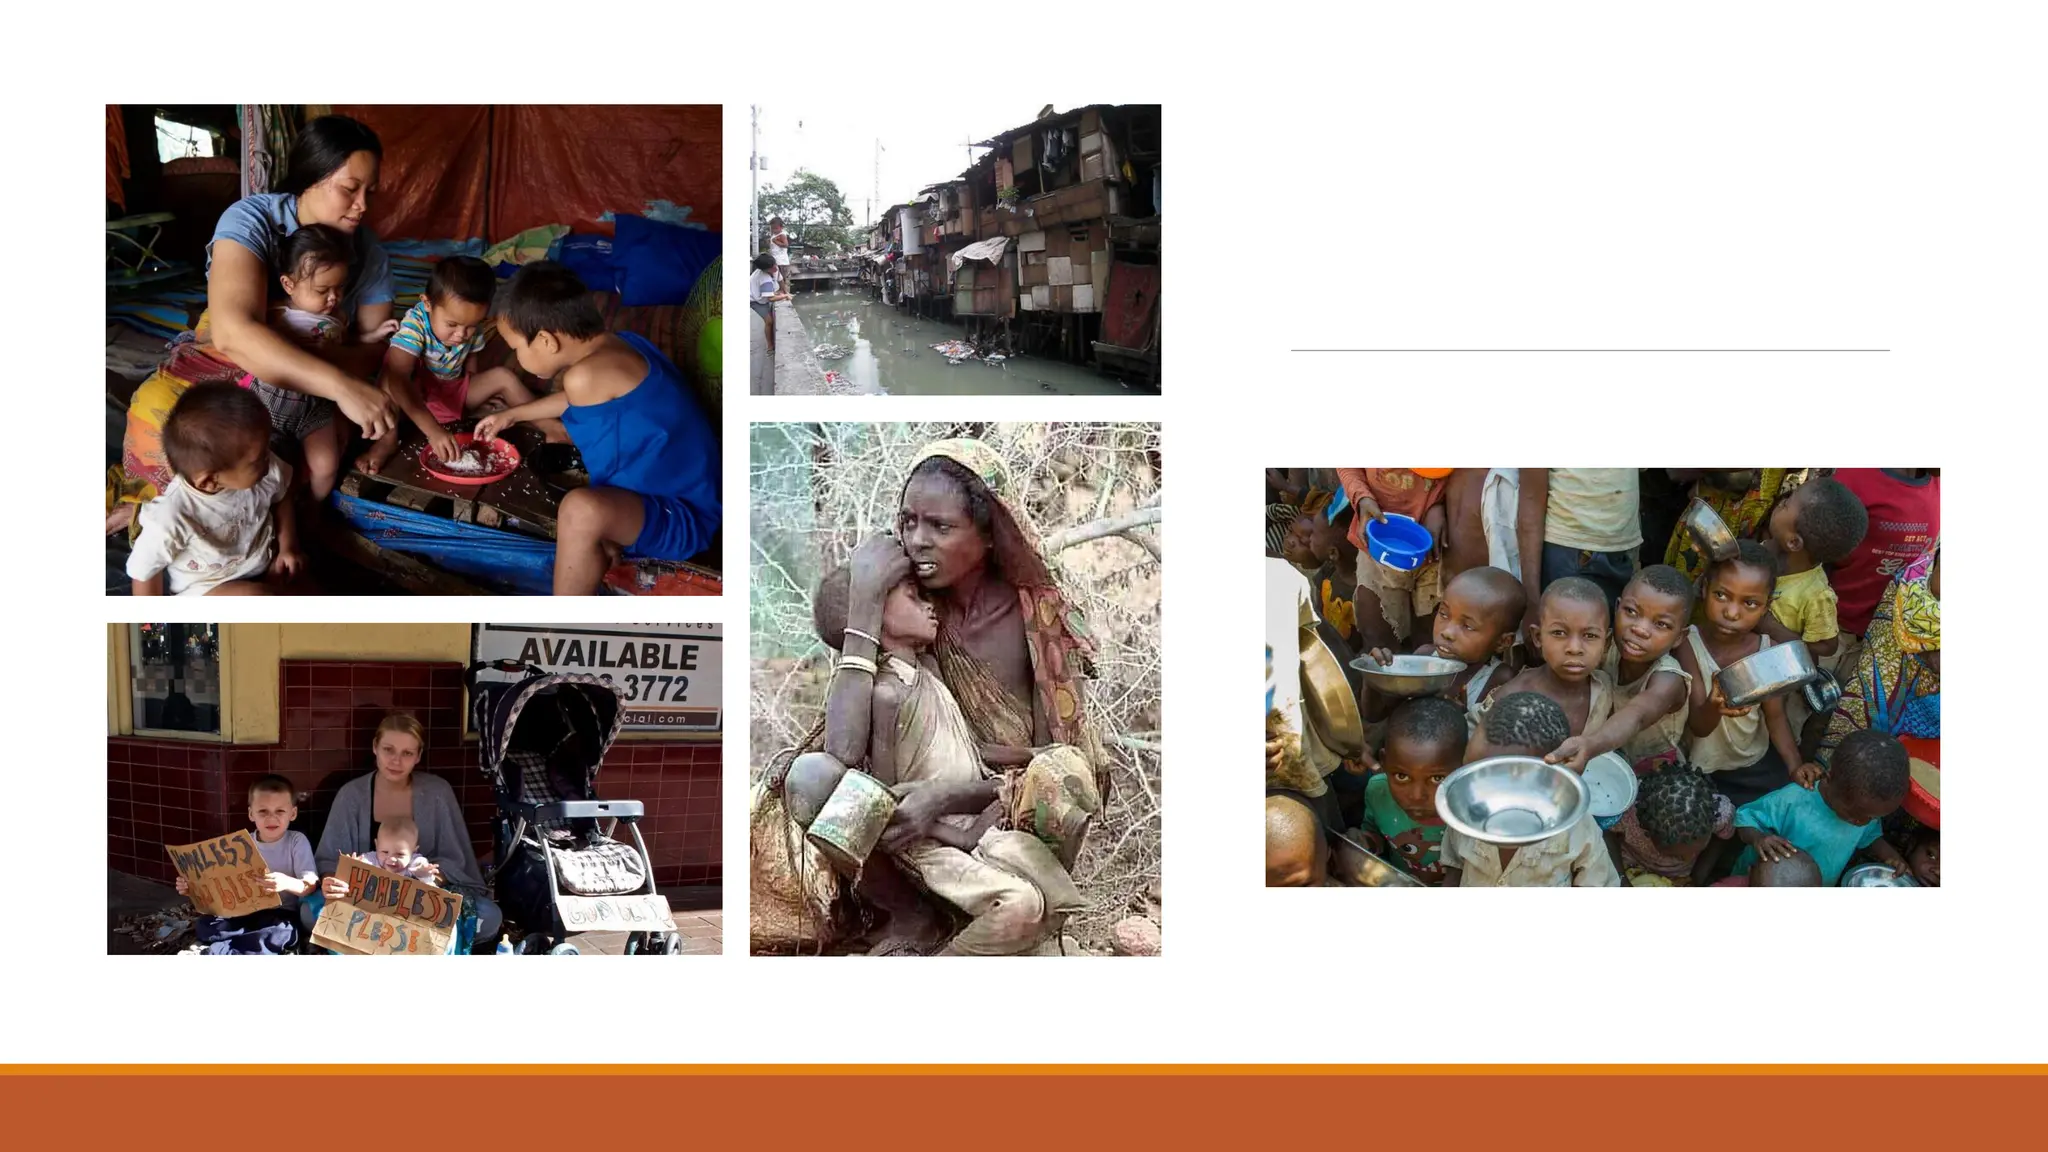
Povertyis the deprivation of food, shelter, money,
and clothing when people can’t satisfy their basic
needs. It can also be understood simply as a lack of
money or more broadly in terms of barriers to
everyday human life.
Inequality refers to disparities in the distribution of
economic assets and income.
1. Size Distributions
Thepersonal or size distribution of income is the
measure most commonly used by economists. It simply
deals with individual persons or households and the total
incomes they receive.
Derived solely from employment or came also from
other sources such as interest, profits, rents, gifts, or
inheritance.
9.
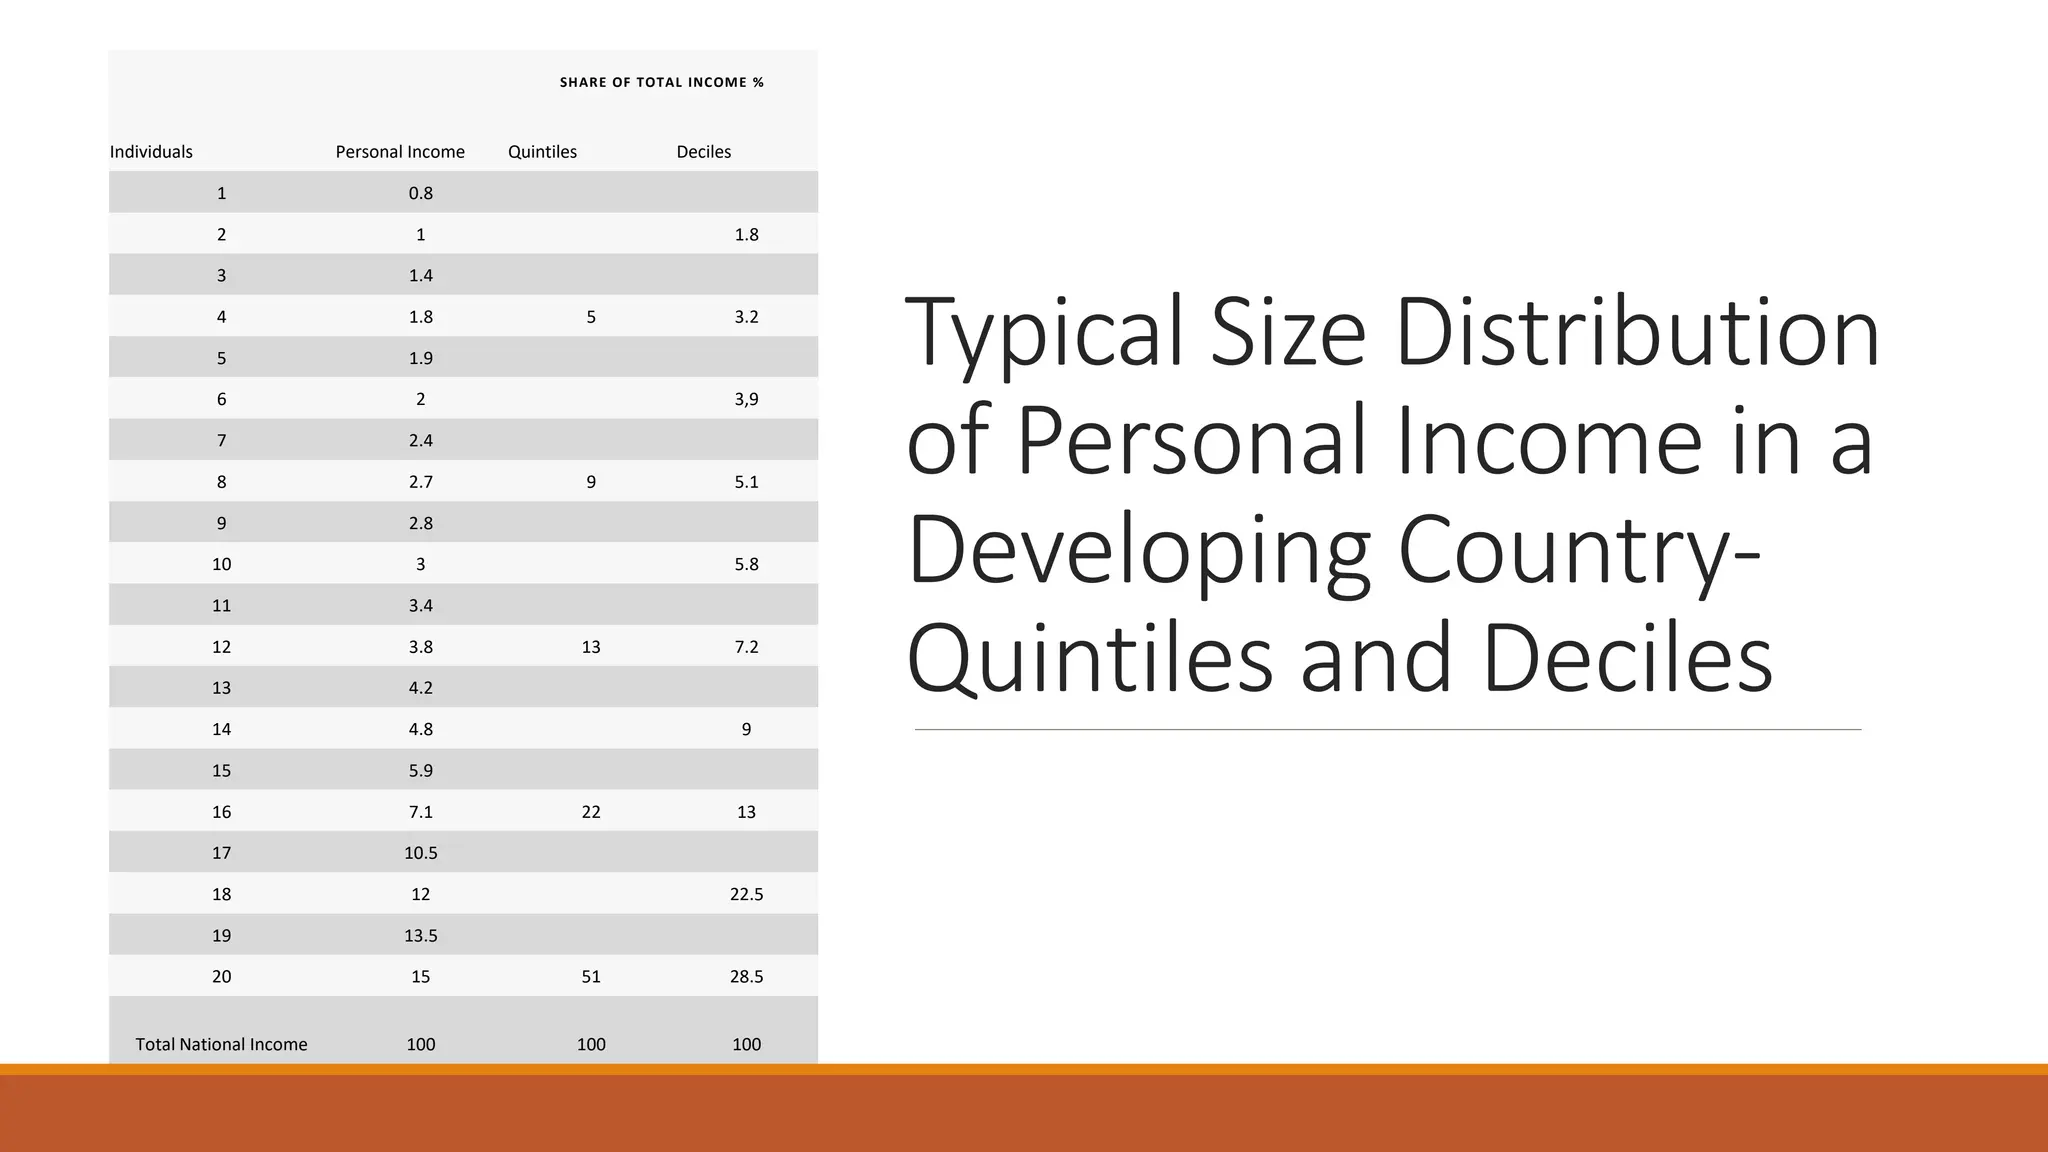
Typical Size Distribution
ofPersonal Income in a
Developing Country-
Quintiles and Deciles
SHARE OF TOTAL INCOME %
Individuals Personal Income Quintiles Deciles
1 0.8
2 1 1.8
3 1.4
4 1.8 5 3.2
5 1.9
6 2 3,9
7 2.4
8 2.7 9 5.1
9 2.8
10 3 5.8
11 3.4
12 3.8 13 7.2
13 4.2
14 4.8 9
15 5.9
16 7.1 22 13
17 10.5
18 12 22.5
19 13.5
20 15 51 28.5
Total National Income 100 100 100
10.
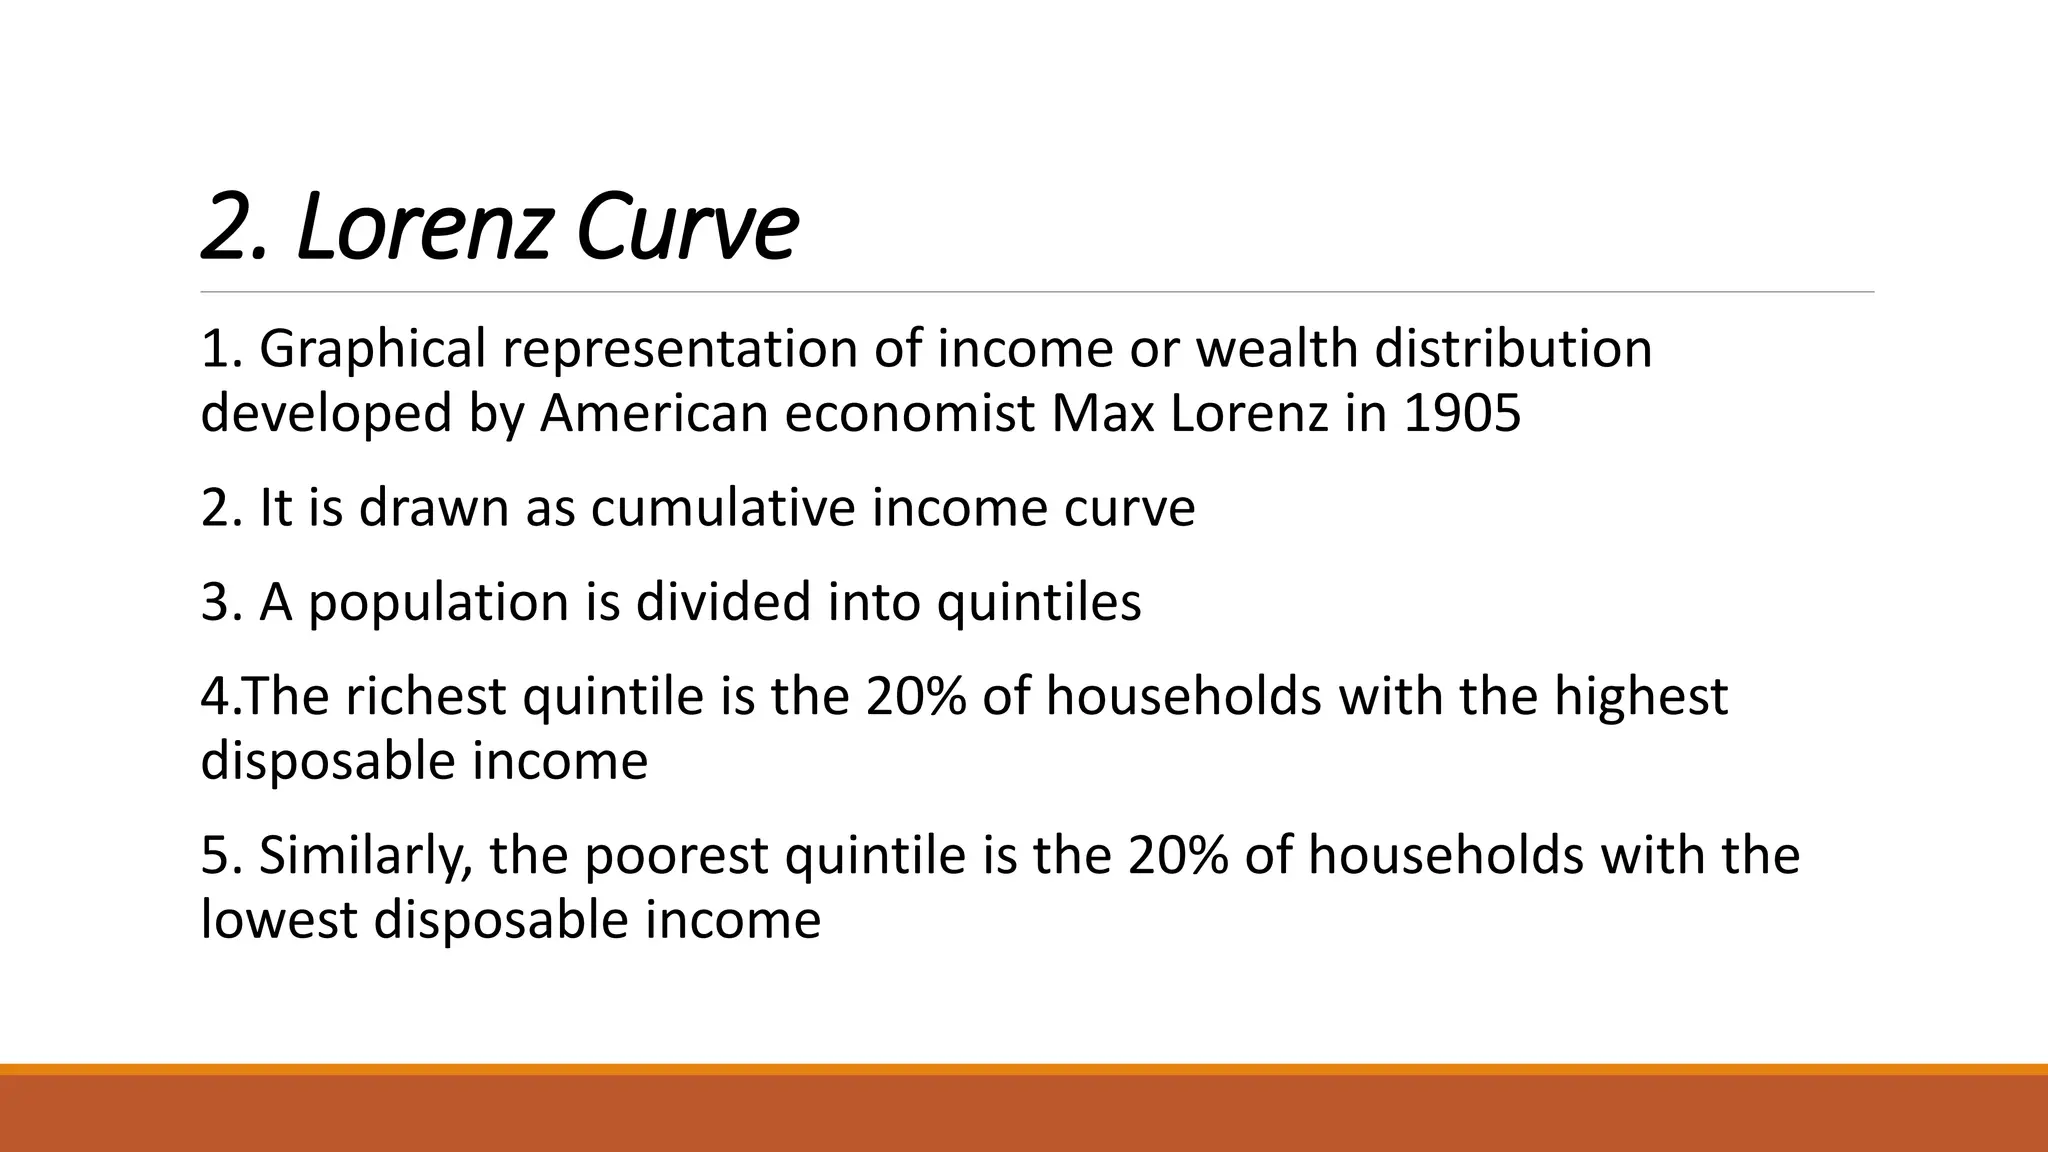
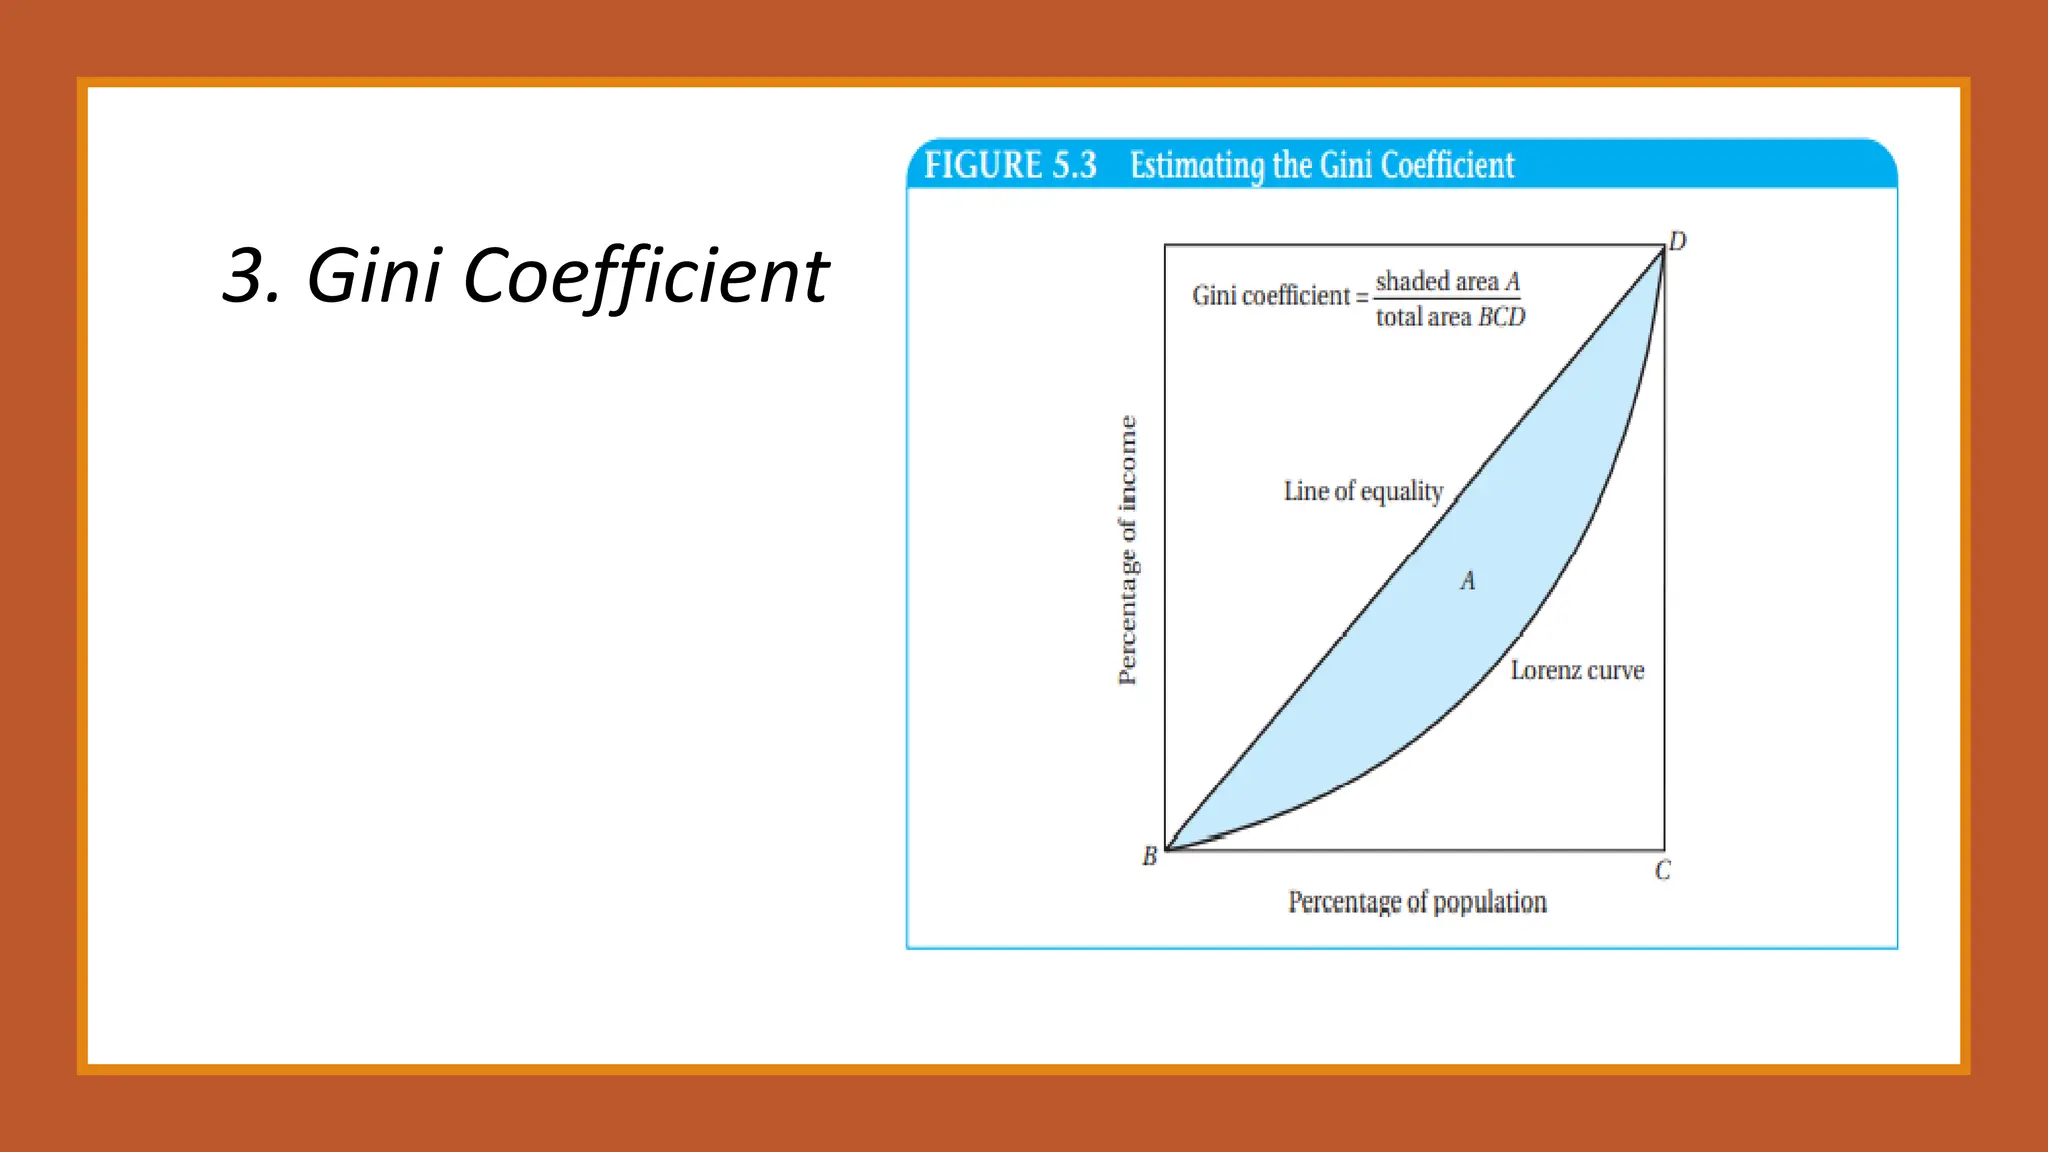
2. Lorenz Curve
1.Graphical representation of income or wealth distribution
developed by American economist Max Lorenz in 1905
2. It is drawn as cumulative income curve
3. A population is divided into quintiles
4.The richest quintile is the 20% of households with the highest
disposable income
5. Similarly, the poorest quintile is the 20% of households with the
lowest disposable income
11.
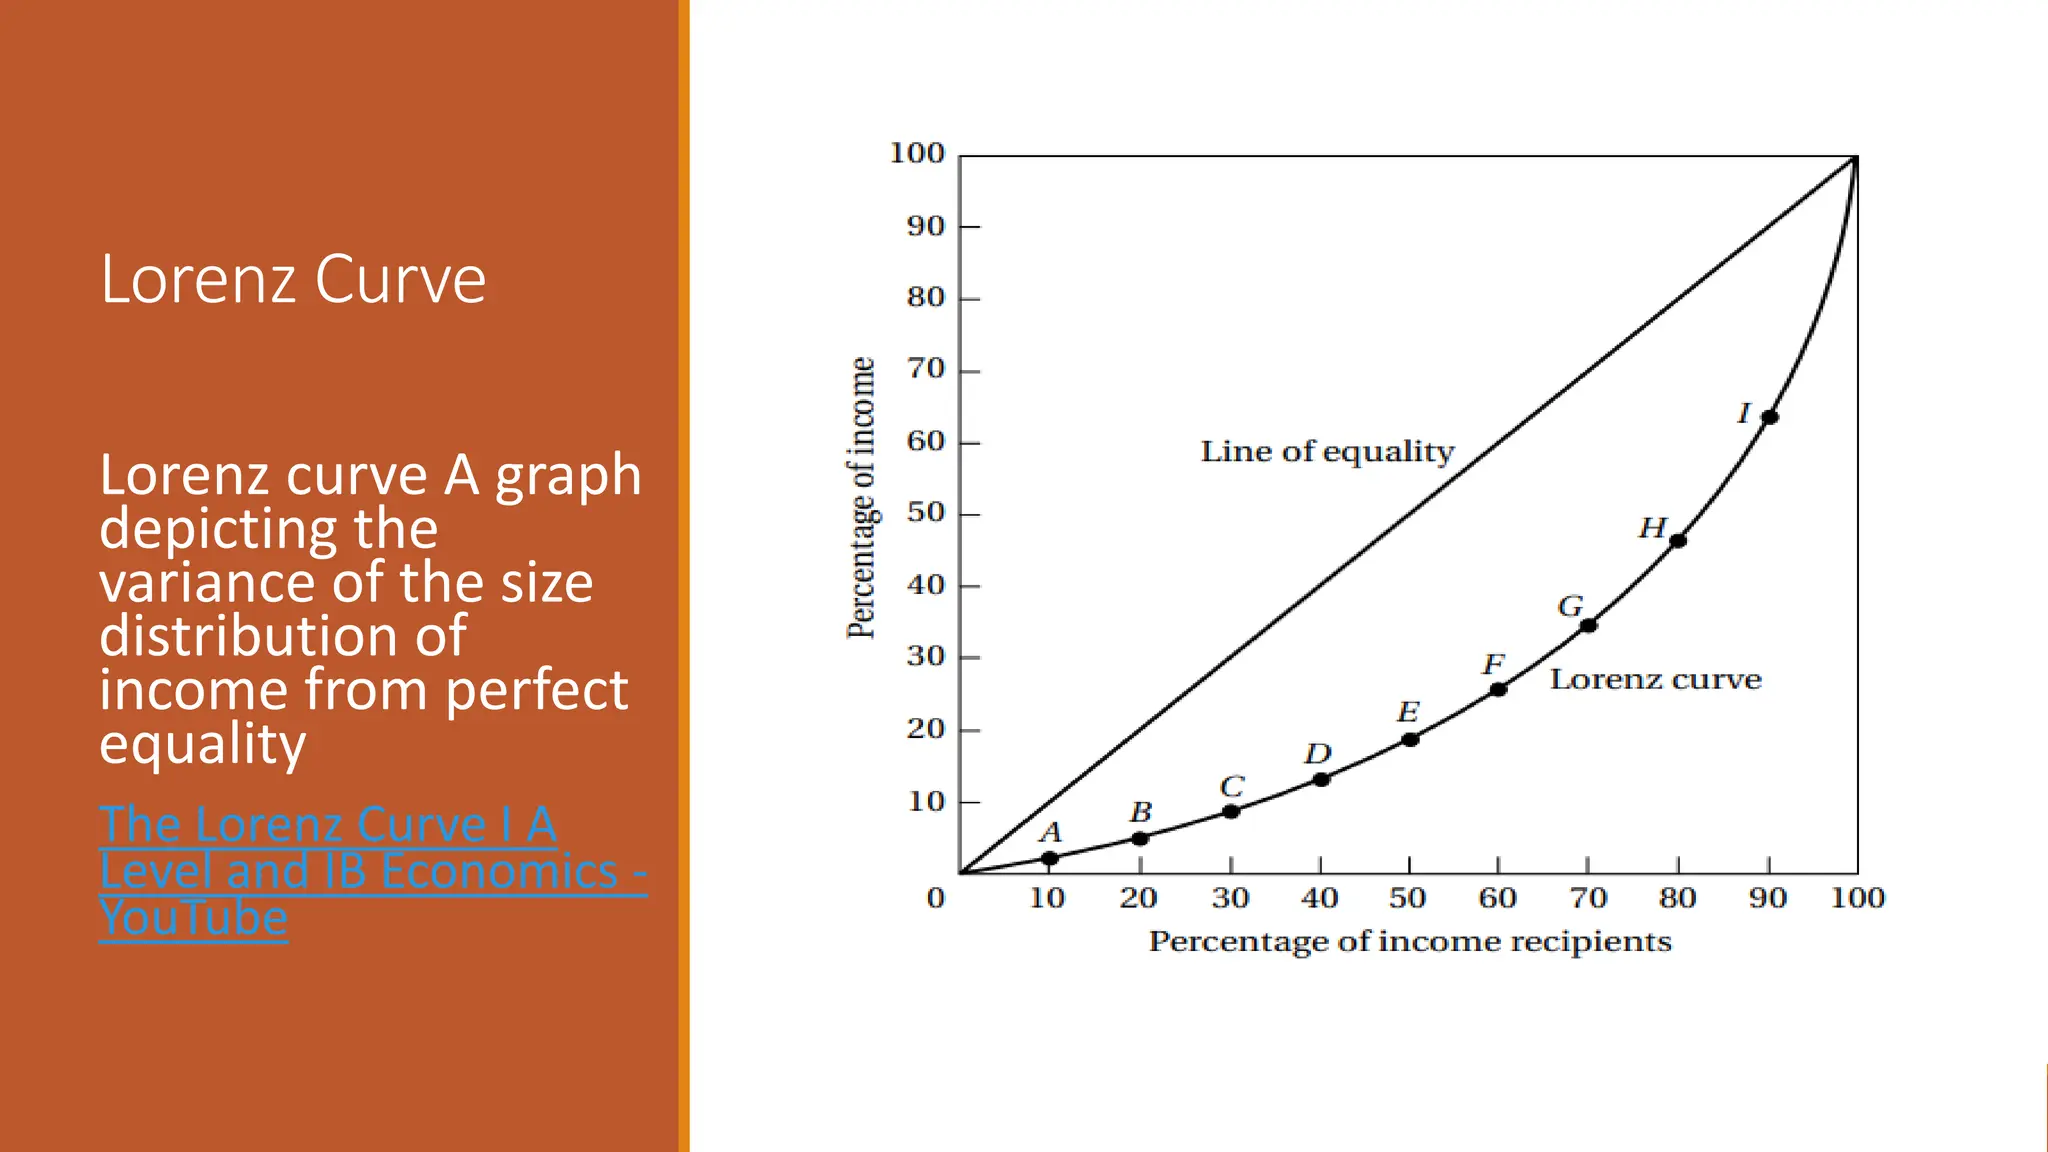
Lorenz Curve
Lorenz curveA graph
depicting the
variance of the size
distribution of
income from perfect
equality
The Lorenz Curve I A
Level and IB Economics -
YouTube
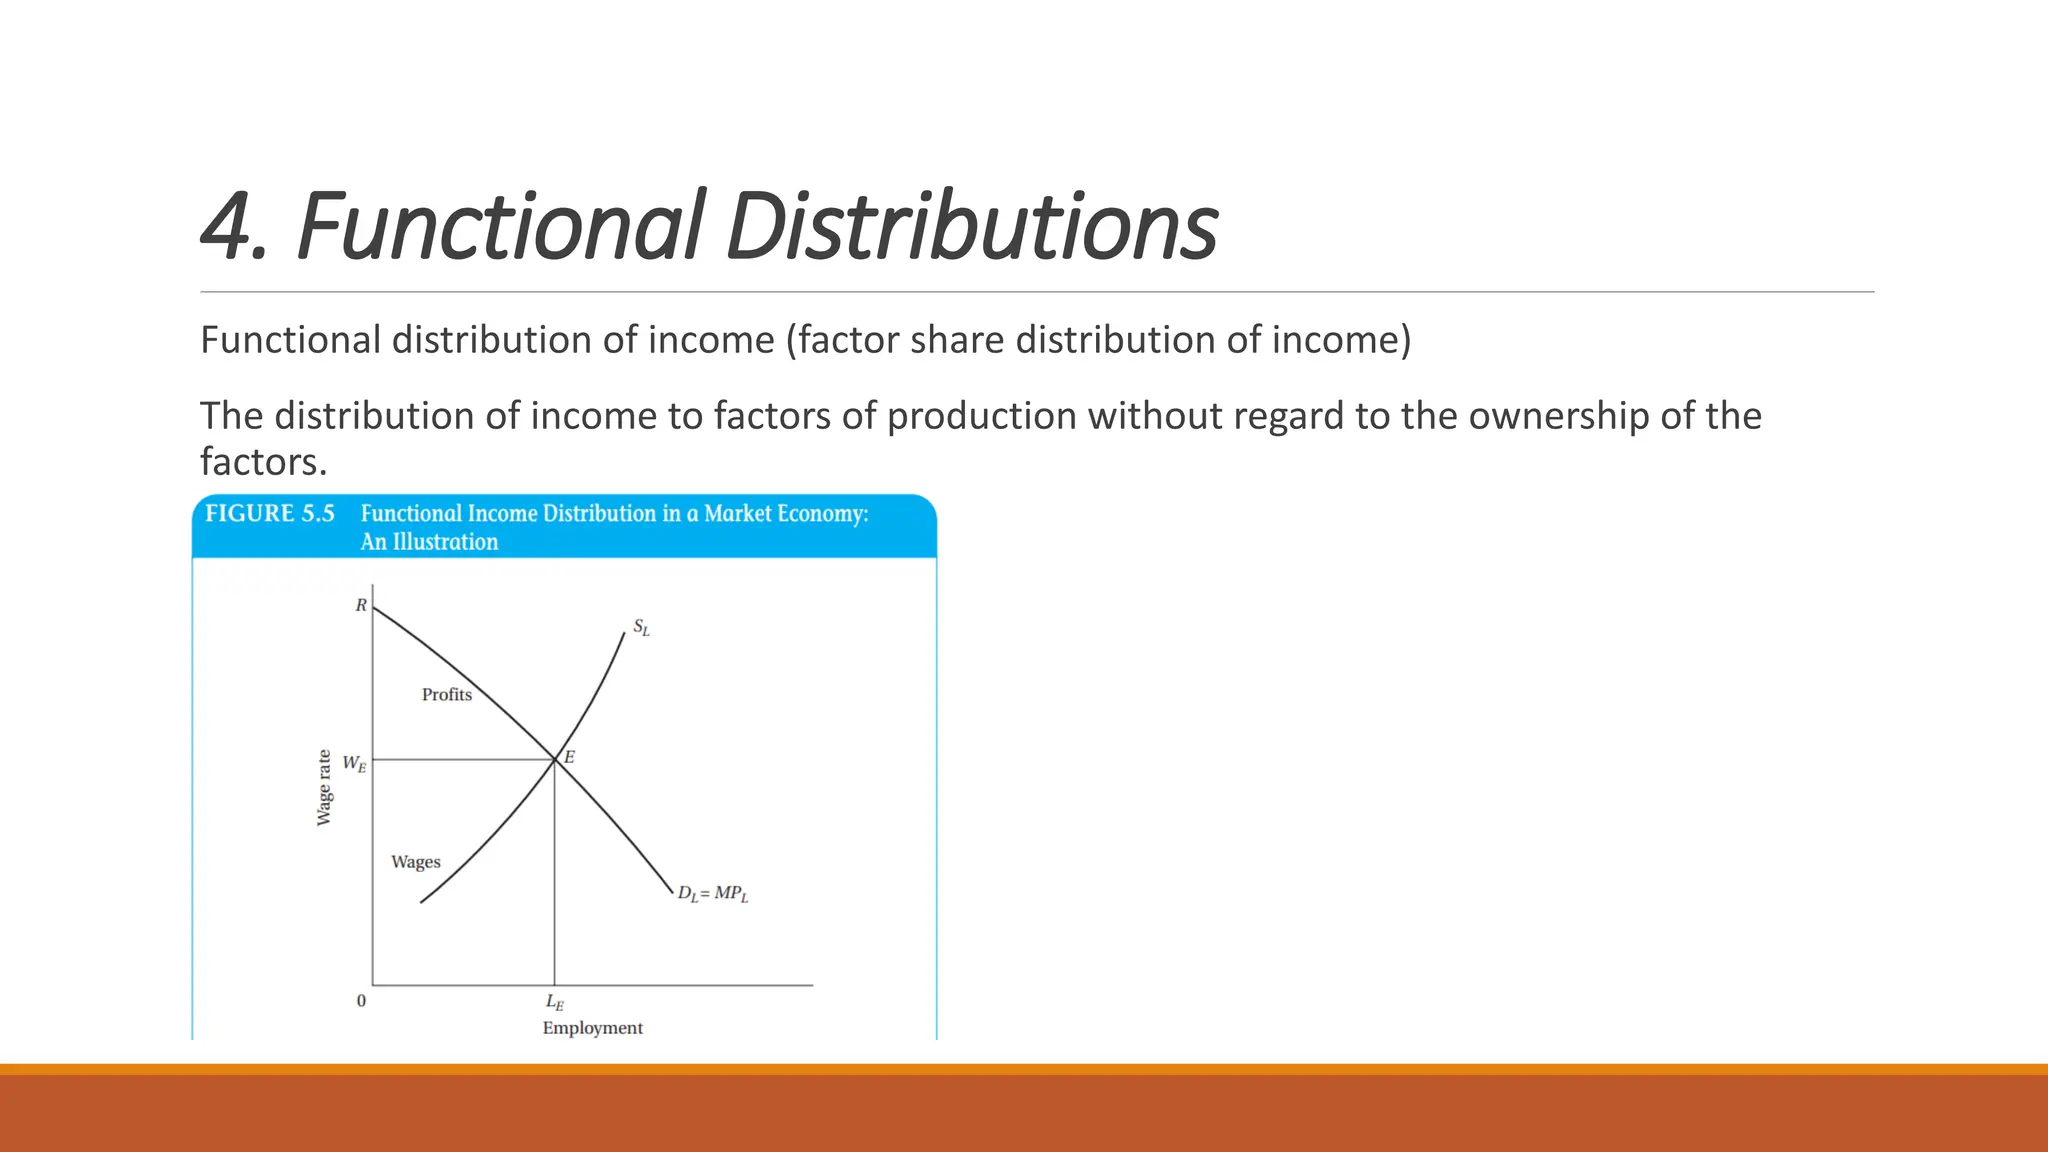
4. Functional Distributions
Functionaldistribution of income (factor share distribution of income)
The distribution of income to factors of production without regard to the ownership of the
factors.
17.
4. Functional Distributions
Functionaldistribution of income (factor share distribution of income)
The distribution of income to factors of production without regard to the ownership of the
factors.
18.
Desirable Properties forInequality
Measures
The anonymity principle simply means that our measure of inequality should
not depend on who has the higher income; for example, it should not depend
on whether we believe the rich or the poor to be good or bad people.
The scale independence principle means that our measure of inequality should
not depend on the size of the economy or the way we measure its income.
The population independence principle is somewhat similar it states that the
measure of inequality should not be based on the number of income recipients.
Transfer principle (sometimes called the Pigou-Dalton principle after its
creators); it states that, holding all other incomes constant, if we transfer some
income from a richer person to a poorer person (but not so much that the
poorer person is now richer than the originally rich person), the resulting new
income distribution is more equal.
19.
Measuring Absolute Poverty
Absolutepoverty is the number of people who are unable
to command sufficient resources to satisfy basic needs.
Lives below the international poverty line of less than $1.25
or $2 per day in PPP dollars.
Measured as headcount index H/N
Total poverty gap (TPG) it measures the total amount of
income necessary to raise everyone in the poverty line.
20.
Measuring Absolute Poverty
1.Total Poverty Gap (APG)
2. Average poverty gap (APG)
3..Average income shortfall (AIS)
4. Foster-Greer-Thorbecke index (FGT)
21.
Total Poverty Gap(TPG)/Average Poverty
Gap(APG)
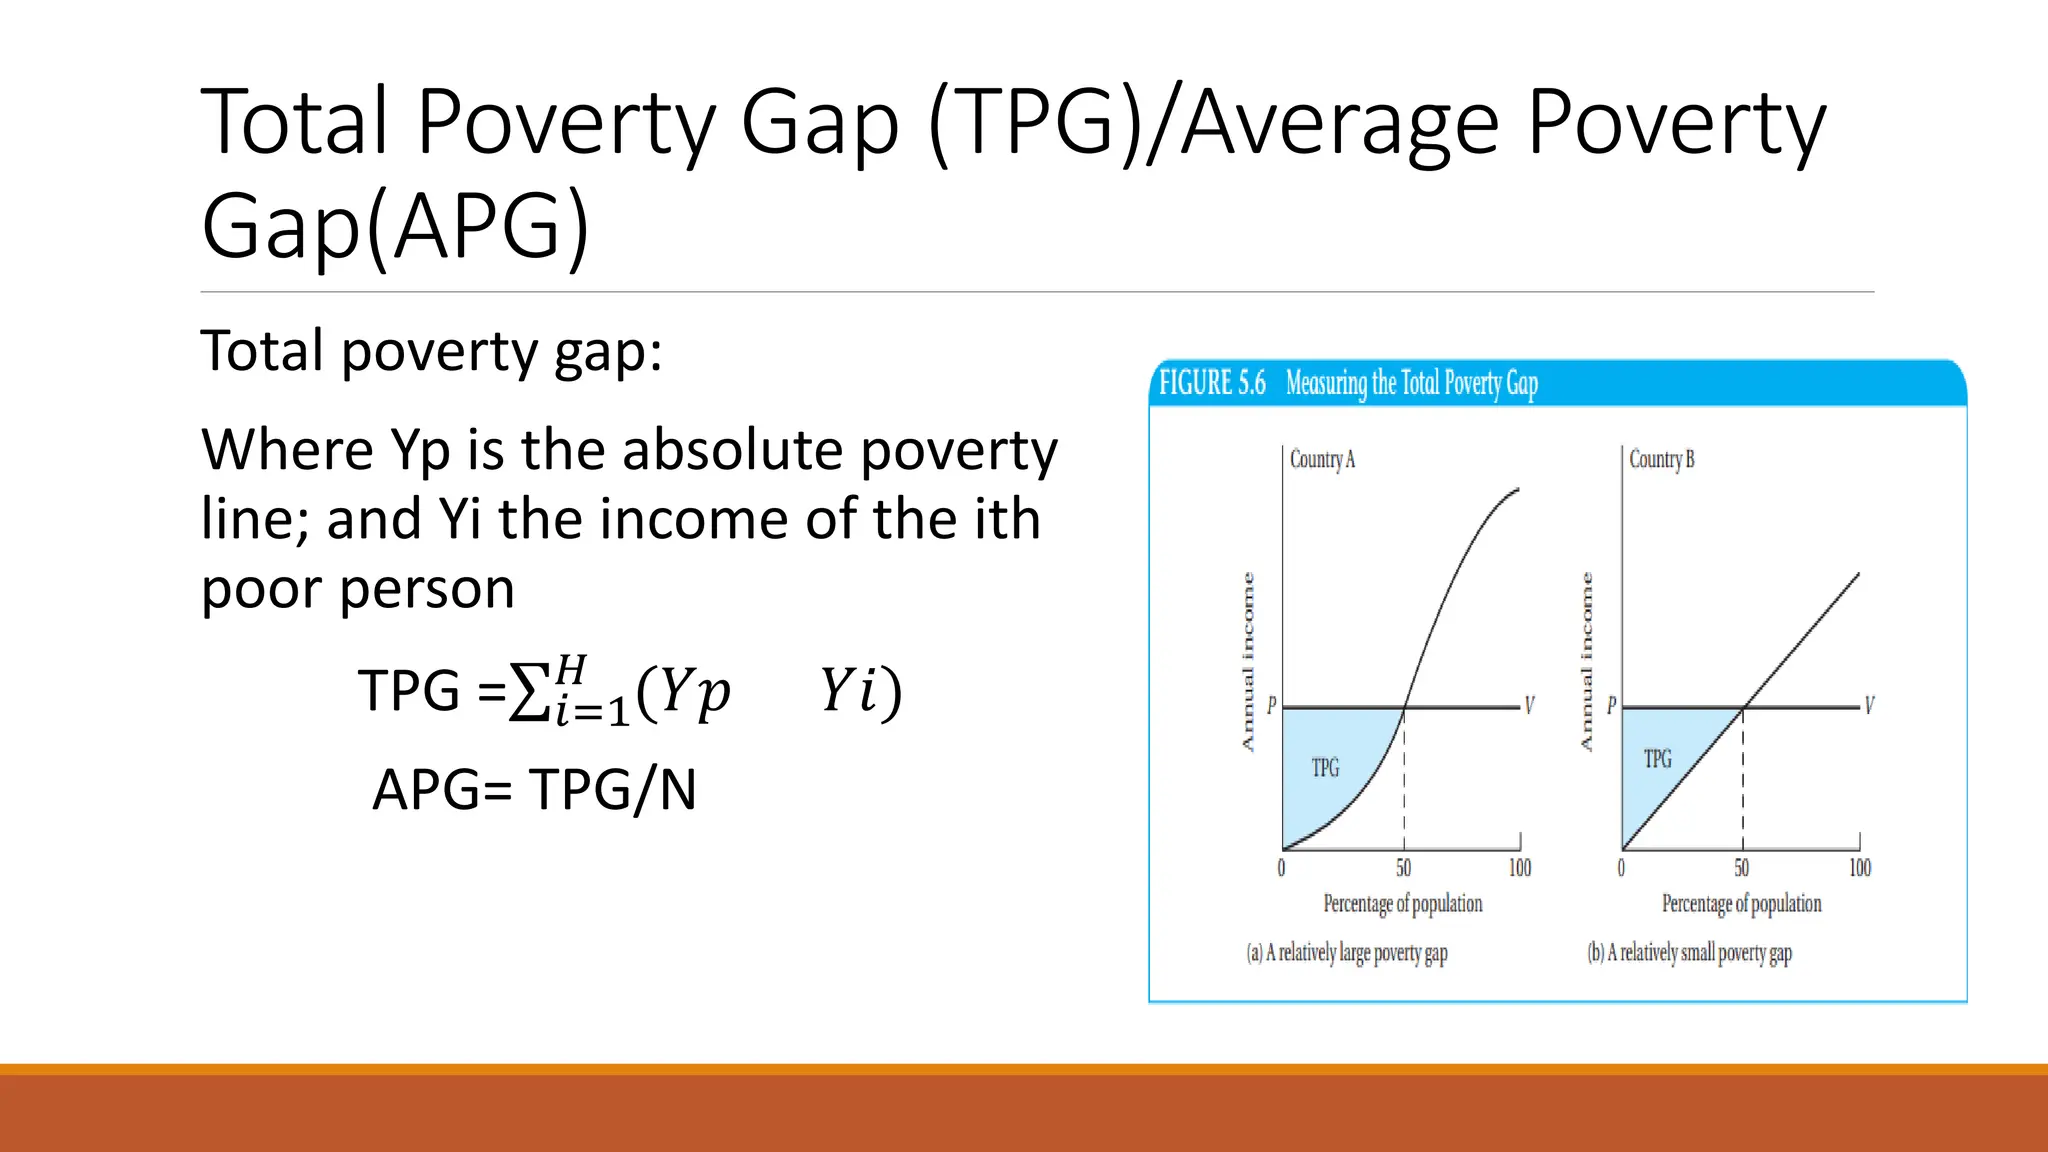
Total poverty gap:
Where Yp is the absolute poverty
line; and Yi the income of the ith
poor person
TPG =σ𝑖=1
𝐻
(𝑌𝑝 𝑌𝑖)
APG= TPG/N
22.
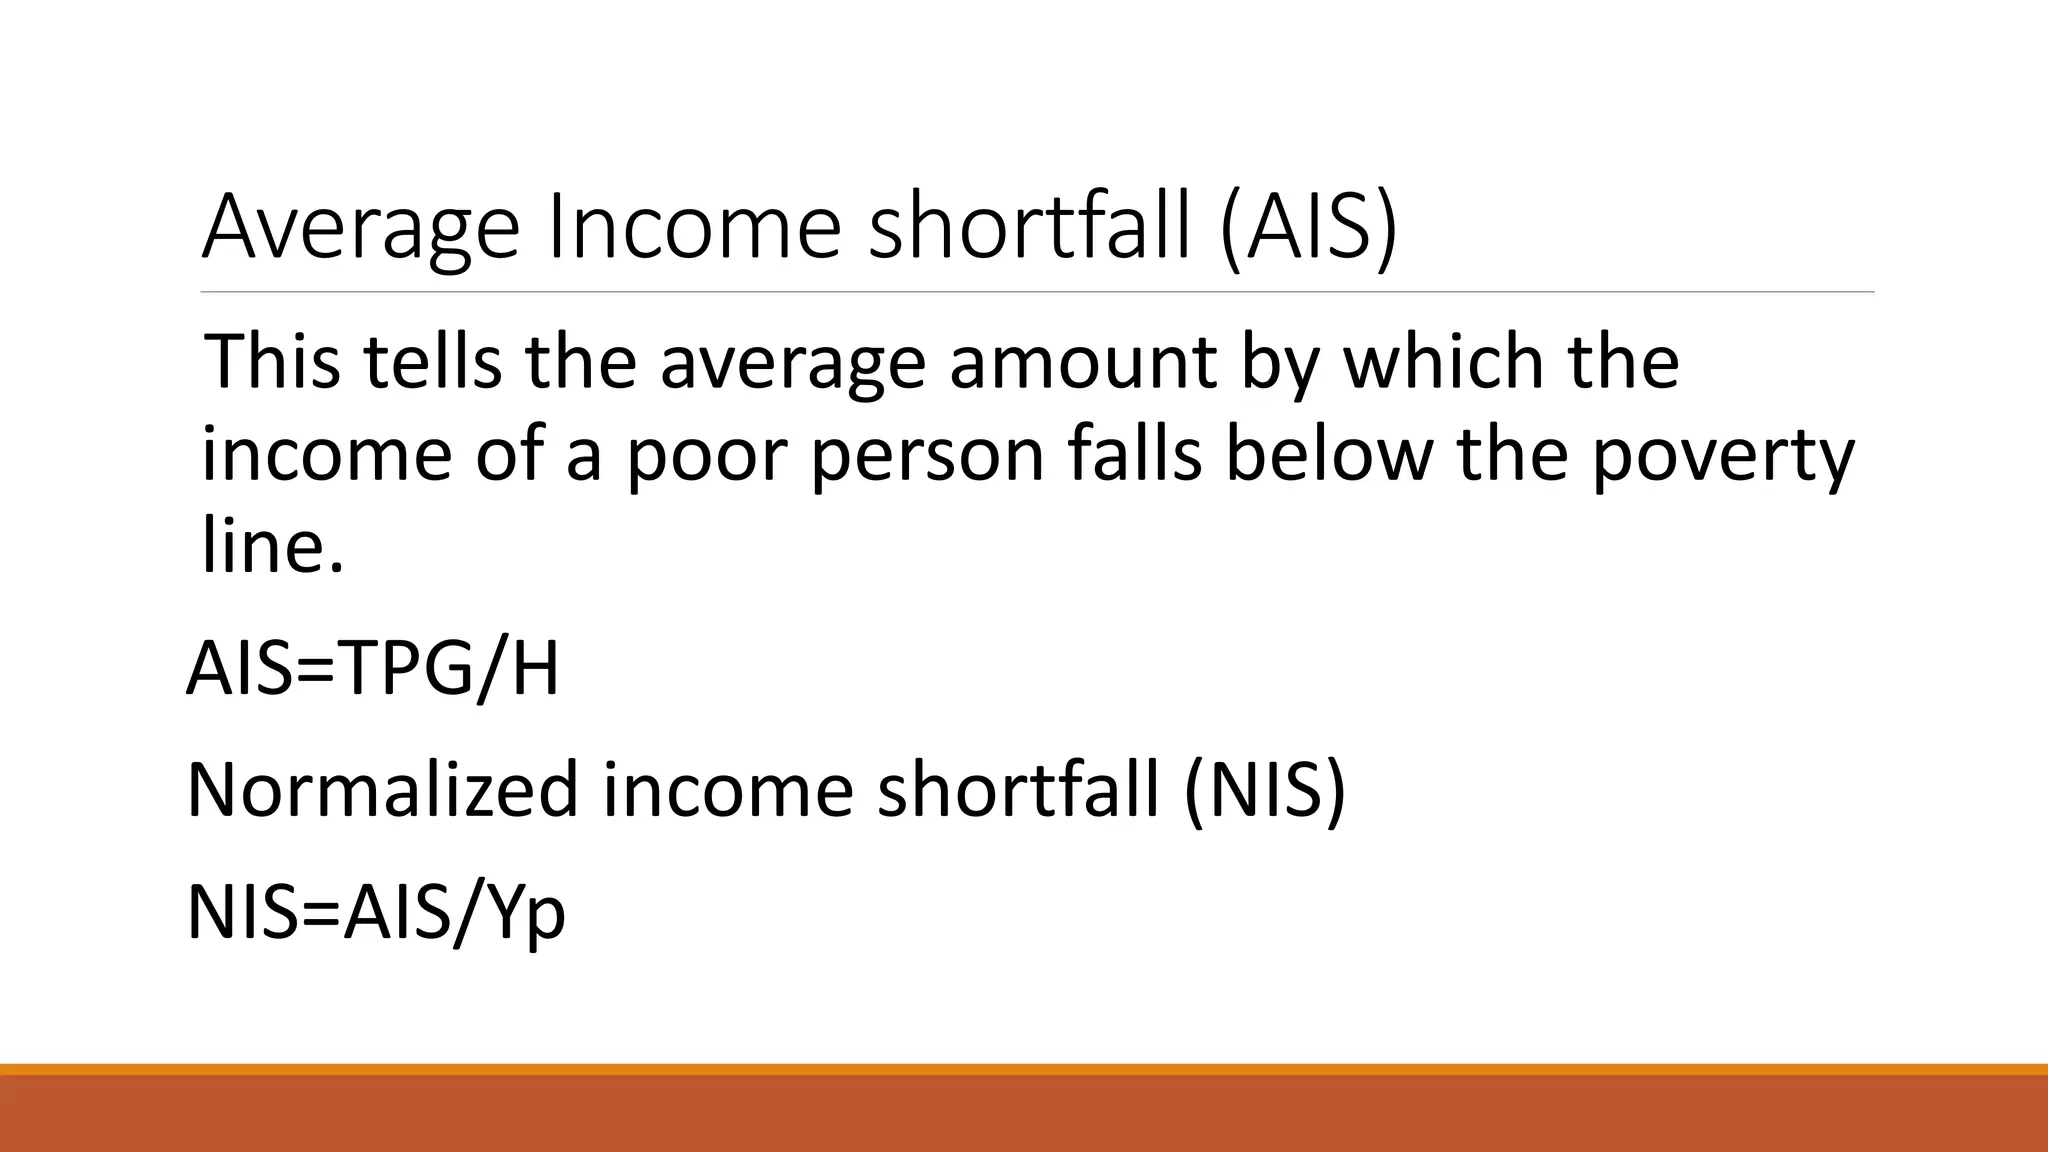
Average Income shortfall(AIS)
This tells the average amount by which the
income of a poor person falls below the poverty
line.
AIS=TPG/H
Normalized income shortfall (NIS)
NIS=AIS/Yp
23.
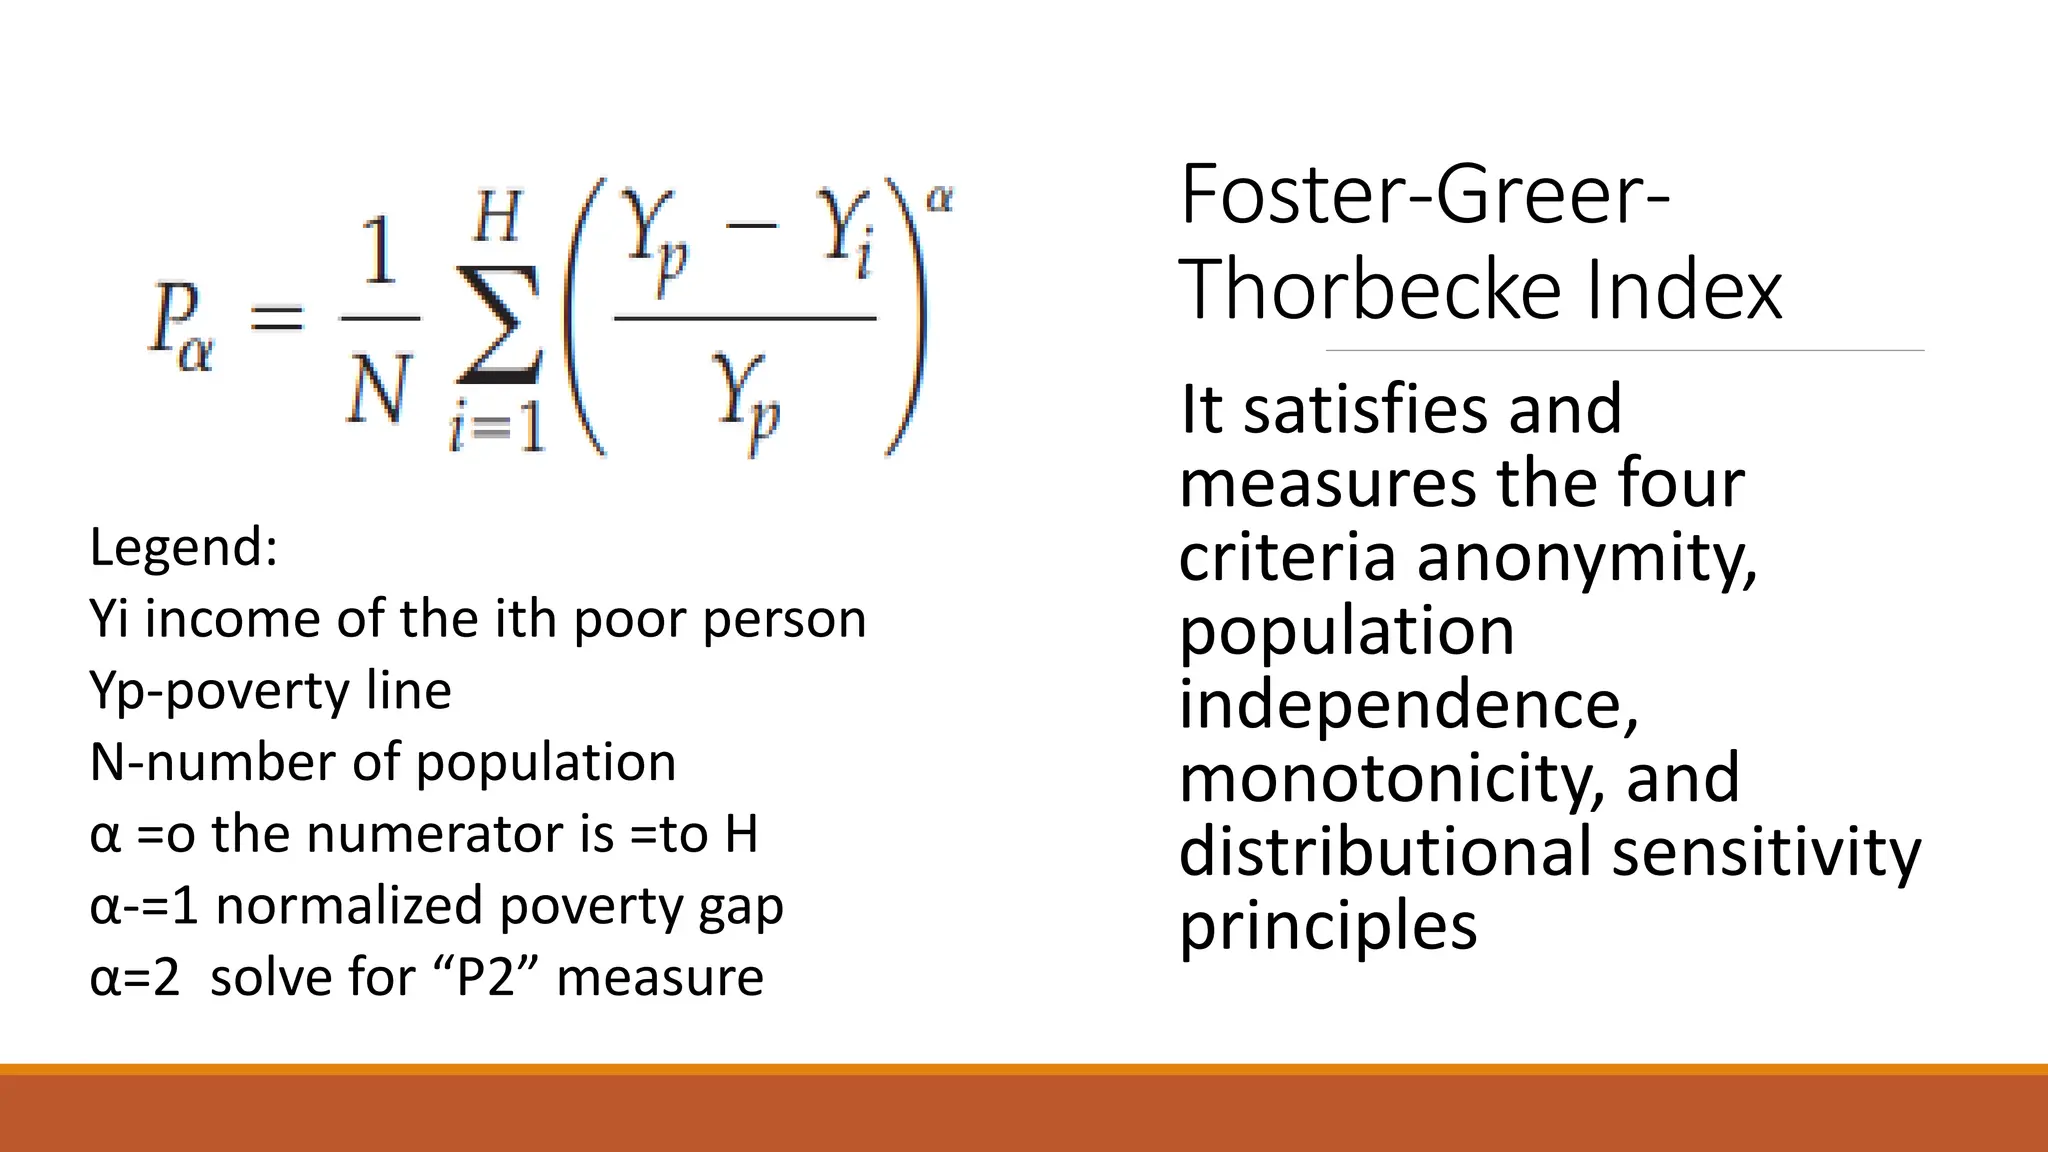
Foster-Greer-
Thorbecke Index
It satisfiesand
measures the four
criteria anonymity,
population
independence,
monotonicity, and
distributional sensitivity
principles
Legend:
Yi income of the ith poor person
Yp-poverty line
N-number of population
α =o the numerator is =to H
α-=1 normalized poverty gap
α=2 solve for “P2” measure
24.
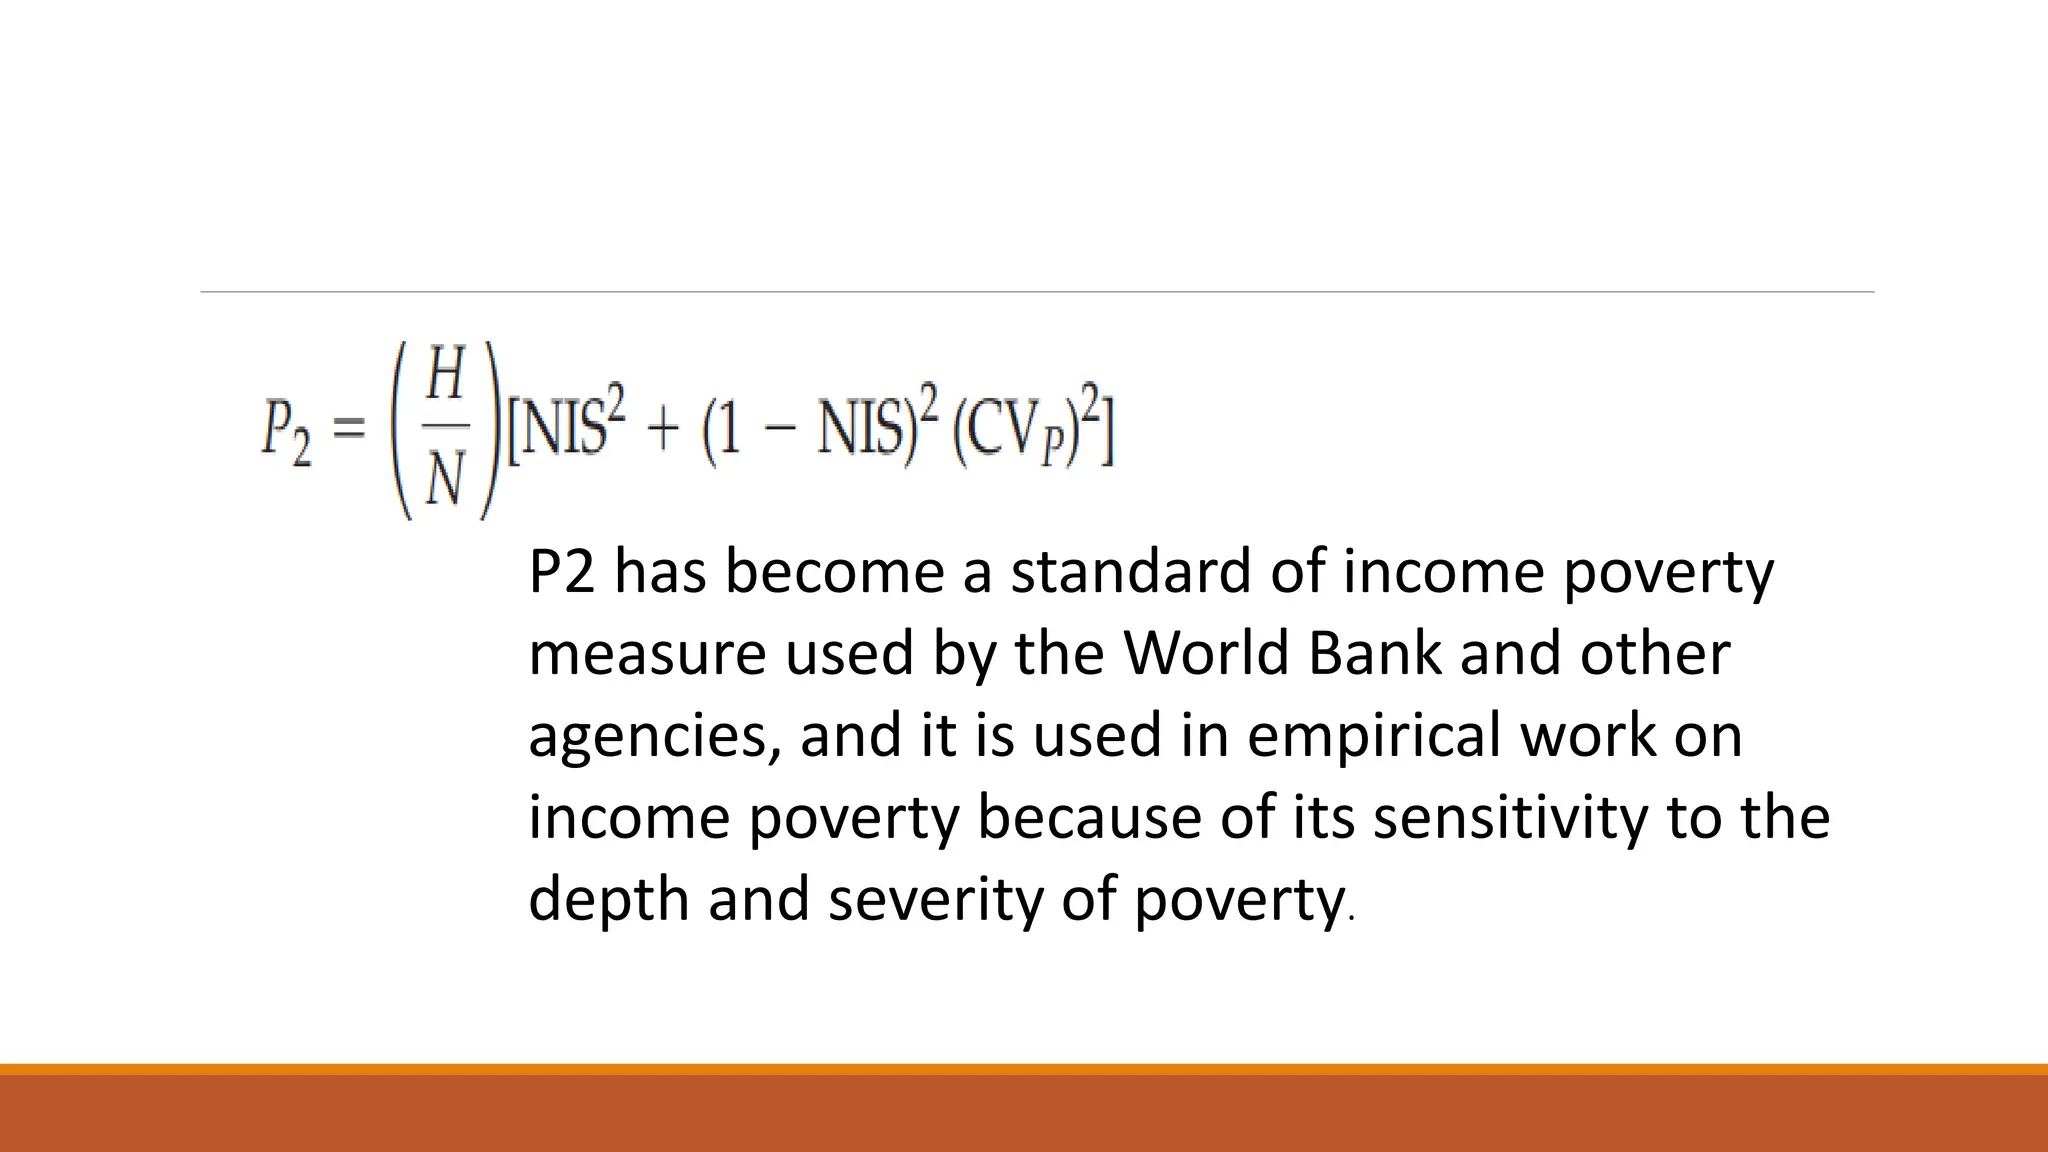
P2 has becomea standard of income poverty
measure used by the World Bank and other
agencies, and it is used in empirical work on
income poverty because of its sensitivity to the
depth and severity of poverty.
25.
The Newly IntroducedMultidimensional
Poverty Index
Identification of poverty status through a dual cutoff:
• First, cutoff levels within each dimension (analogous to falling
below a poverty line for example $1.25 per day for income
poverty);
• Second, cutoff in the number of dimensions in which a person
must be deprived (below a line) to be deemed mul5dimensionally
poor.
• MPI focuses on deprivations in health, education, and standard
of living; and each receives equal (that is one-third of the overall
total) weight.
26.
MPI Indicators
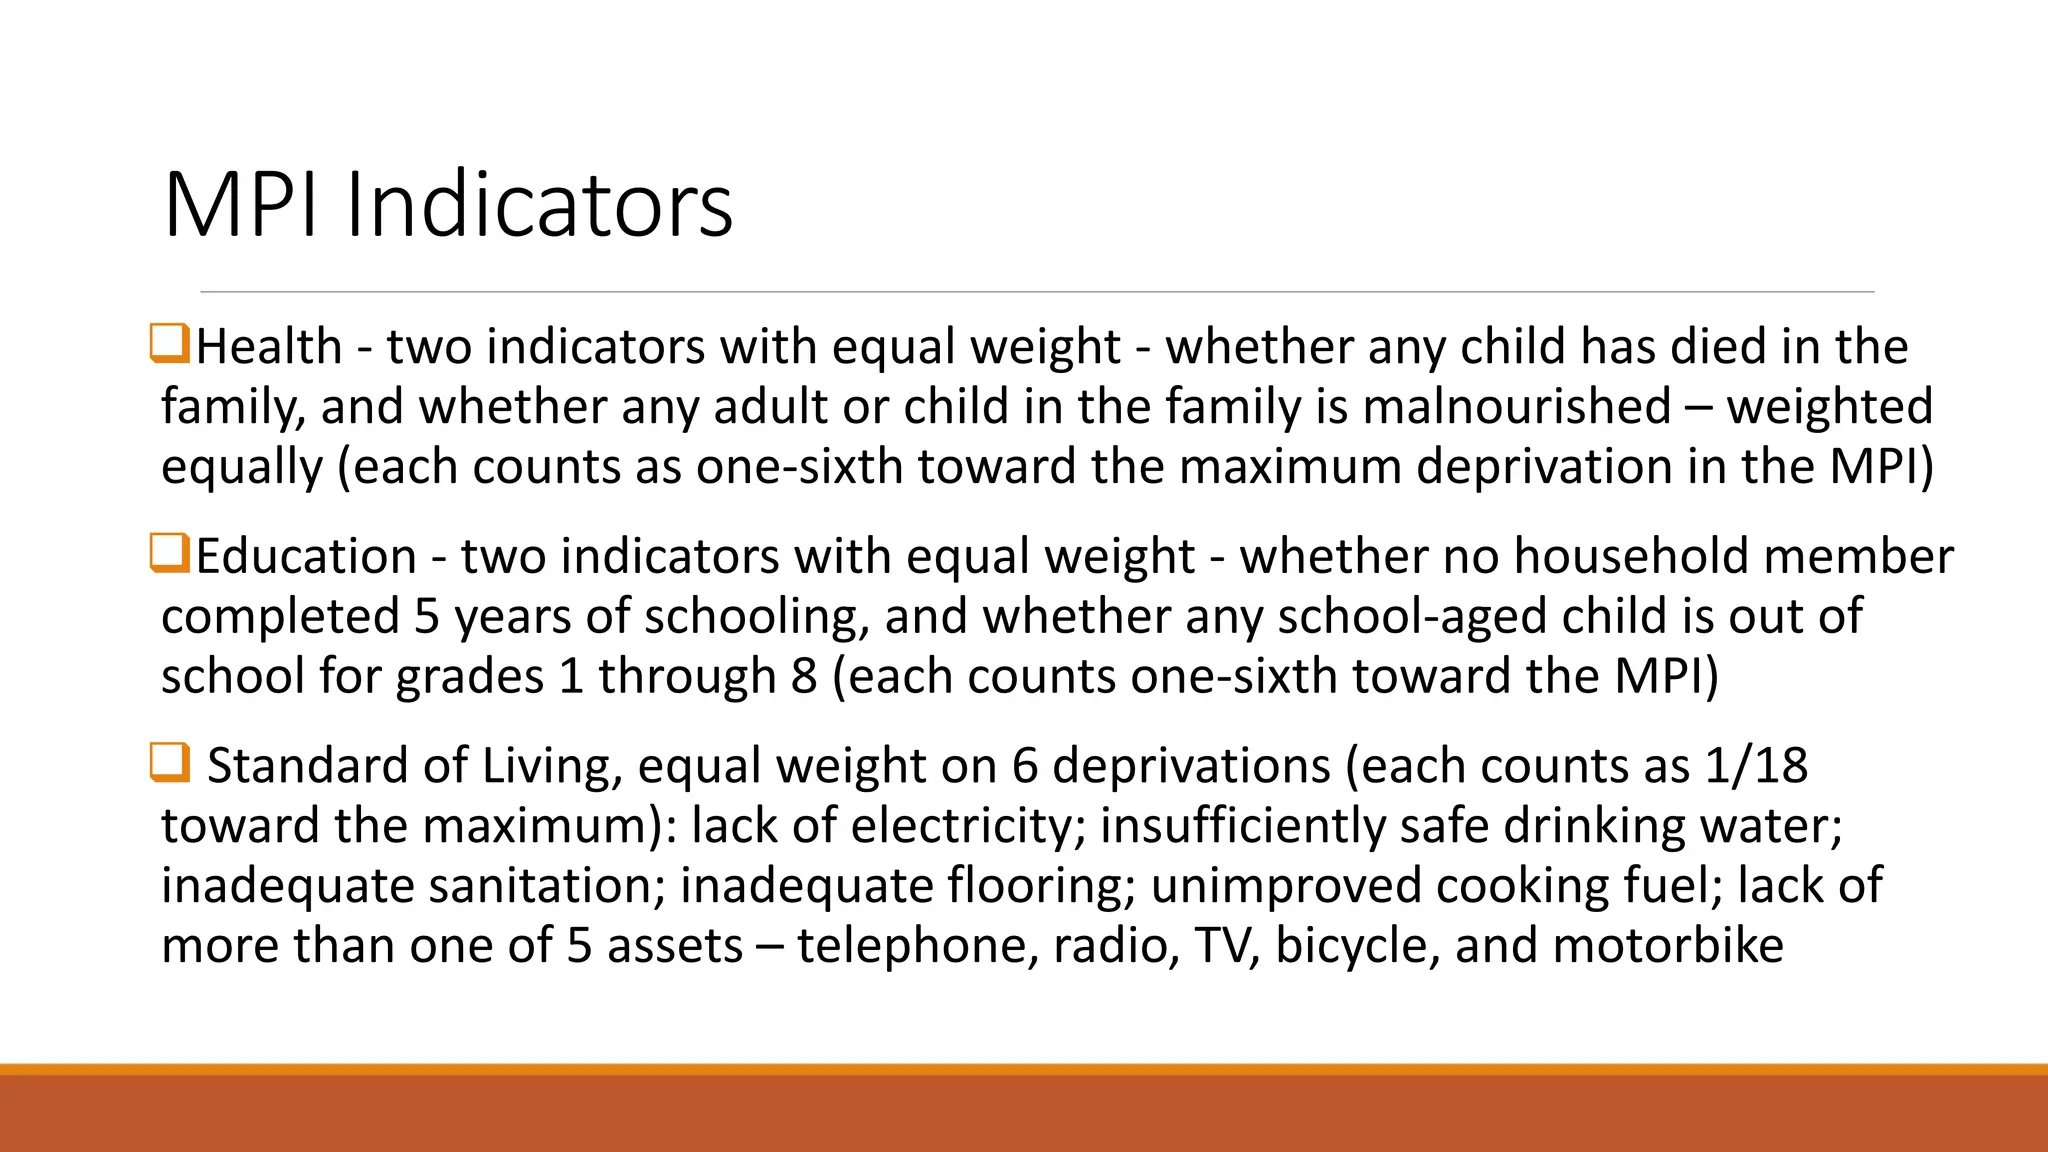
❑Health -two indicators with equal weight - whether any child has died in the
family, and whether any adult or child in the family is malnourished – weighted
equally (each counts as one-sixth toward the maximum deprivation in the MPI)
❑Education - two indicators with equal weight - whether no household member
completed 5 years of schooling, and whether any school-aged child is out of
school for grades 1 through 8 (each counts one-sixth toward the MPI)
❑ Standard of Living, equal weight on 6 deprivations (each counts as 1/18
toward the maximum): lack of electricity; insufficiently safe drinking water;
inadequate sanitation; inadequate flooring; unimproved cooking fuel; lack of
more than one of 5 assets – telephone, radio, TV, bicycle, and motorbike
27.
Interaction of thedeprivations?
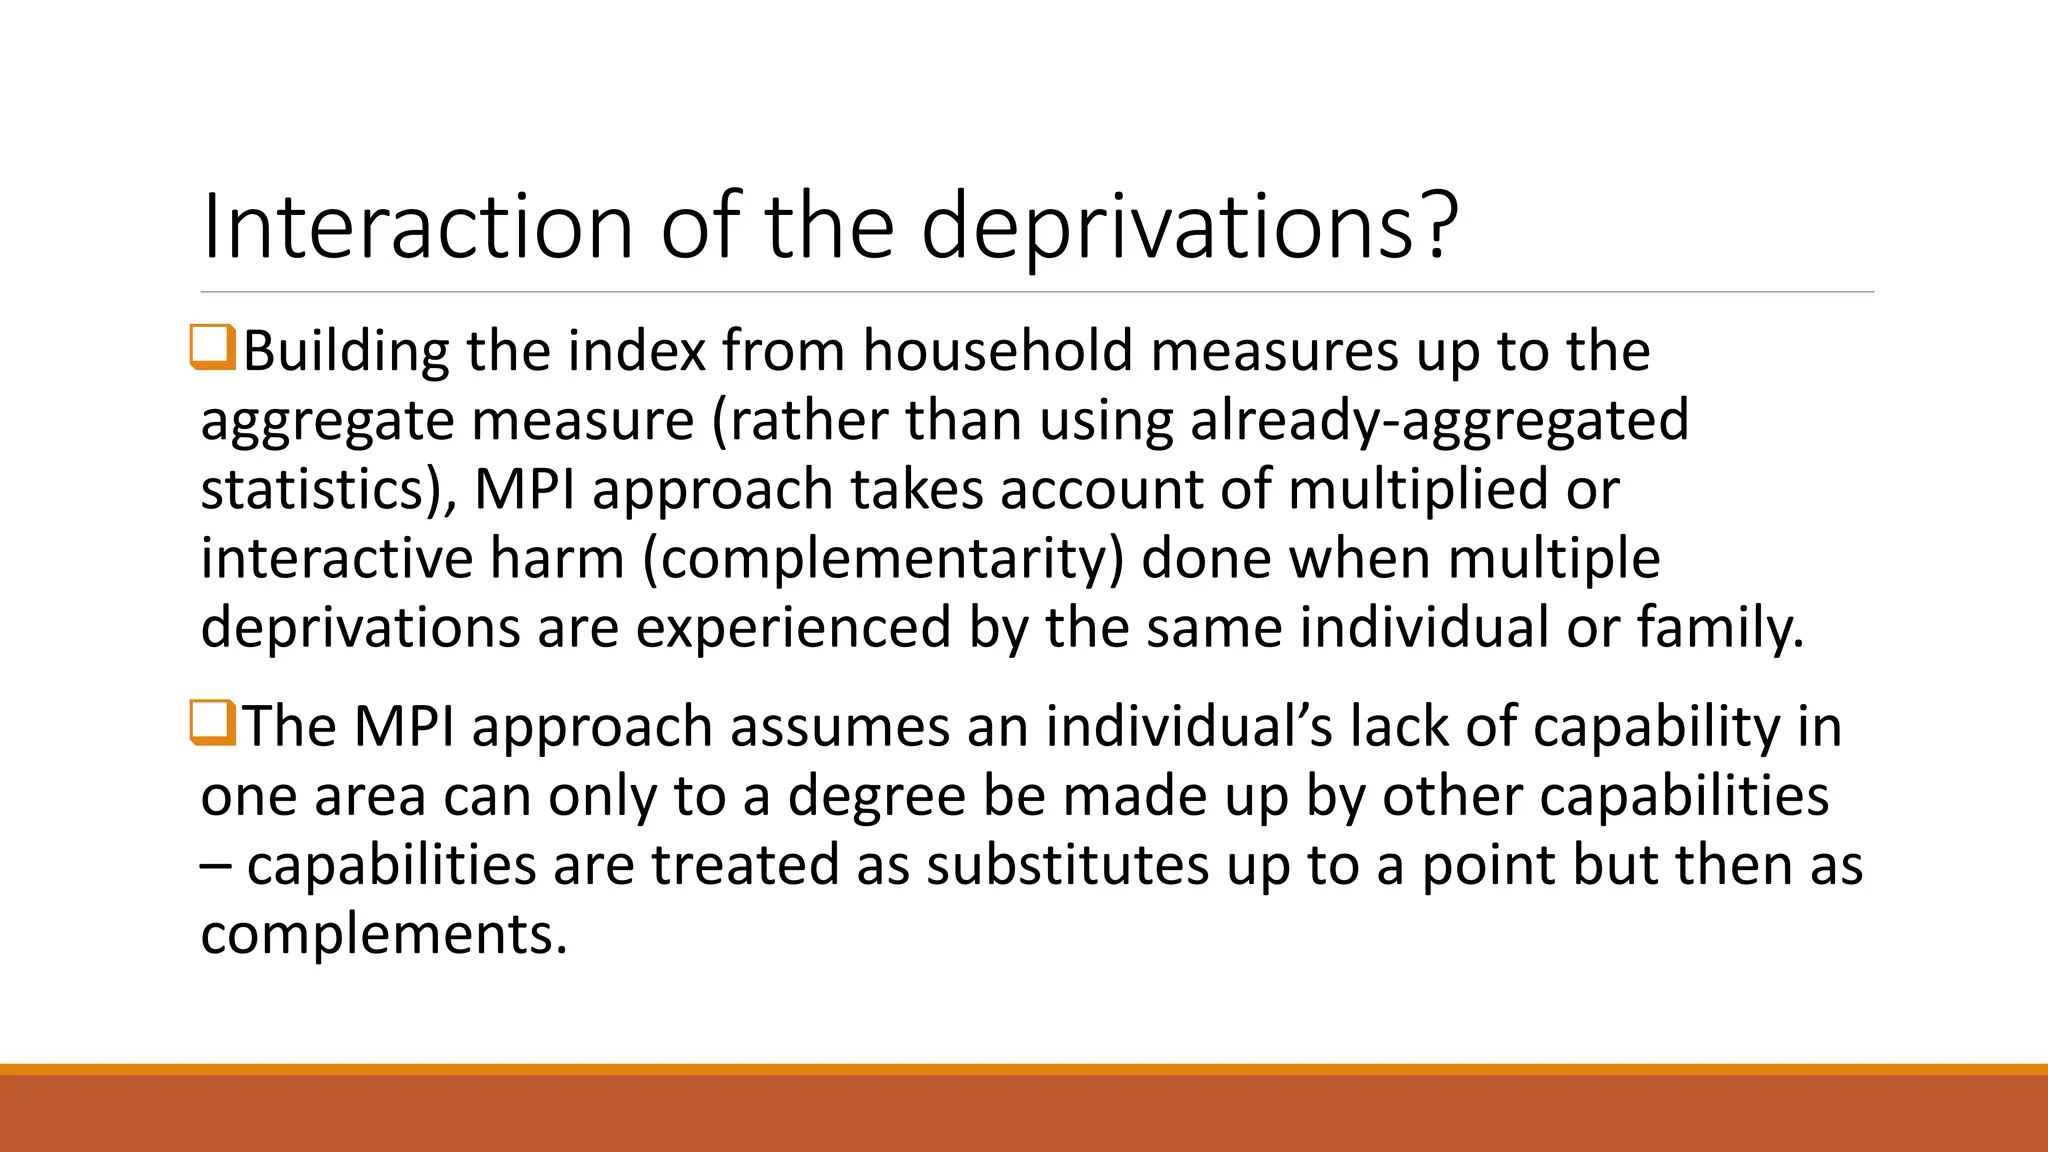
❑Building the index from household measures up to the
aggregate measure (rather than using already-aggregated
statistics), MPI approach takes account of multiplied or
interactive harm (complementarity) done when multiple
deprivations are experienced by the same individual or family.
❑The MPI approach assumes an individual’s lack of capability in
one area can only to a degree be made up by other capabilities
– capabilities are treated as substitutes up to a point but then as
complements.
28.
Computing for MPI
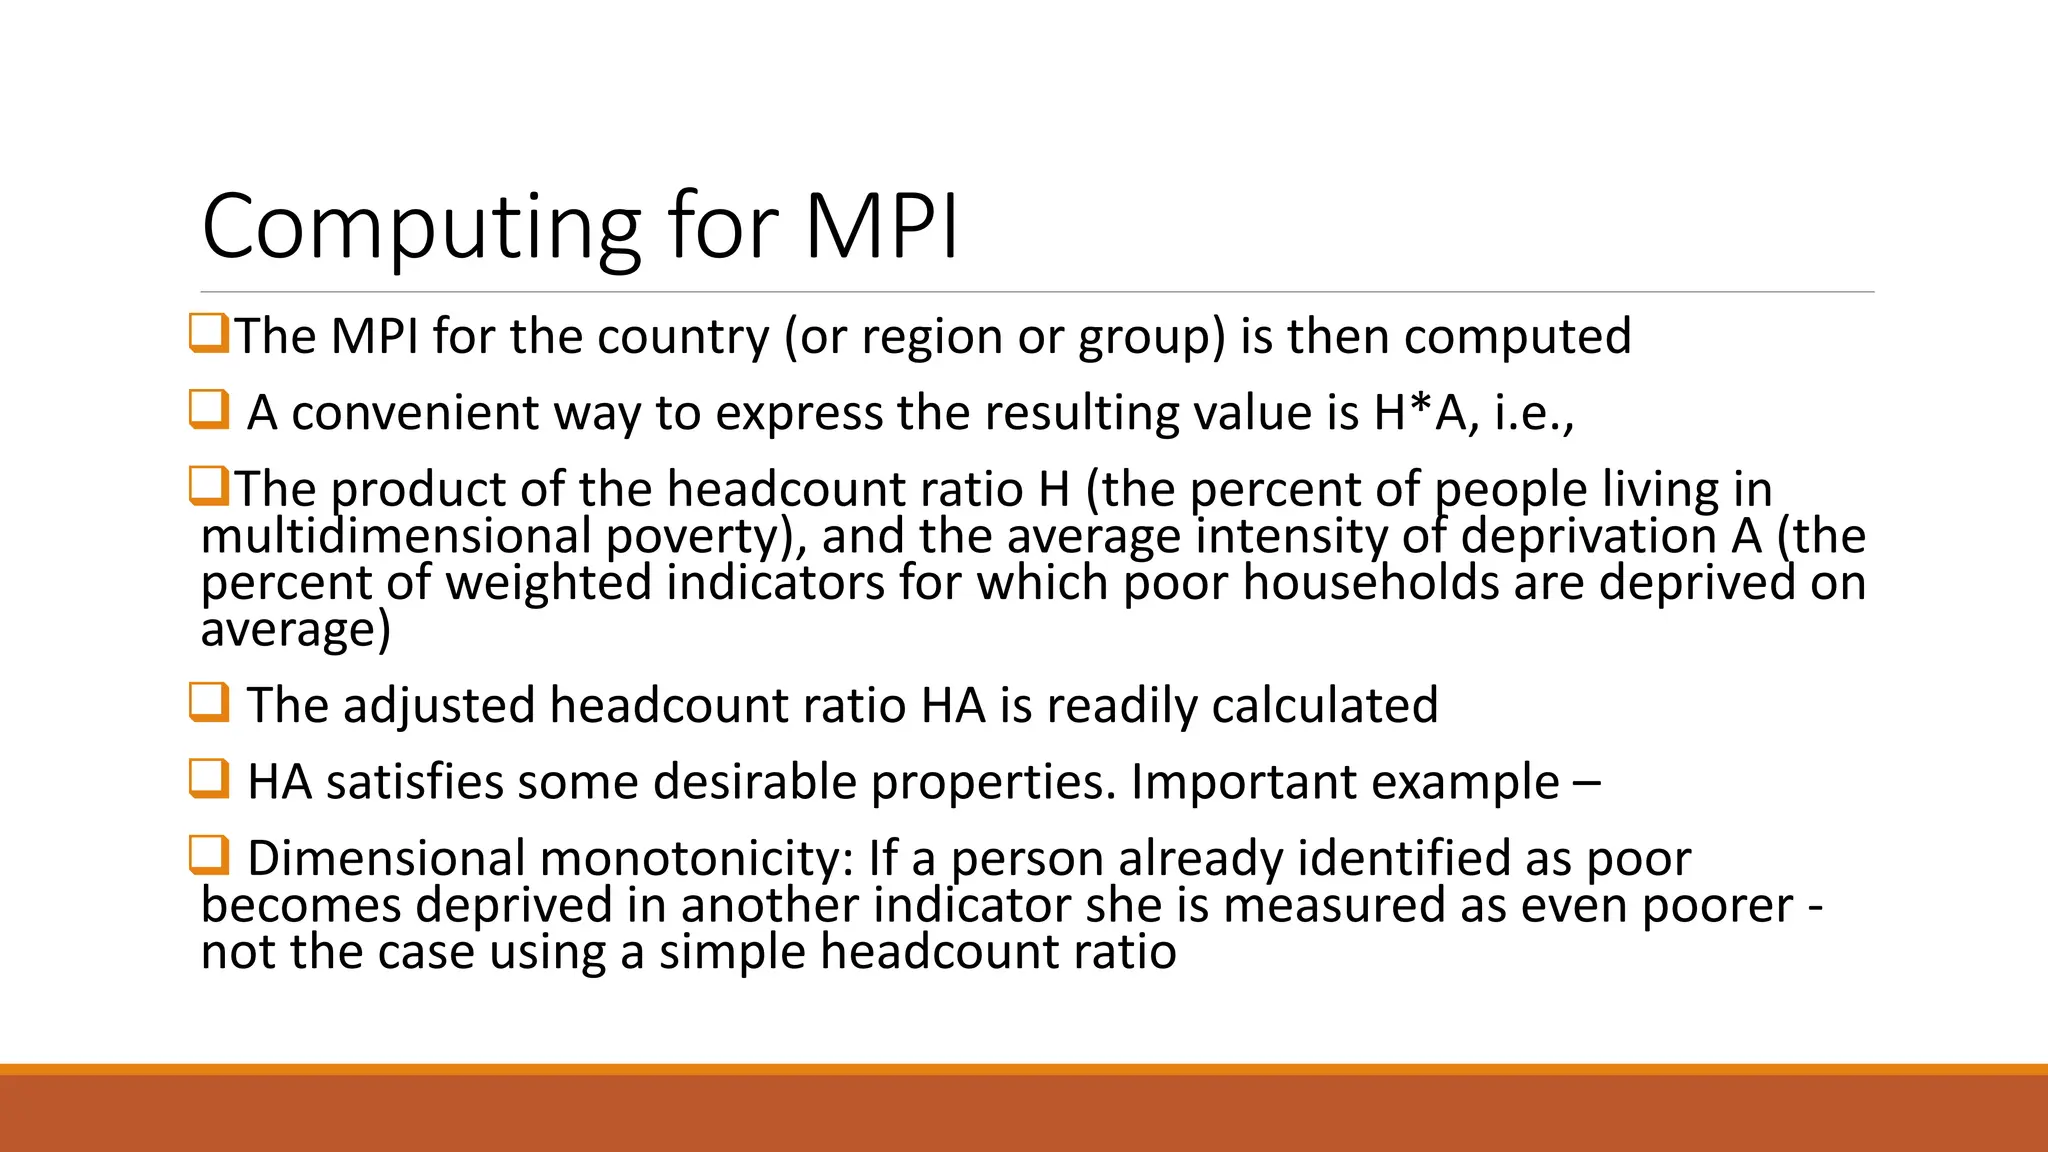
❑TheMPI for the country (or region or group) is then computed
❑ A convenient way to express the resulting value is H*A, i.e.,
❑The product of the headcount ratio H (the percent of people living in
multidimensional poverty), and the average intensity of deprivation A (the
percent of weighted indicators for which poor households are deprived on
average)
❑ The adjusted headcount ratio HA is readily calculated
❑ HA satisfies some desirable properties. Important example –
❑ Dimensional monotonicity: If a person already identified as poor
becomes deprived in another indicator she is measured as even poorer -
not the case using a simple headcount ratio
29.
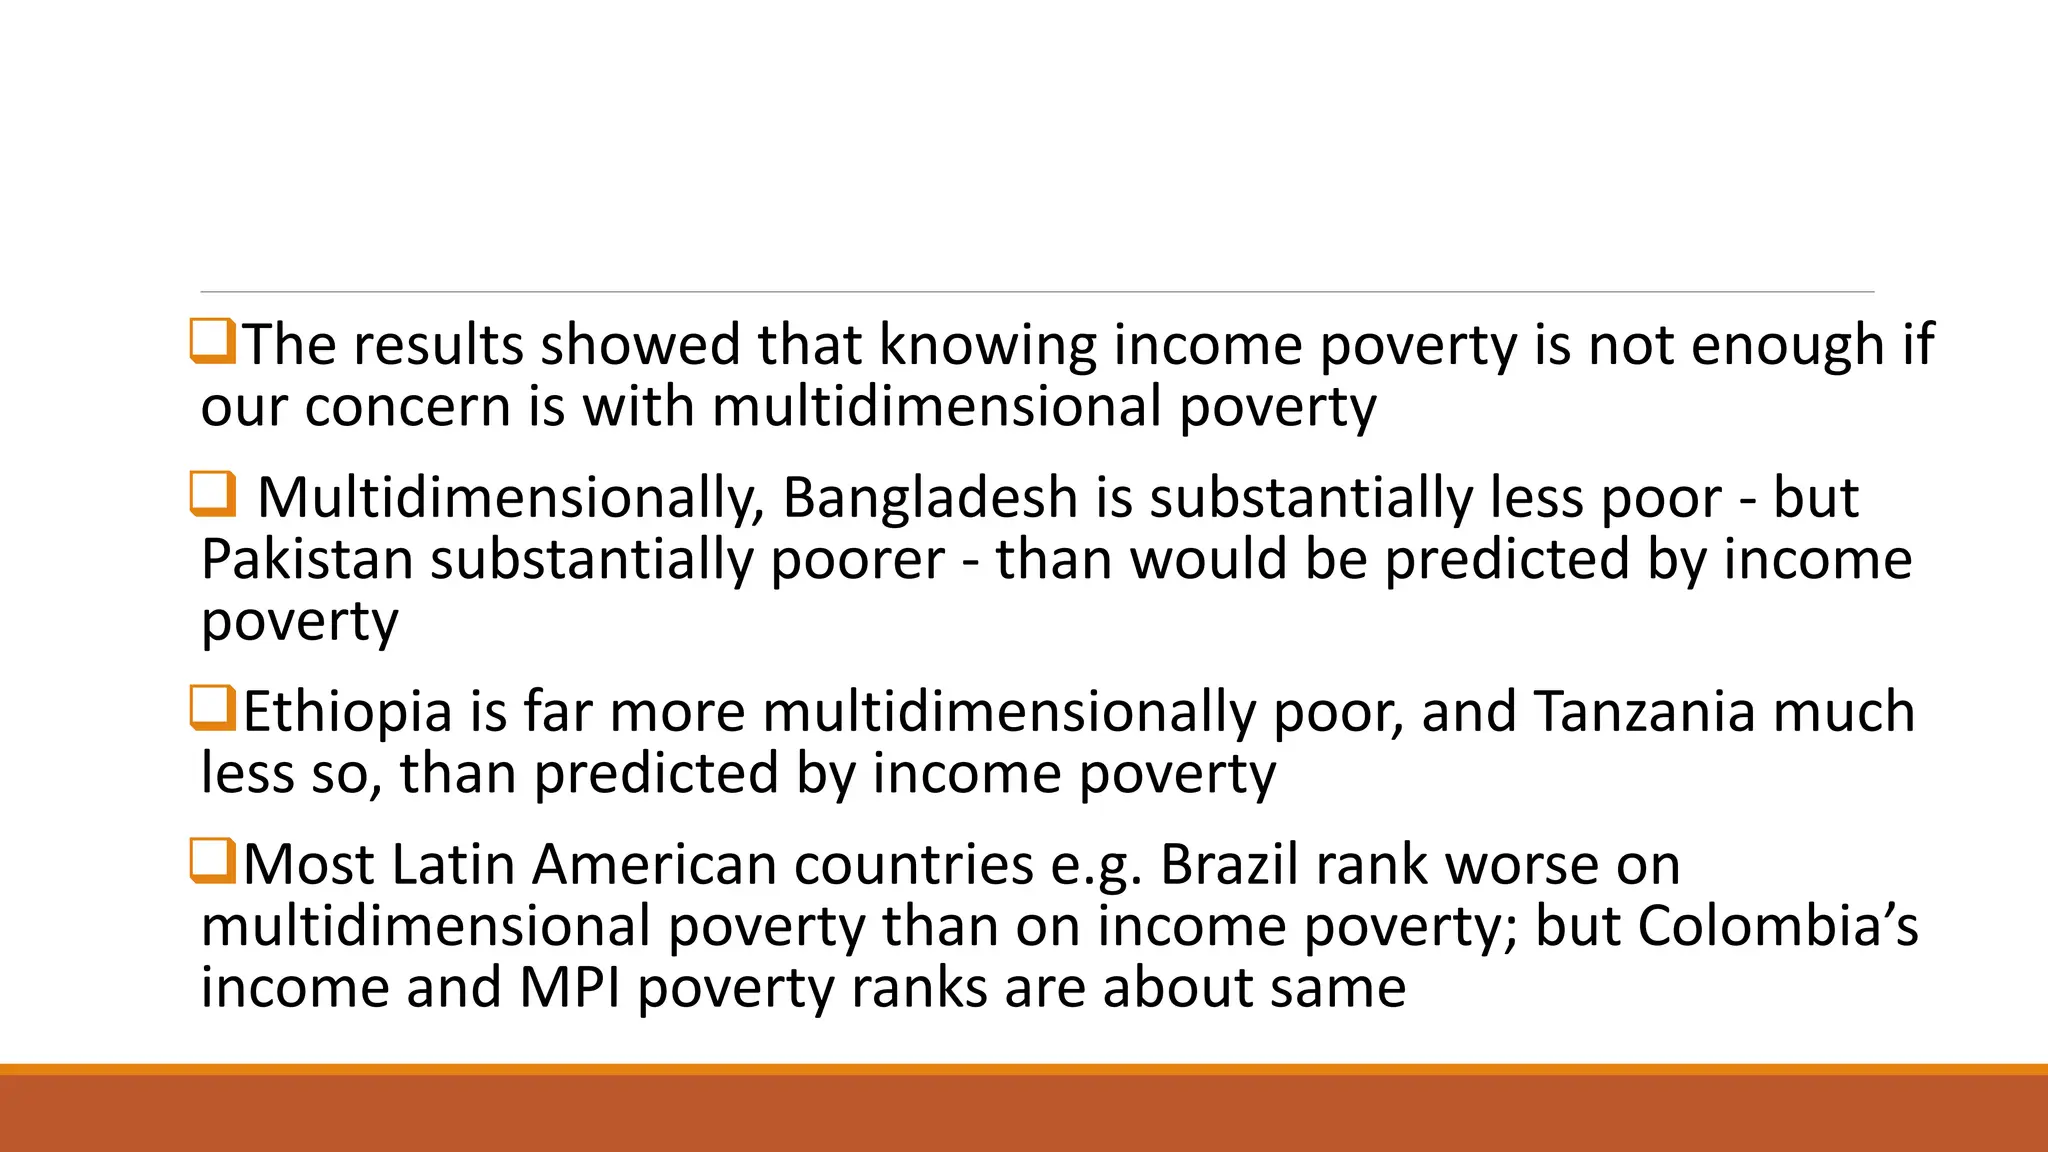
❑The results showedthat knowing income poverty is not enough if
our concern is with multidimensional poverty
❑ Multidimensionally, Bangladesh is substantially less poor - but
Pakistan substantially poorer - than would be predicted by income
poverty
❑Ethiopia is far more multidimensionally poor, and Tanzania much
less so, than predicted by income poverty
❑Most Latin American countries e.g. Brazil rank worse on
multidimensional poverty than on income poverty; but Colombia’s
income and MPI poverty ranks are about same
31.
Poverty reduction maycause growth
• Inclusive growth can cause poverty reduction, directly and indirectly
• Less appreciated: Poverty reduction can cause growth and development,
while failure to address poverty can constrain prospects for development
because:
• Although small, poverty income is part of total income
– Programs that raise productivity of poor directly even at small scale has
direct contribution to growth; but tiny increments because incomes are so
low; and has an opportunity costs
• Poor health, nutrition, and education lowers economic productivity of
people in poverty, leading directly and indirectly to slower growth
32.
Poverty reduction maycause growth
• Often, the poor lack access to credit, which constrains
growth, e.g.: – Lost opportunities for entrepreneurship
which may benefit society – Leaves them unable to finance
their children’s education, also limiting the skilled labor
force needed for development – Incentives for high fertility
as a source of old-age financial security
• Higher income for the poor raises demand for locally
produced goods
• Social exclusion/injustice, which is associated with
poverty, also likely causes economic stagnation:
33.
Social exclusion/injustice, associatedwith
poverty, likely causes economic stagnation
Social exclusion/injustice, which is associated with poverty, also likely causes
economic stagnation in the long run
– Political and social reform needed to overcome constraints to access to land,
water, basic resource- based livelihood opportunities
– Elite control of natural resources translates to social and political power to protect
elite interests that may be inconsistent with modernization
– Inadequate voice for the poor who know their public goods needs
– Other features of a broader social justice agenda which as many have pointed out
is also a foundation of economic efficiency
– The poor may be susceptible or coercible to participating in civil conflict
– Among its other benefits improved social justice may positively contribute to
growth
34.
Economic Characteristics ofHigh Poverty
Groups
❑Rural poverty
❑Women and poverty
❑Ethnic minorities, indigenous populations, and
poverty
35.
Workfare vs Welfare?Basic cost
effectiveness considerations
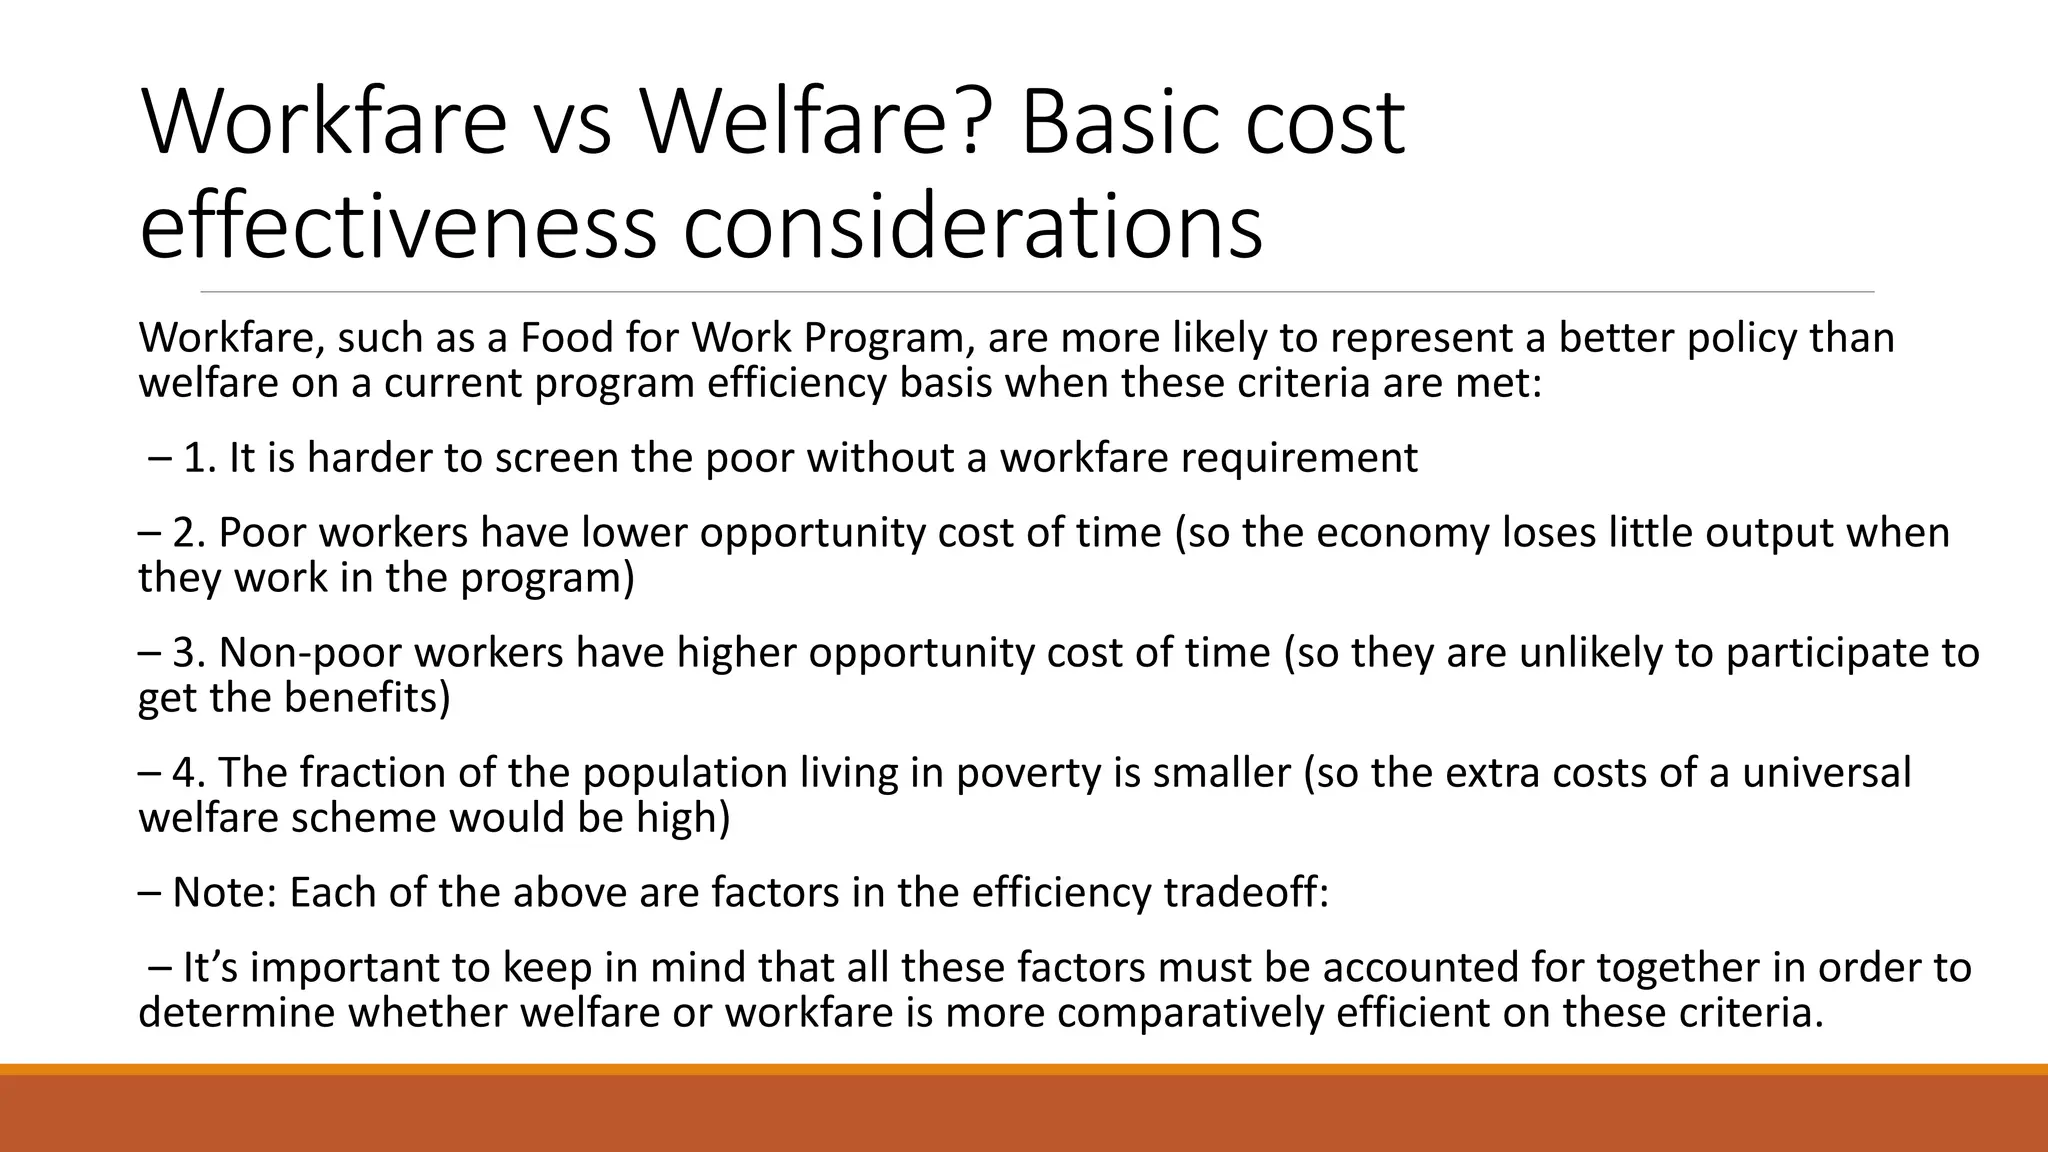
Workfare, such as a Food for Work Program, are more likely to represent a better policy than
welfare on a current program efficiency basis when these criteria are met:
– 1. It is harder to screen the poor without a workfare requirement
– 2. Poor workers have lower opportunity cost of time (so the economy loses little output when
they work in the program)
– 3. Non-poor workers have higher opportunity cost of time (so they are unlikely to participate to
get the benefits)
– 4. The fraction of the population living in poverty is smaller (so the extra costs of a universal
welfare scheme would be high)
– Note: Each of the above are factors in the efficiency tradeoff:
– It’s important to keep in mind that all these factors must be accounted for together in order to
determine whether welfare or workfare is more comparatively efficient on these criteria.
36.
Workfare vs Welfare:Human Capital
Factors
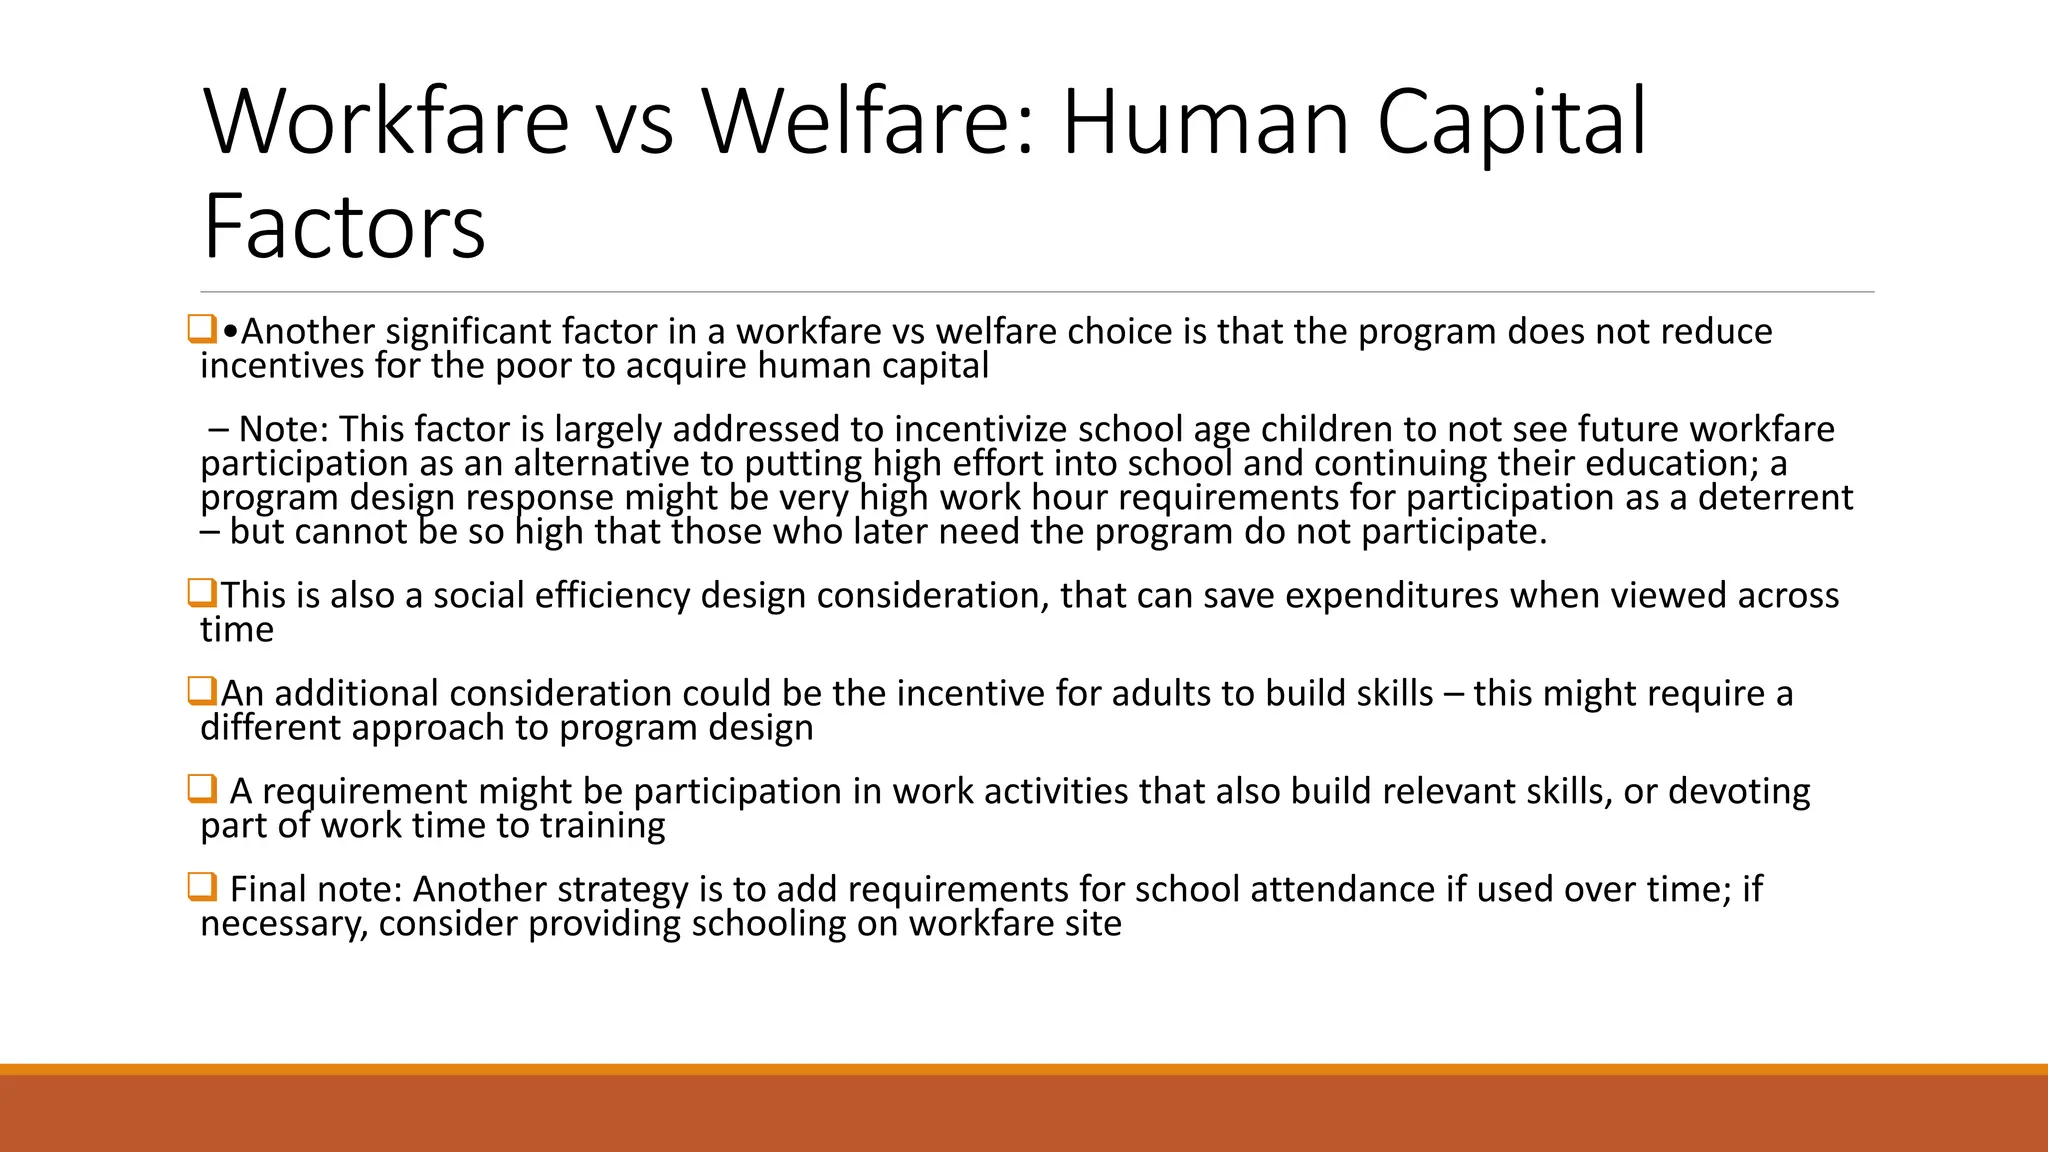
❑•Another significant factor in a workfare vs welfare choice is that the program does not reduce
incentives for the poor to acquire human capital
– Note: This factor is largely addressed to incentivize school age children to not see future workfare
participation as an alternative to putting high effort into school and continuing their education; a
program design response might be very high work hour requirements for participation as a deterrent
– but cannot be so high that those who later need the program do not participate.
❑This is also a social efficiency design consideration, that can save expenditures when viewed across
time
❑An additional consideration could be the incentive for adults to build skills – this might require a
different approach to program design
❑ A requirement might be participation in work activities that also build relevant skills, or devoting
part of work time to training
❑ Final note: Another strategy is to add requirements for school attendance if used over time; if
necessary, consider providing schooling on workfare site
37.
Workfare vs Welfare:Other Factors
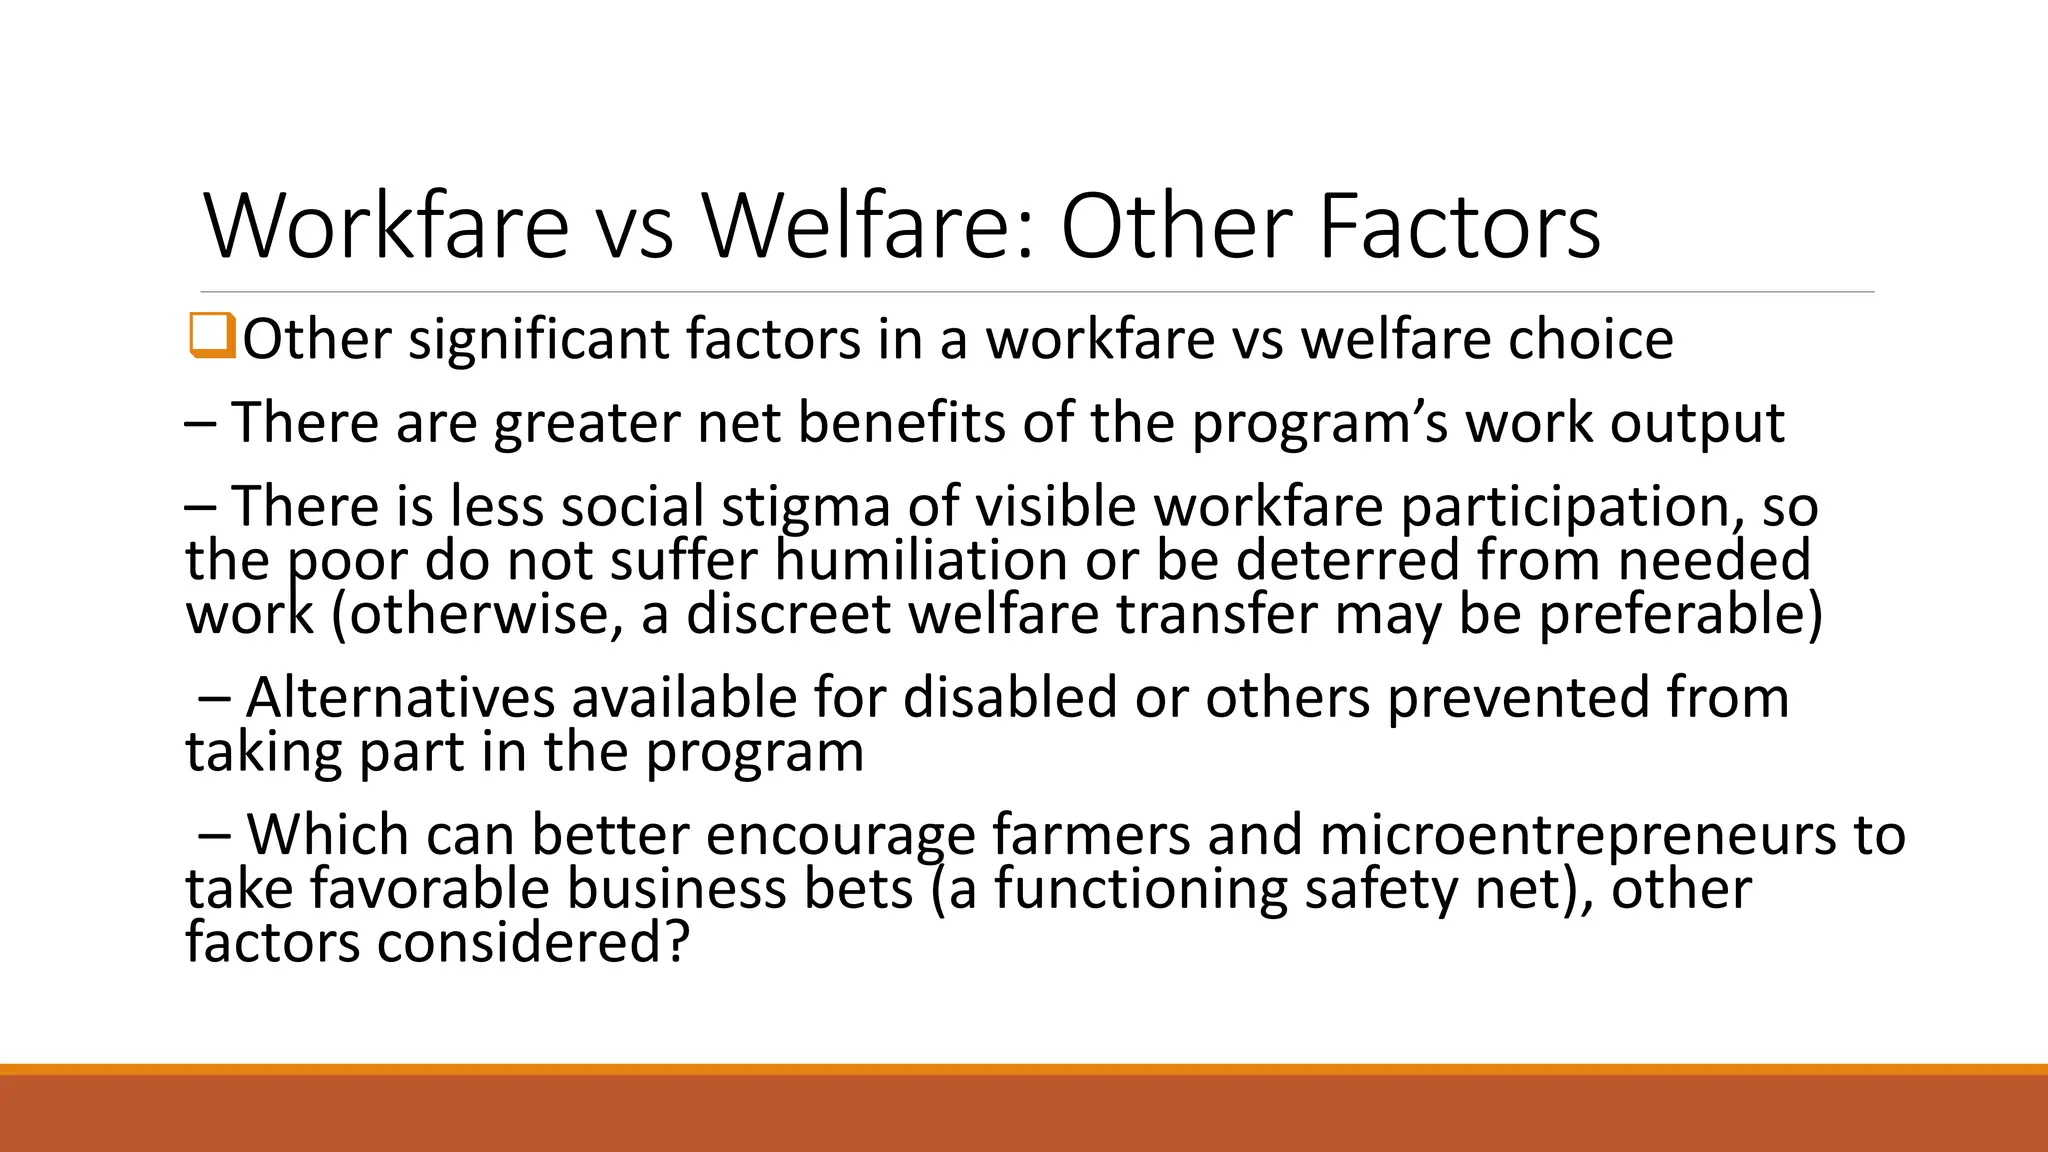
❑Other significant factors in a workfare vs welfare choice
– There are greater net benefits of the program’s work output
– There is less social stigma of visible workfare participation, so
the poor do not suffer humiliation or be deterred from needed
work (otherwise, a discreet welfare transfer may be preferable)
– Alternatives available for disabled or others prevented from
taking part in the program
– Which can better encourage farmers and microentrepreneurs to
take favorable business bets (a functioning safety net), other
factors considered?
38.
Policy Options onIncome Inequality and
Poverty: Some Basic Considerations
❑Areas of Intervention:
– Altering the functional distribution
– Mitigating the size distribution
– Moderating (reducing) the size distribution at
upper levels
– Moderating (increasing) the size distribution at
lower levels
39.
Policy Options onIncome Inequality and
Poverty: Some Basic Considerations
❑Policy options
– Changing relative factor prices
– Progressive redistribution of asset ownership
– Progressive taxation
– Transfer payments and public provision of
goods and services
40.
Summary and Conclusions:The Need for
a Package of Policies
Policies to correct factor price distortions
• Policies to change the distribution of assets, power, and access
to education and associated employment opportunities
• Policies of progressive taxation and directed transfer payments
• Policies designed to build capabilities and human and social
capital of the poor
• Some specific programs like conditional cash transfers,
agricultural extension and micro-finance.