Download as PDF, PPTX

![M. Ali Kemal
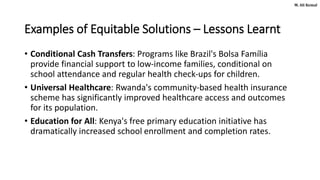
Unpacking the term “poverty”
• Absolute Poverty
• Independent of the person's permanent location or area
• Relative Poverty
• Varies from one country to another, or from one society to another
• Income Poverty [$(PPP)2.15/ day Global Definition & Globally Comparable]
• Cost of Basic Needs Method [National/Official Measure of Poverty]
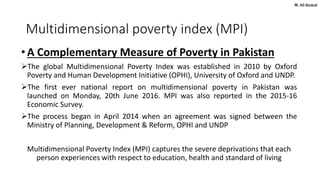
• Multidimensional Poverty Index [Complementary Measure of Poverty /OPHI]
• PMT [Used by BISP to target eligible households]](https://image.slidesharecdn.com/deconstructingpoverty-goal1-240908043531-0d320554/85/Deconstructing-Poverty-Unveiling-Multidimensional-Challenges-and-Crafting-Equitable-Solutions-2-320.jpg)

![M. Ali Kemal
How poverty is estimated and reported in
Pakistan
Extreme
Poverty
[$ 1.9/ day Global
Definition &
Globally
Comparable]
Cost of Basic
Needs Method
[National/Official
Measure of Poverty
/ World Bank
Methodology]
Multidimensional
Poverty Index
[Complementary
Measure of Poverty
/OPHI & UNDP]](https://image.slidesharecdn.com/deconstructingpoverty-goal1-240908043531-0d320554/85/Deconstructing-Poverty-Unveiling-Multidimensional-Challenges-and-Crafting-Equitable-Solutions-4-320.jpg)


The document by M. Ali Kemal explores the multifaceted nature of poverty, emphasizing various definitions, measurement methodologies, and the challenges faced in Pakistan. It presents the Multidimensional Poverty Index (MPI) as a comprehensive tool to assess poverty across dimensions such as health, education, and living standards, alongside poverty estimates and targets set by the Sustainable Development Goals (SDGs). Finally, it proposes equitable solutions and strategies for addressing these challenges through integrated policies, community involvement, and sustainable practices.


