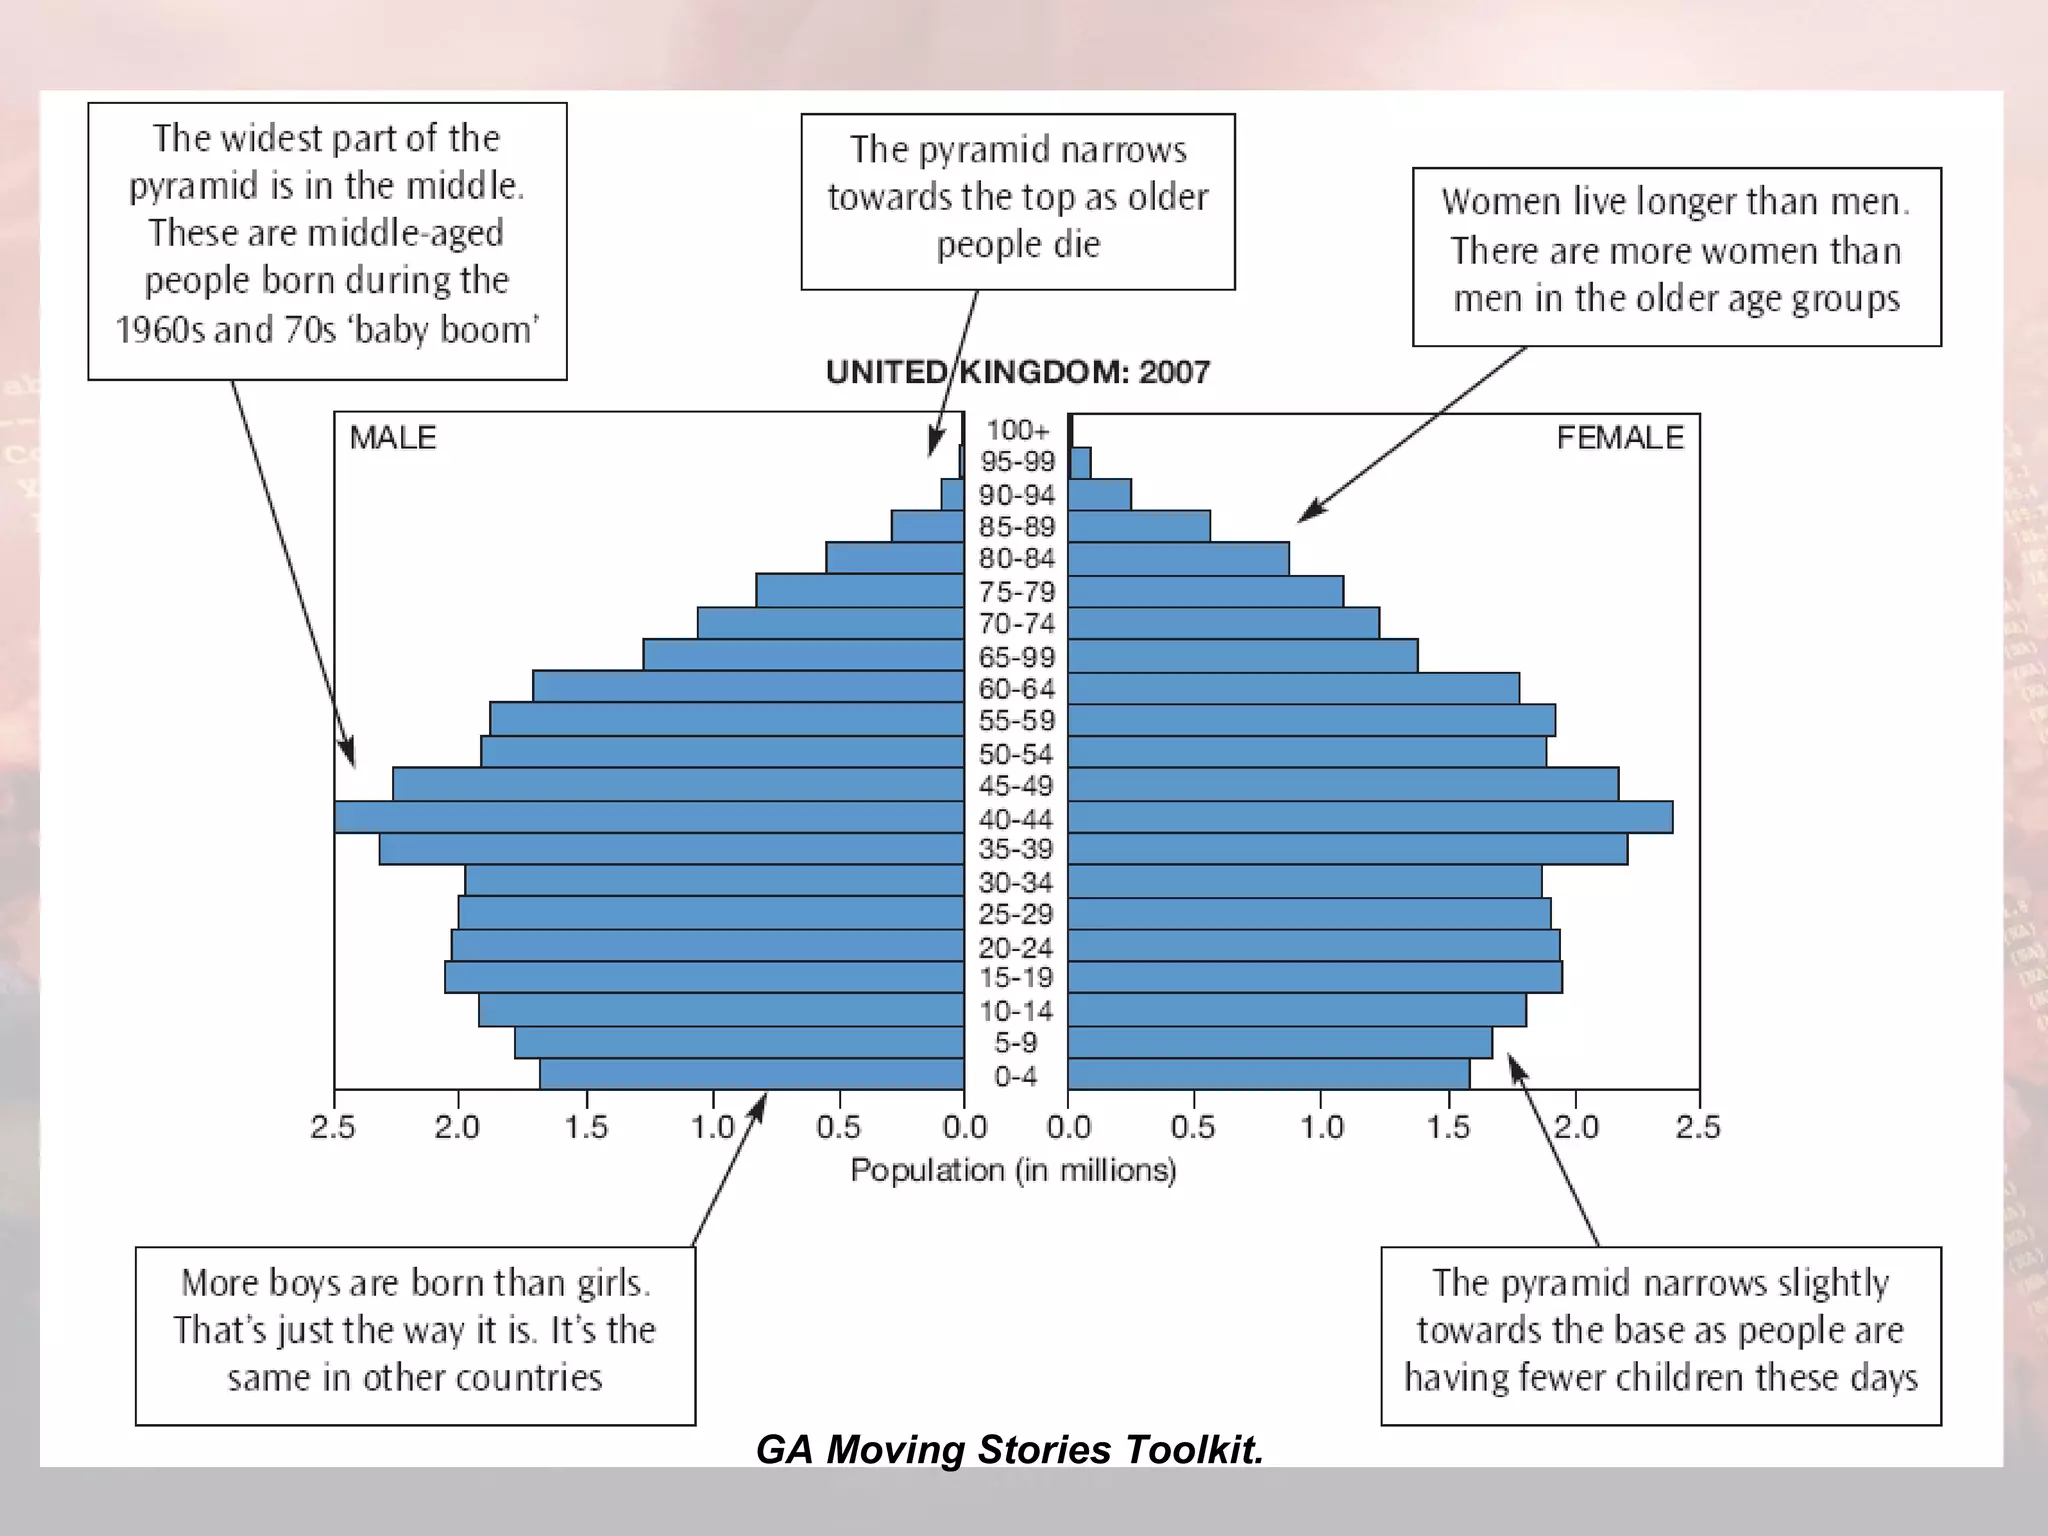
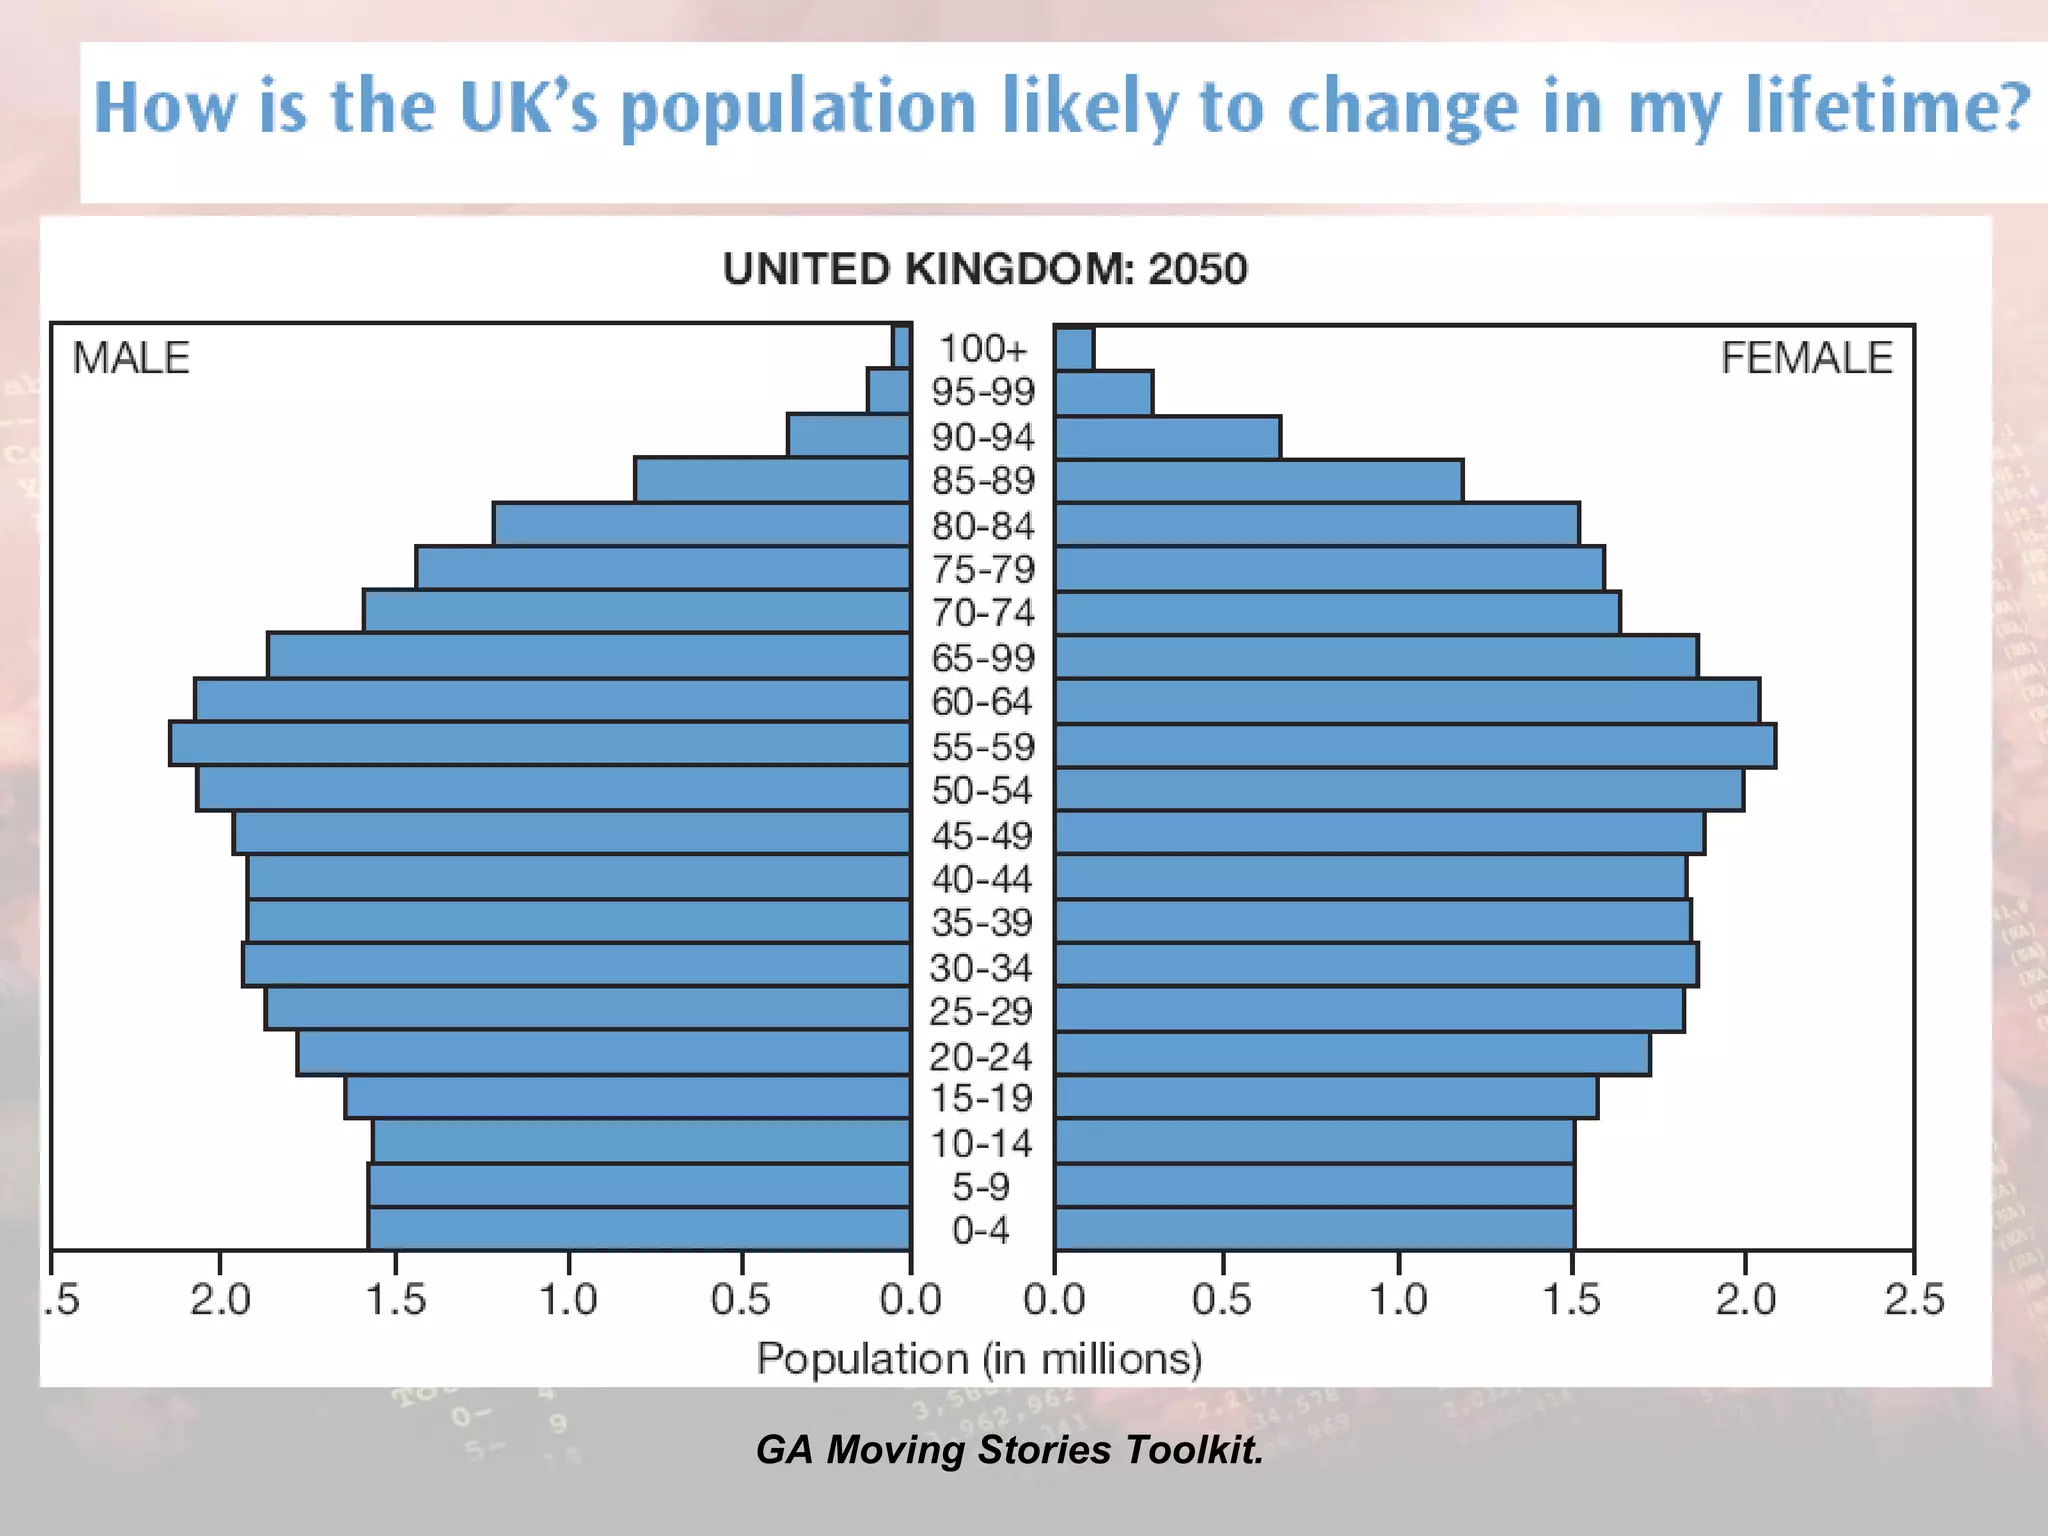
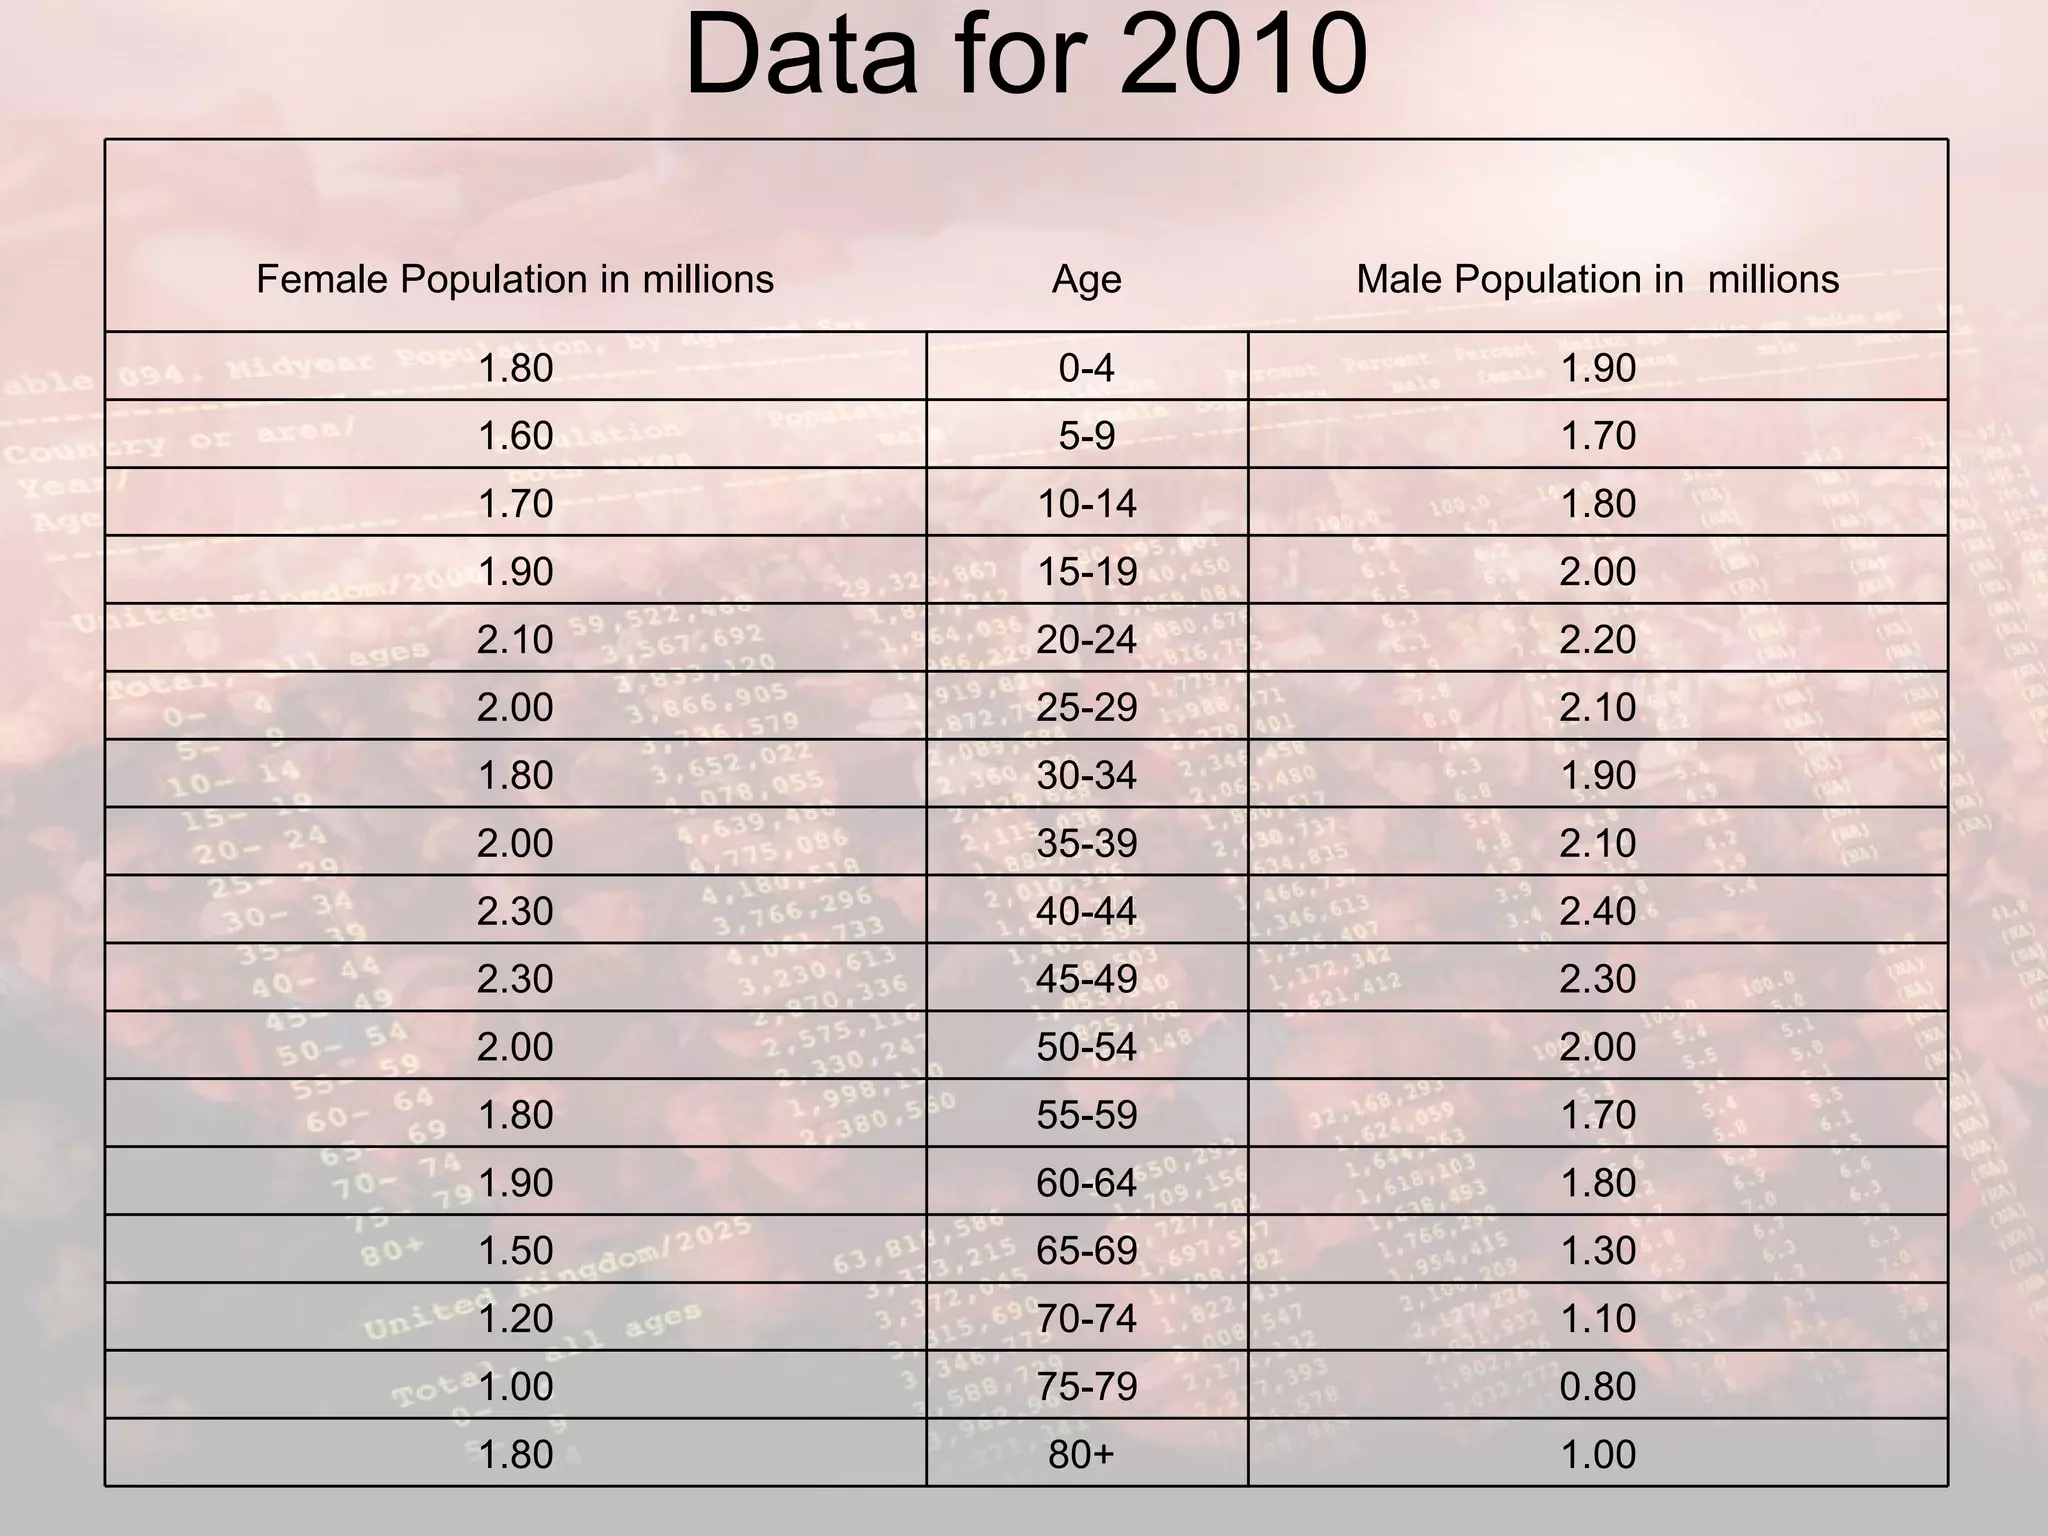
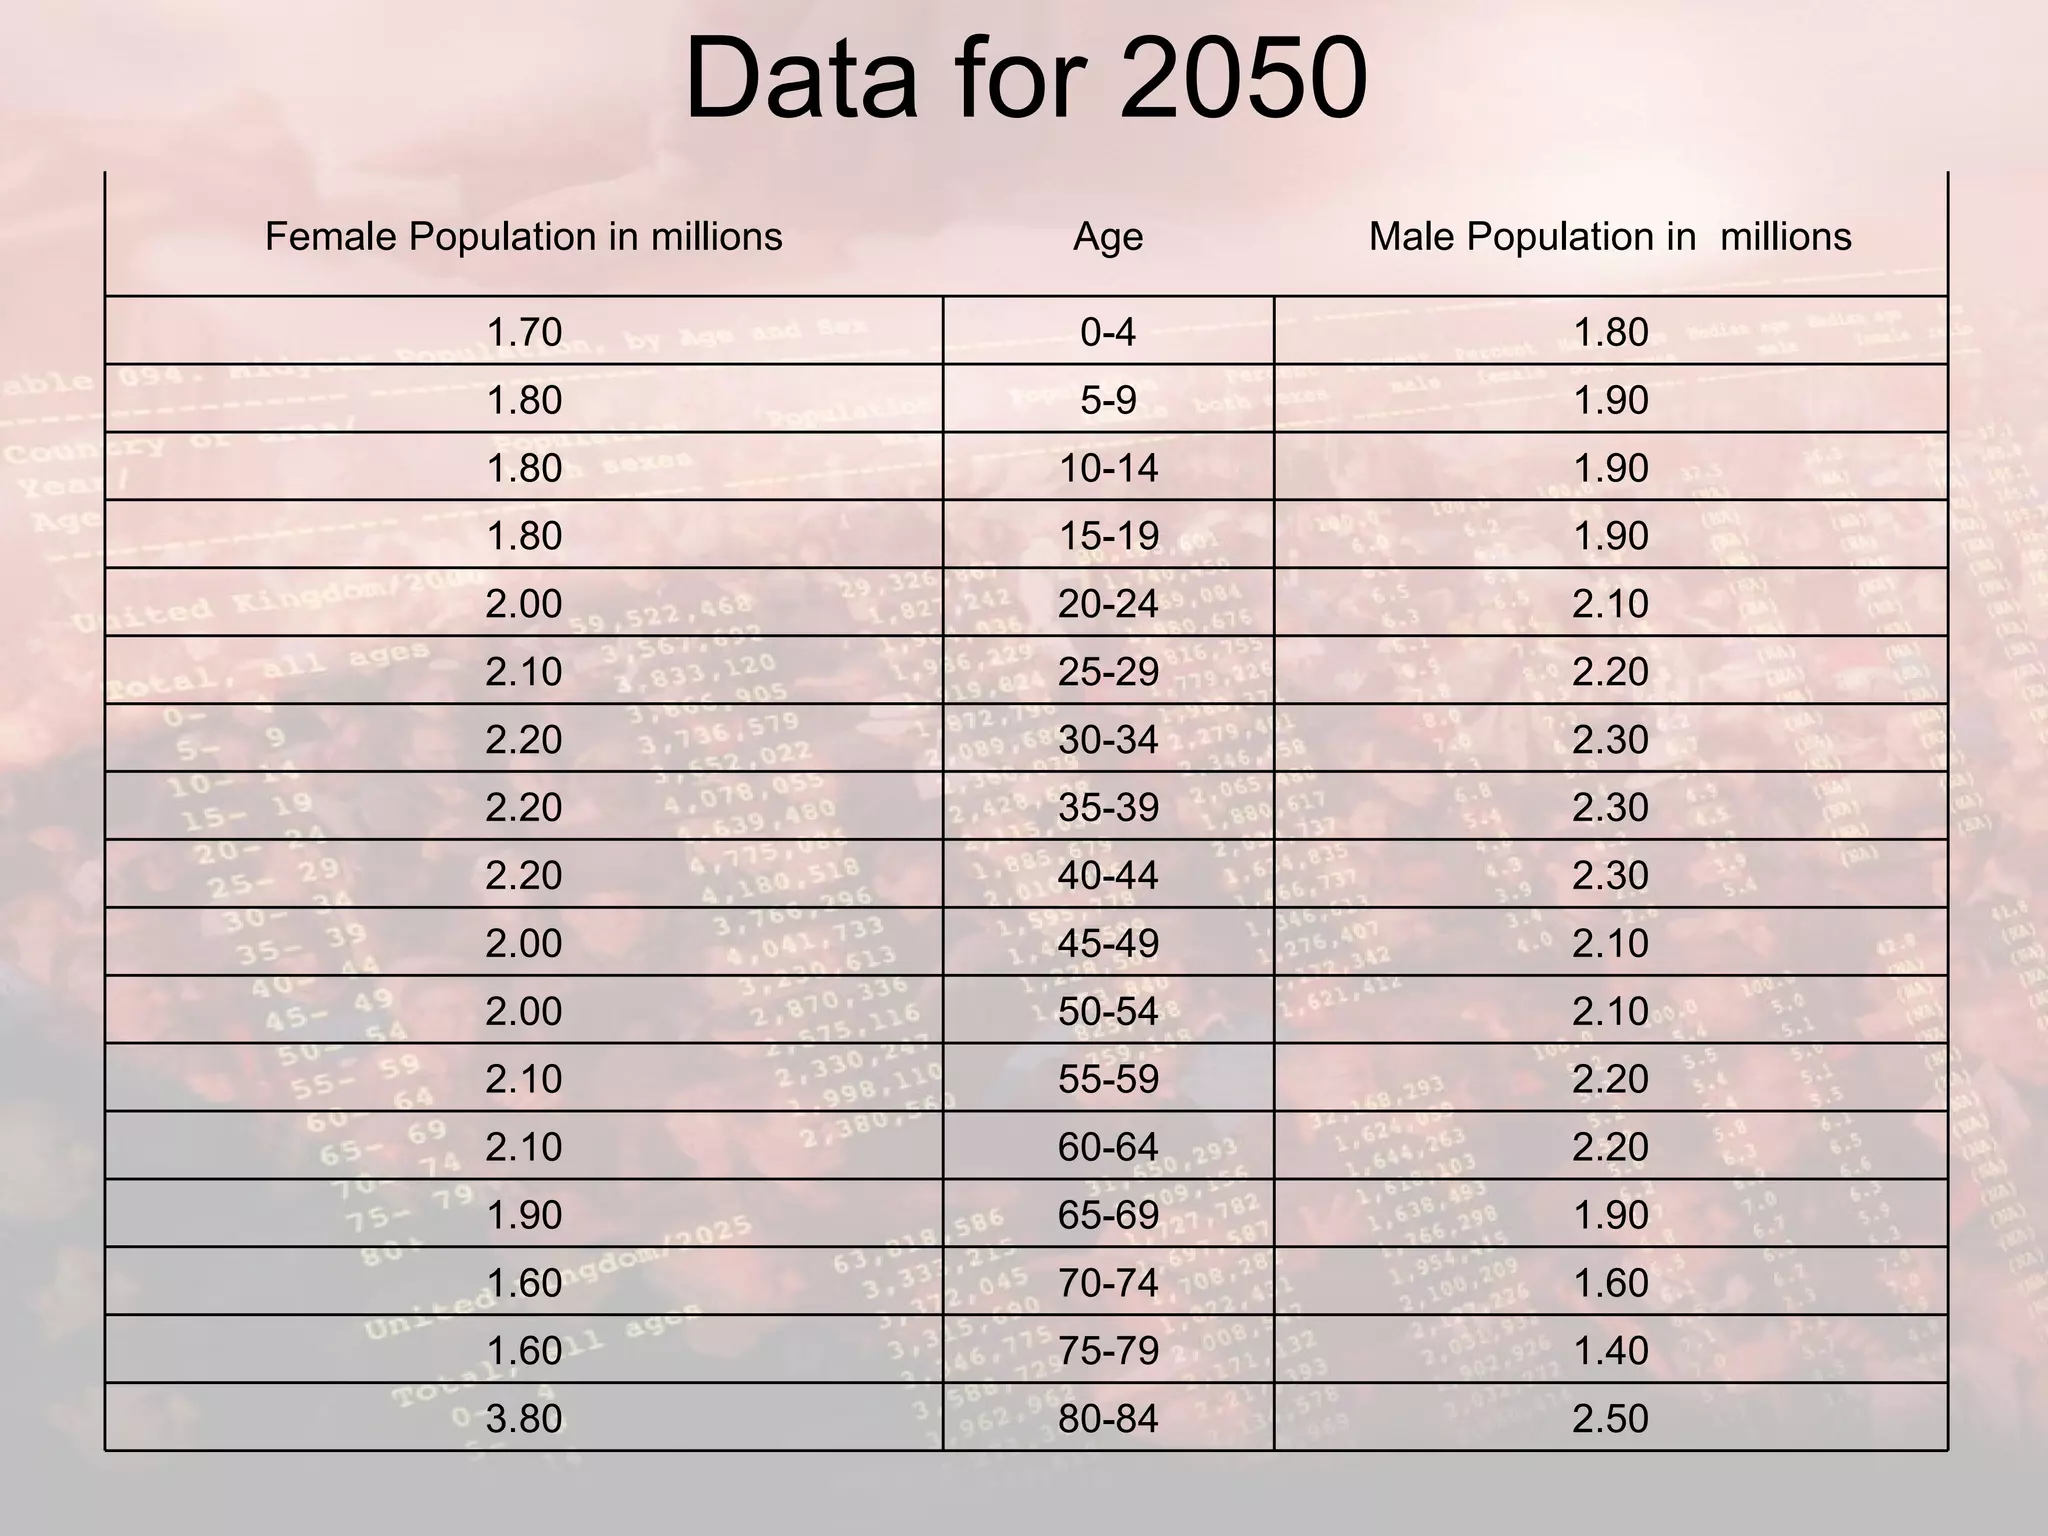
Moving Stories Lesson 8
How can we predict how population will change? LI: To understand how to interpret Population pyramids. During today's lesson we shall be investigating what Population pyramids are, and how they can be used to predict population change.
GA Moving Stories Toolkit.
Data for 2010 1.00 80+  1.80 0.80 75-79 1.00 1.10 70-74 1.20 1.30 65-69 1.50 1.80 60-64 1.90 1.70 55-59 1.80 2.00 50-54 2.00 2.30 45-49 2.30 2.40 40-44 2.30 2.10 35-39 2.00 1.90 30-34 1.80 2.10 25-29 2.00 2.20 20-24 2.10 2.00 15-19 1.90 1.80 10-14 1.70 1.70 5-9 1.60 1.90 0-4 1.80 Male Population in  millions Age Female Population in millions
Data for 2050 2.50 80-84 3.80 1.40 75-79 1.60 1.60 70-74 1.60 1.90 65-69 1.90 2.20 60-64 2.10 2.20 55-59 2.10 2.10 50-54 2.00 2.10 45-49 2.00 2.30 40-44 2.20 2.30 35-39 2.20 2.30 30-34 2.20 2.20 25-29 2.10 2.10 20-24 2.00 1.90 15-19 1.80 1.90 10-14 1.80 1.90 5-9 1.80 1.80 0-4 1.70 Male Population in  millions Age Female Population in millions
Homework This weeks homework for Year 7's is to produce a 3D version of the UK's population pyramid in 2050 and compare it to the pyramid of 2010 we did in class.   The data you need is shown in the slide show below - but how will you make it look 3D? Lego bricks would be great, jelly babies arranged on a plate perhaps? Remember to take a photo and bring in next lesson or post your photo on the schools VLE.
Plenary What was our learning objective? Did we achieve it? How can we be sure?

Moving stories lesson 8 - Population Pyramids

  • 1.
  • 2.
    How can wepredict how population will change? LI: To understand how to interpret Population pyramids. During today's lesson we shall be investigating what Population pyramids are, and how they can be used to predict population change.
  • 3.
  • 4.
  • 5.
    Data for 20101.00 80+ 1.80 0.80 75-79 1.00 1.10 70-74 1.20 1.30 65-69 1.50 1.80 60-64 1.90 1.70 55-59 1.80 2.00 50-54 2.00 2.30 45-49 2.30 2.40 40-44 2.30 2.10 35-39 2.00 1.90 30-34 1.80 2.10 25-29 2.00 2.20 20-24 2.10 2.00 15-19 1.90 1.80 10-14 1.70 1.70 5-9 1.60 1.90 0-4 1.80 Male Population in millions Age Female Population in millions
  • 6.
    Data for 20502.50 80-84 3.80 1.40 75-79 1.60 1.60 70-74 1.60 1.90 65-69 1.90 2.20 60-64 2.10 2.20 55-59 2.10 2.10 50-54 2.00 2.10 45-49 2.00 2.30 40-44 2.20 2.30 35-39 2.20 2.30 30-34 2.20 2.20 25-29 2.10 2.10 20-24 2.00 1.90 15-19 1.80 1.90 10-14 1.80 1.90 5-9 1.80 1.80 0-4 1.70 Male Population in millions Age Female Population in millions
  • 7.
    Homework This weekshomework for Year 7's is to produce a 3D version of the UK's population pyramid in 2050 and compare it to the pyramid of 2010 we did in class.   The data you need is shown in the slide show below - but how will you make it look 3D? Lego bricks would be great, jelly babies arranged on a plate perhaps? Remember to take a photo and bring in next lesson or post your photo on the schools VLE.
  • 8.
    Plenary What wasour learning objective? Did we achieve it? How can we be sure?