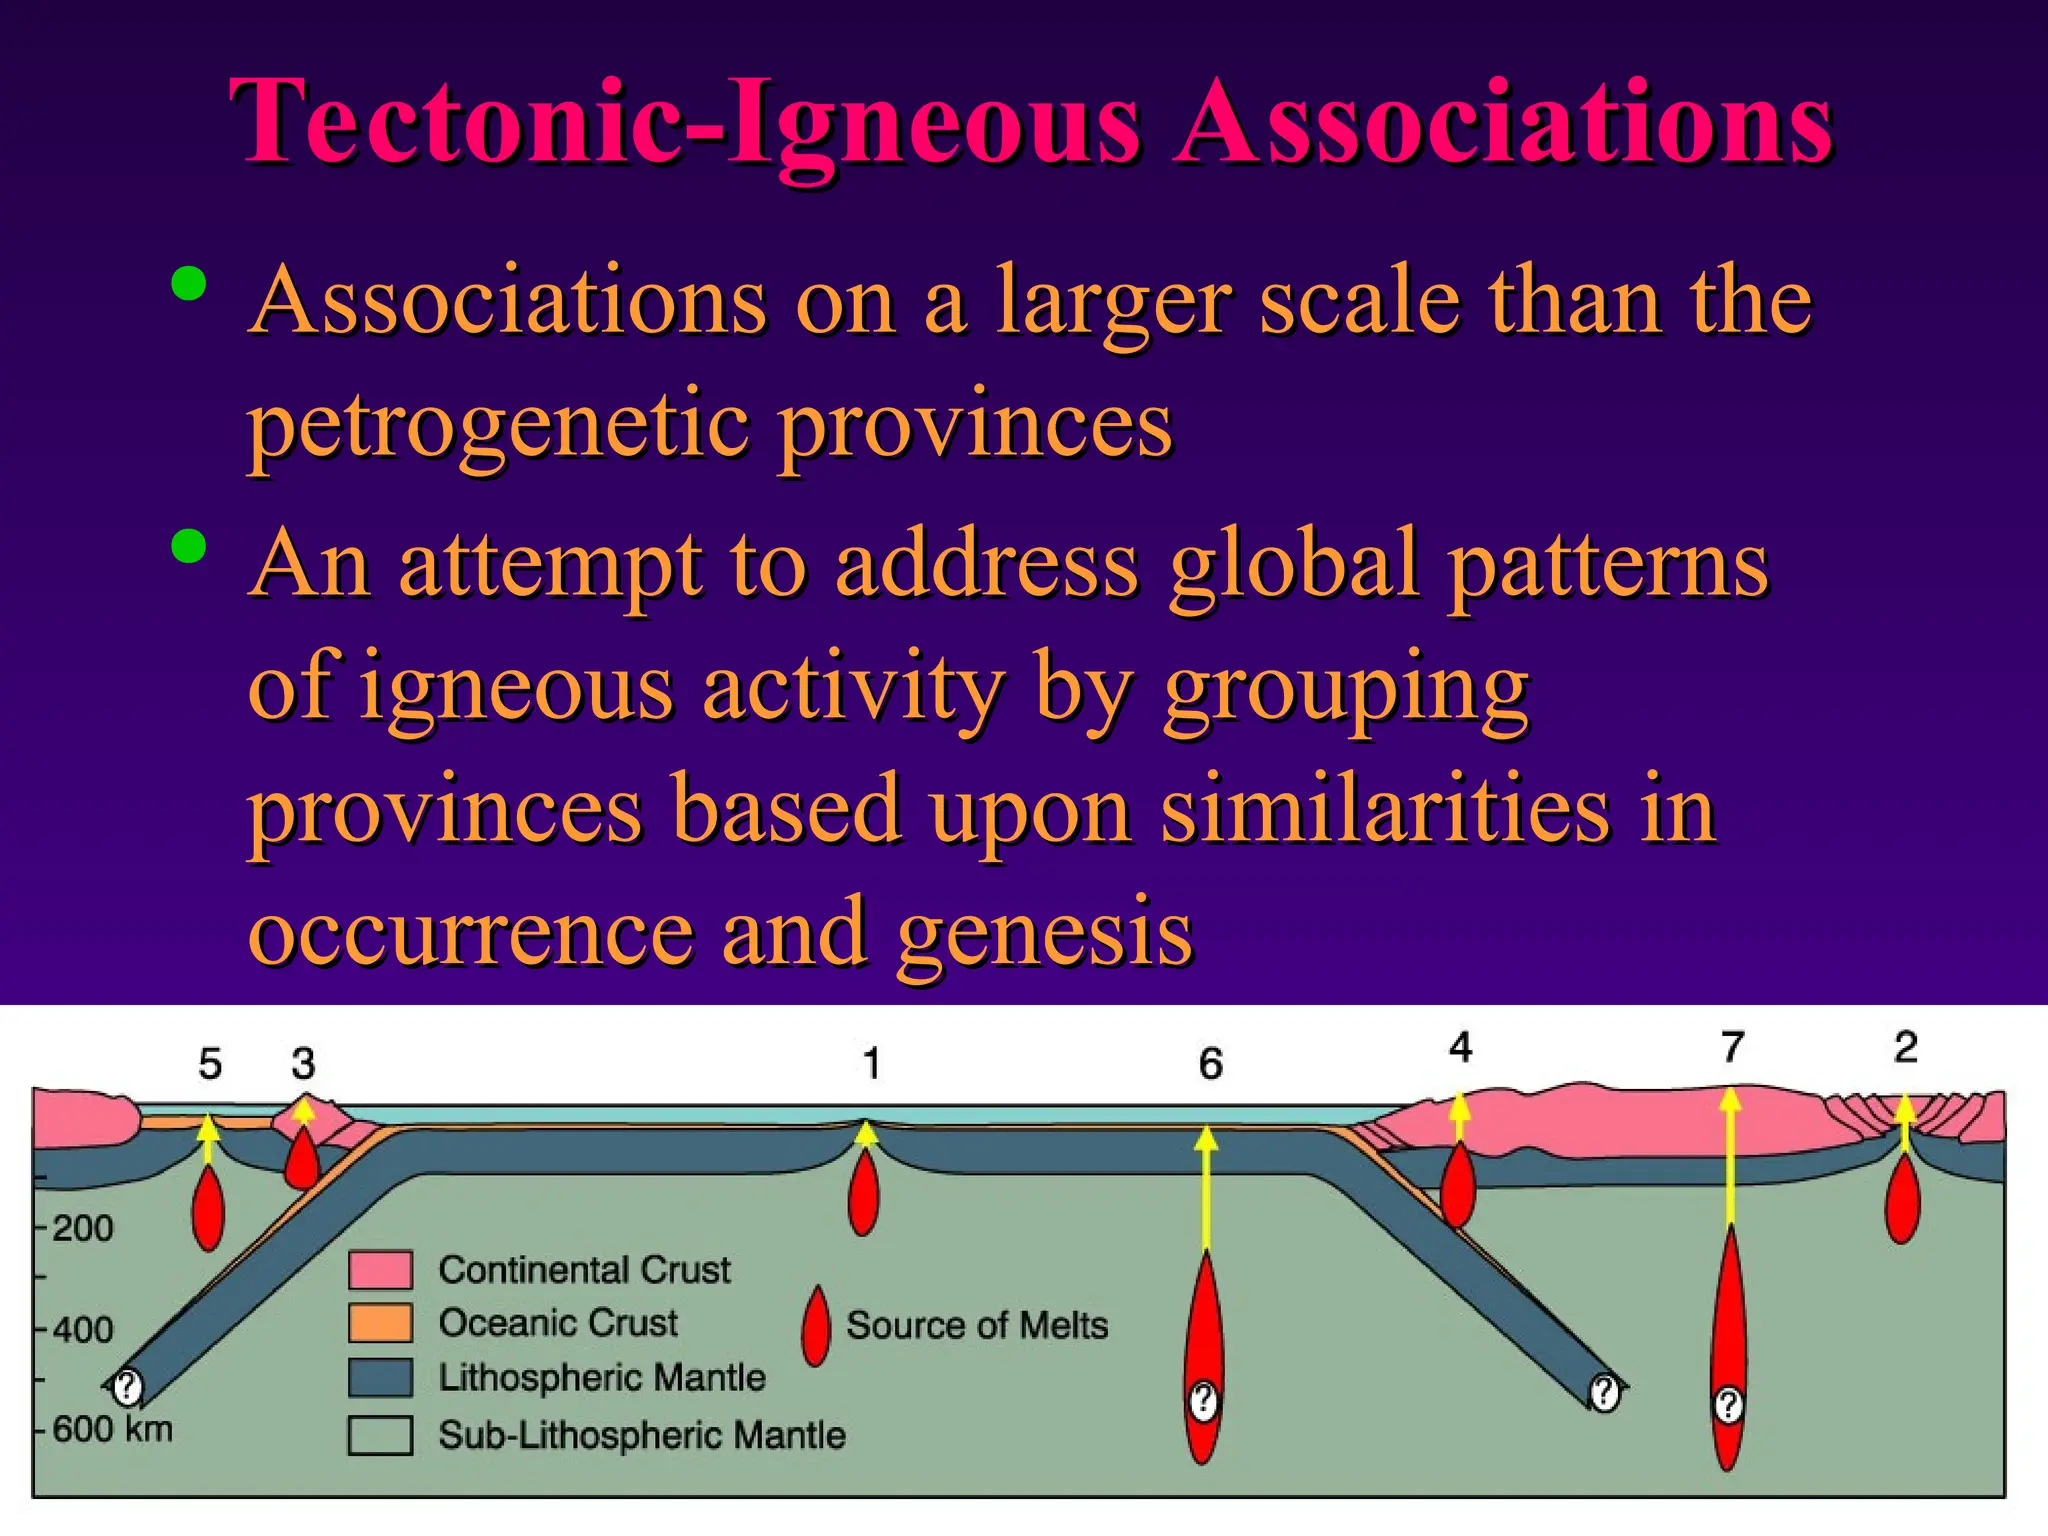
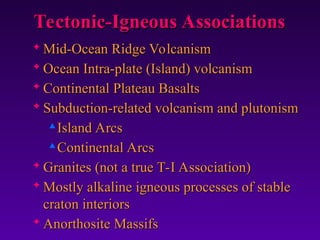
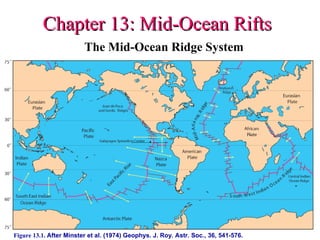
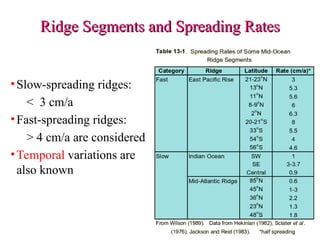
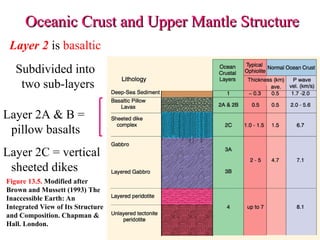
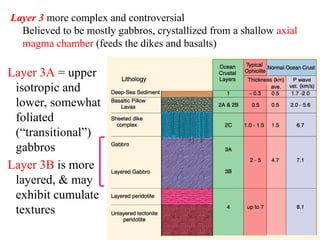
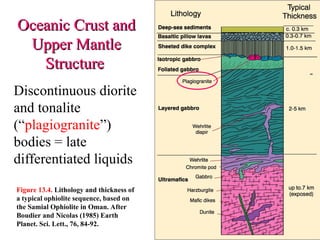
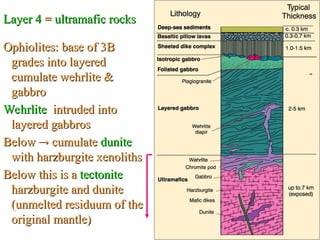
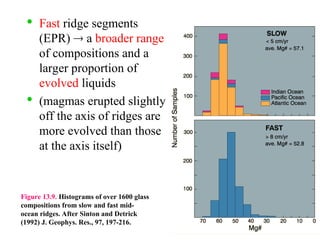
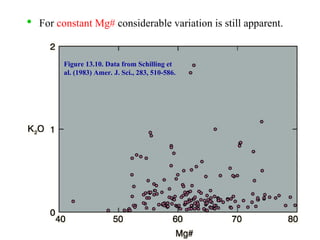
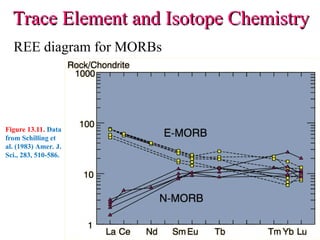
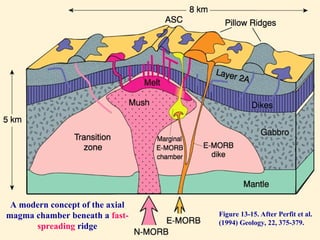
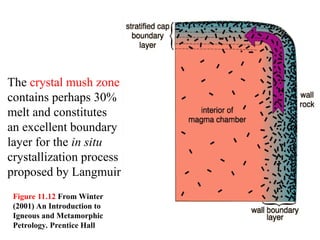
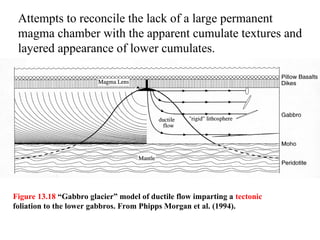
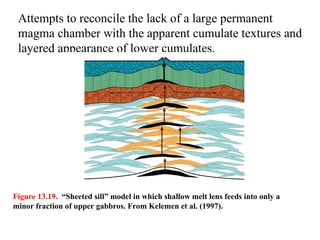
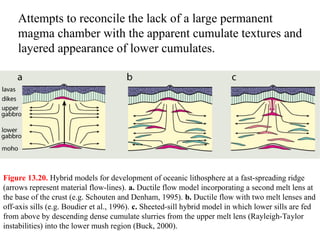
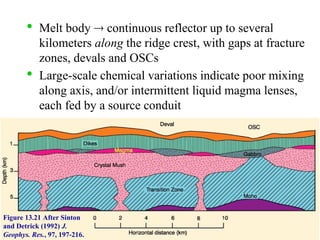
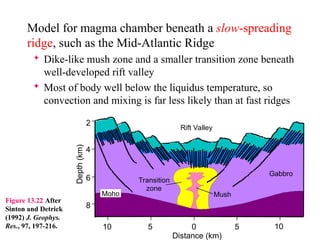
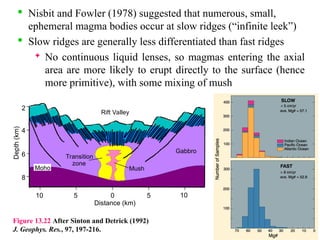
Tectonic-Igneous Associations

Associations on a larger scale than the
petrogenetic provinces

An attempt to address global patterns
of igneous activity by grouping
provinces based upon similarities in
occurrence and genesis

Mid-Ocean Ridge Volcanism

Ocean Intra-plate (Island) volcanism

Continental Plateau Basalts
 Subduction-related volcanism and plutonism
Subduction-related volcanism and plutonism

Island Arcs
Island Arcs

Continental Arcs
Continental Arcs
 Granites (not a true T-I Association)
Granites (not a true T-I Association)

Mostly alkaline igneous processes of stable
craton interiors
craton interiors

Anorthosite Massifs
Anorthosite Massifs
Tectonic-Igneous Associations
Chapter 13: Mid-Ocean Rifts
The Mid-Ocean Ridge System
Figure 13.1. After Minster et al. (1974) Geophys. J. Roy. Astr. Soc., 36, 541-576.
Ridge Segments and Spreading Rates
•Slow-spreading ridges:
< 3 cm/a
•Fast-spreading ridges:
> 4 cm/a are considered
•Temporal variations are
also known
Ridge Segments and Spreading Rates
Hierarchy of ridge segmentation
Figure 13.3.
Figure 13.3. S1-S4 refer to ridge segments of first- to fourth-order and D1-D4 refer to discontinuities between
S1-S4 refer to ridge segments of first- to fourth-order and D1-D4 refer to discontinuities between
corresponding segments. After Macdonald (1998).
OSC
OSC
Deval
Deval
OSC = overlapping spreading center
Deval = deviation from axial linearity
Oceanic Crust and Upper Mantle Structure

4 layers distinguished via seismic velocities

Deep Sea Drilling Program

Dredging of fracture zone scarps

Ophiolites
Oceanic Crust and
Upper Mantle Structure
Typical Ophiolite
Figure 13.4. Lithology and thickness of
a typical ophiolite sequence, based on
the Samial Ophiolite in Oman. After
Boudier and Nicolas (1985) Earth
Planet. Sci. Lett., 76, 84-92.
Layer 1
A thin layer
of pelagic
sediment
Oceanic Crust and Upper Mantle Structure
Figure 13.5. Modified after
Brown and Mussett (1993) The
Inaccessible Earth: An
Integrated View of Its Structure
and Composition. Chapman &
Hall. London.
Layer 2 is basaltic
Subdivided into
two sub-layers
Layer 2A & B =
pillow basalts
Layer 2C = vertical
sheeted dikes
Oceanic Crust and Upper Mantle Structure
Figure 13.5. Modified after
Brown and Mussett (1993) The
Inaccessible Earth: An
Integrated View of Its Structure
and Composition. Chapman &
Hall. London.
Layer 3 more complex and controversial
Believed to be mostly gabbros, crystallized from a shallow axial
magma chamber (feeds the dikes and basalts)
Layer 3A = upper
isotropic and
lower, somewhat
foliated
(“transitional”)
gabbros
Layer 3B is more
layered, & may
exhibit cumulate
textures
Discontinuous diorite
and tonalite
(“plagiogranite”)
bodies = late
differentiated liquids
Oceanic Crust and
Oceanic Crust and
Upper Mantle
Upper Mantle
Structure
Structure
Figure 13.4. Lithology and thickness of
a typical ophiolite sequence, based on
the Samial Ophiolite in Oman. After
Boudier and Nicolas (1985) Earth
Planet. Sci. Lett., 76, 84-92.
Layer 4
Layer 4 =
= ultramafic rocks
ultramafic rocks
Ophiolites: base of 3B
grades into layered
grades into layered
cumulate wehrlite &
cumulate wehrlite &
gabbro
gabbro
Wehrlite
Wehrlite intruded into
intruded into
layered gabbros
layered gabbros
Below
Below 
 cumulate
cumulate dunite
dunite
with harzburgite xenoliths
Below this is a
Below this is a tectonite
tectonite
harzburgite and dunite
(unmelted residuum of the
original mantle)
original mantle)
Elevation of ridge reduces with time as plate cools
Petrography and Major Element Chemistry
A “typical” MORB is an olivine tholeiite with
low K2O (< 0.2%) and low TiO2 (< 2.0%)
Only glass is certain to represent liquid
compositions
The common crystallization sequence is: olivine ( Mg-
Cr spinel), olivine + plagioclase ( Mg-Cr spinel),
olivine + plagioclase + clinopyroxene
Figure 7.2. After Bowen
(1915), A. J. Sci., and
Morse (1994), Basalts and
Phase Diagrams. Krieger
Publishers.

Fe-Ti oxides are restricted to the groundmass, and
thus form late in the MORB sequence
Figure 8.2. AFM diagram for
Crater Lake volcanics,
Oregon Cascades. Data
compiled by Rick Conrey
(personal communication).
The major element chemistry of MORBs
Originally considered to be extremely uniform,
interpreted as a simple petrogenesis
More extensive sampling has shown that they
display a (restricted) range of compositions
The major element
The major element
chemistry of MORBs
chemistry of MORBs
Table 13-2. Average Analyses and CIPW Norms of MORBs
(BVTP Table 1.2.5.2)
Oxide (wt%) All MAR EPR IOR
SiO2 50.5 50.7 50.2 50.9
TiO2 1.56 1.49 1.77 1.19
Al2O3 15.3 15.6 14.9 15.2
FeO* 10.5 9.85 11.3 10.3
MgO 7.47 7.69 7.10 7.69
CaO 11.5 11.4 11.4 11.8
Na2O 2.62 2.66 2.66 2.32
K2O 0.16 0.17 0.16 0.14
P2O5 0.13 0.12 0.14 0.10
Total 99.74 99.68 99.63 99.64
Norm
q 0.94 0.76 0.93 1.60
or 0.95 1.0 0.95 0.83
ab 22.17 22.51 22.51 19.64
an 29.44 30.13 28.14 30.53
di 21.62 20.84 22.5 22.38
hy 17.19 17.32 16.53 18.62
ol 0.0 0.0 0.0 0.0
mt 4.44 4.34 4.74 3.90
il 2.96 2.83 3.36 2.26
ap 0.30 0.28 0.32 0.23
All: Ave of glasses from Atlantic, Pacific and Indian Ocean ridges.
MAR: Ave. of MAR glasses. EPR: Ave. of EPR glasses.
IOR: Ave. of Indian Ocean ridge glasses.
Figure 13.6. “Fenner-type” variation
diagrams for basaltic glasses from the
Afar region of the MAR. Note different
ordinate scales. From Stakes et al.
(1984) J. Geophys. Res., 89, 6995-7028.
The major element
The major element
chemistry of MORBs
chemistry of MORBs
Conclusions about MORBs, and the processes
beneath mid-ocean ridges
 MORBs are not such completely uniform
magmas

Chemical trends consistent with
fractional crystallization of olivine,
plagioclase, and perhaps clinopyroxene
 MORBs cannot be primary magmas, but
are derivative magmas resulting from
fractional crystallization (up to ~ 60%)

Fast ridge segments
(EPR)  a broader range
of compositions and a
larger proportion of
evolved liquids

(magmas erupted slightly
off the axis of ridges are
more evolved than those
at the axis itself)
Figure 13.9. Histograms of over 1600 glass
compositions from slow and fast mid-
ocean ridges. After Sinton and Detrick
(1992) J. Geophys. Res., 97, 197-216.

For constant Mg# considerable variation is still apparent.
Figure 13.10. Data from Schilling et
al. (1983) Amer. J. Sci., 283, 510-586.
Incompatible-rich and incompatible-poor mantle source
regions for MORB magmas
 N-MORB (normal MORB) taps the depleted upper
mantle source
 Mg# > 65: K2O < 0.10 TiO2 < 1.0
 E-MORB (enriched MORB, also called P-MORB for
plume) taps the (deeper) fertile mantle
 Mg# > 65: K2O > 0.10 TiO2 > 1.0
Trace Element and Isotope Chemistry
REE diagram for MORBs
Figure 13.11. Data
from Schilling et
al. (1983) Amer. J.
Sci., 283, 510-586.
E-MORBs are enriched over N-MORBs: regardless of Mg#
Lack of a distinct break suggests three MORB types
 E-MORBs La/Sm > 1.8
 N-MORBs La/Sm < 0.7
 T-MORBs (transitional) intermediate values
Figure 13.12. Data from
Schilling et al. (1983) Amer.
J. Sci., 283, 510-586.

N-MORBs: 87
Sr/86
Sr < 0.7035 and 143
Nd/144
Nd >
0.5030,  depleted mantle source

E-MORBs extend to more enriched values 
stronger support distinct mantle reservoirs for N-
type and E-type MORBs
Figure 13.13. Data from Ito
et al. (1987) Chemical
Geology, 62, 157-176; and
LeRoex et al. (1983) J.
Petrol., 24, 267-318.
Conclusions:

MORBs have > 1 source region

The mantle beneath the ocean basins is not
homogeneous
 N-MORBs tap an upper, depleted mantle
 E-MORBs tap a deeper enriched source
 T-MORBs = mixing of N- and E- magmas
during ascent and/or in shallow chambers
Experimental data: parent was multiply saturated with
olivine, cpx, and opx  P range = 0.8 - 1.2 GPa (25-35 km)
Figure 13.11. Data
from Schilling et
al. (1983) Amer. J.
Sci., 283, 510-586.
Implications of shallow P range from major element data:
 MORB magmas = partial melting of mantle lherzolite in a
rising solid diapir
 Melting must take place over a range of pressures
 P of multiple saturation = point at which melt was last in
equilibrium with solid mantle
Trace element and isotopic characteristics of melt reflect
equilibrium distribution between melt and source reservoir
(deeper for E-MORB)
The major element (and hence mineralogical) character
controlled by equilibrium between melt and residual mantle
during rise until melt separates as a system with its own distinct
character (shallow)
MORB Petrogenesis
MORB Petrogenesis

Separation of plates

Upward motion of mantle
material into extended zone

Decompression partial
melting associated with
near-adiabatic rise

N-MORB melting initiated
~ 60-80 km depth in upper
depleted mantle where it
inherits depleted trace
element and isotopic char.
Generation
Figure 13.14. After Zindler et al. (1984) Earth
Planet. Sci. Lett., 70, 175-195. and Wilson (1989)
Igneous Petrogenesis, Kluwer.

Region of melting

Melt blobs separate at about
25-35 km
Figure 13.14. After Zindler et al. (1984) Earth
Planet. Sci. Lett., 70, 175-195. and Wilson (1989)
Igneous Petrogenesis, Kluwer.
Generation

Lower enriched
mantle reservoir may
also be tapped by an
E-MORB plume
initiated near the
core-mantle
boundary

Some ridge segments
may be drawn to
vigorous plumes
(e.g. Iceland)
Figure 13.14. After Zindler et al.
(1984) Earth Planet. Sci. Lett., 70, 175-
195. and Wilson (1989) Igneous
Petrogenesis, Kluwer.
Langmuir “corner flow” model for rising and diverging
mantle passing through a triangular melting region
Hotter plume (deeper origin at a) creates larger melt triangle
than cooler mantle (shallower origin at b)
Mantle rising nearer axis of plume traverses greater portion
of triangle and thus melts more extensively
Figure 13.15. After Langmuir et al. (1992). AGU.
Project
Project
FAMOUS
FAMOUS
(MAR)
(MAR)
From Ballard and Van Andel
(1977)
(1977) GSA Bull., 88, 495-506.
GSA Bull., 88, 495-506.
The Axial Magma Chamber
Original Model

Semi-permanent

Fractional crystallization
 derivative MORB
magmas

Periodic reinjection of
fresh, primitive MORB

Dikes upward through
extending/faulting roof
Figure 13.16. From Byran and Moore (1977)
Geol. Soc. Amer. Bull., 88, 556-570.
Hekinian et al. (1976)
Contr. Min. Pet. 58, 107.

Crystallization at top and sides
 successive layers of gabbro
(layer 3) “infinite onion”

Dense olivine and pyroxene
crystals  ultramafic
cumulates (layer 4)

Layering in lower gabbros
(layer 3B) from density
currents flowing down the
sloping walls and floor?

Moho?? Seismic vs. Petrologic
Figure 13.16. From Byran and Moore (1977)
Geol. Soc. Amer. Bull., 88, 556-570.
Figure 13-15. After Perfit et al.
(1994) Geology, 22, 375-379.
A modern concept of the axial
magma chamber beneath a fast-
spreading ridge
The crystal mush zone
contains perhaps 30%
melt and constitutes
an excellent boundary
layer for the in situ
crystallization process
proposed by Langmuir
Figure 11.12 From Winter
(2001) An Introduction to
Igneous and Metamorphic
Petrology. Prentice Hall
Attempts to reconcile the lack of a large permanent
magma chamber with the apparent cumulate textures and
layered appearance of lower cumulates.
Figure 13.18 “Gabbro glacier” model of ductile flow imparting a tectonic
foliation to the lower gabbros. From Phipps Morgan et al. (1994).
Attempts to reconcile the lack of a large permanent
magma chamber with the apparent cumulate textures and
layered appearance of lower cumulates.
Figure 13.19. “Sheeted sill” model in which shallow melt lens feeds into only a
minor fraction of upper gabbros. From Kelemen et al. (1997).
Attempts to reconcile the lack of a large permanent
magma chamber with the apparent cumulate textures and
layered appearance of lower cumulates.
Figure 13.20. Hybrid models for development of oceanic lithosphere at a fast-spreading ridge
(arrows represent material flow-lines). a. Ductile flow model incorporating a second melt lens at
the base of the crust (e.g. Schouten and Denham, 1995). b. Ductile flow with two melt lenses and
off-axis sills (e.g. Boudier et al., 1996). c. Sheeted-sill hybrid model in which lower sills are fed
from above by descending dense cumulate slurries from the upper melt lens (Rayleigh-Taylor
instabilities) into the lower mush region (Buck, 2000).

Melt body  continuous reflector up to several
kilometers along the ridge crest, with gaps at fracture
zones, devals and OSCs

Large-scale chemical variations indicate poor mixing
along axis, and/or intermittent liquid magma lenses,
each fed by a source conduit
Figure 13.21 After Sinton
and Detrick (1992) J.
Geophys. Res., 97, 197-216.
Model for magma chamber beneath a slow-spreading
ridge, such as the Mid-Atlantic Ridge
 Dike-like mush zone and a smaller transition zone beneath
well-developed rift valley
 Most of body well below the liquidus temperature, so
convection and mixing is far less likely than at fast ridges
Distance (km)
10 10
5 5
0
2
4
6
8
Depth
(km)
Moho
Transition
zone
Mush
Gabbro
Rift Valley
Figure 13.22 After
Sinton and Detrick
(1992) J. Geophys.
Res., 97, 197-216.
Distance (km)
10 10
5 5
0
2
4
6
8
Depth
(km)
Moho
Transition
zone
Mush
Gabbro
Rift Valley

Nisbit and Fowler (1978) suggested that numerous, small,
ephemeral magma bodies occur at slow ridges (“infinite leek”)

Slow ridges are generally less differentiated than fast ridges
 No continuous liquid lenses, so magmas entering the axial
area are more likely to erupt directly to the surface (hence
more primitive), with some mixing of mush
Figure 13.22 After Sinton and Detrick (1992)
J. Geophys. Res., 97, 197-216.
Fast-Spreading Ridge
Ophiolite example: Semial (Oman)
Axial magma chambers are more steady-state,
volcanism more frequent
Smoother flanks (less faulted)
Symmetric and less tectonically disrupted
Ridge typically higher (shallower)
Longer tectonic and magmatic segments
Narrow axial rise with small axial trough
Wider low seismic velocity (partial melt) zone
Narrow axial neovolcanic zone
Thinner lithosphere (higher heat flow)
Thicker, more uniform crust
Extensive sheet lava flows
Slightly more evolved magmas (avg. Mg# = 52.8).
Less compositional diversity within areas
Mantle upwelling more “two-dimensional”
Commonly exhibit “global” magmatic trends of Klein
and Langmuir (1987, 1989).
Slow-Spreading Ridge
Ophiolite example: Troodos (Cyprus)
Axial magma chambers are more ephemeral and
scattered, volcanism less frequent
Rougher flanks (highly faulted)
Commonly asymmetric, more listric & detachment
faulting. Layering is less uniform.
Ridge typically lower (deeper)
Shorter tectonic and magmatic segments
Deep discontinuous axial valleys, uplifted flanks
Narrower low velocity zone- melt lens rare
Wider irregular axial neovolcanic zone with more
distributed local sources  hills, seamounts
Thicker lithosphere (lower heat flow)
Thinner, less uniform crust
Pillow lavas dominate extrusives
Slightly less evolved magmas (avg. Mg# = 57.1).
More compositional diversity within areas
Mantle upwelling more “three-dimensional”
Commonly exhibit “local” magmatic trends of
Klein and Langmuir (1987, 1989).
Table 13.3 General Differences Between Fast (> ~5 cm/a) and Slow-Spreading Ridges
Figure 13.23. Topographic profiles.
From Macdonald (1998). AGU
Along-axis
Across-axis
Figure 13.24 Interpretive cross-section across the slow-spreading Mid-Atlantic Ridge near the Kane
fracture zone. Tectonic extension results in series of normal faults and exhumation along a shallow-
dipping detachment surface, producing a disrupted and distinctly asymmetric architecture. From Thy
and Dilek (2000).
Listric and detachment faulting at slow-spreading centers (MAR).
Note extensive exposure of ultramafic mantle rocks (source of
dredge samples?).
Figure 13.25 Geochemical systematics of Klein and
Langmuir (1987, 1989) using the global trend vs.
local trend scoring system of Niu and Batiza (1993).
Global trends predominate at spreading (half) rates
greater than 5 cm/a, whereas local trends are more
apparent at lesser rates. After Niu and Batiza (1993)
and Phipps Morgan et al. (1994).
Figures I don’t use in class
Figure 13.6.
Figure 13.6. From Stakes
From Stakes
et al. (1984)
et al. (1984) J. Geophys.
J. Geophys.
Res., 89, 6995-7028.
Figures I don’t
Figures I don’t
use in class
use in class
Figure 13.7.
Figure 13.7. Data from Schilling et
Data from Schilling et
al. (1983)
al. (1983) Amer. J. Sci., 283, 510-586.
Amer. J. Sci., 283, 510-586.
Figures I don’t
Figures I don’t
use in class
use in class
Figures I don’t
Figures I don’t
use in class
use in class

MORBs that represent mid oceanic ridge basalts.ppt

  • 1.
    Tectonic-Igneous Associations Tectonic-Igneous Associations  Associationson a larger scale than the Associations on a larger scale than the petrogenetic provinces petrogenetic provinces  An attempt to address global patterns An attempt to address global patterns of igneous activity by grouping of igneous activity by grouping provinces based upon similarities in provinces based upon similarities in occurrence and genesis occurrence and genesis
  • 2.
     Mid-Ocean Ridge Volcanism Mid-OceanRidge Volcanism  Ocean Intra-plate (Island) volcanism Ocean Intra-plate (Island) volcanism  Continental Plateau Basalts Continental Plateau Basalts  Subduction-related volcanism and plutonism Subduction-related volcanism and plutonism  Island Arcs Island Arcs  Continental Arcs Continental Arcs  Granites (not a true T-I Association) Granites (not a true T-I Association)  Mostly alkaline igneous processes of stable Mostly alkaline igneous processes of stable craton interiors craton interiors  Anorthosite Massifs Anorthosite Massifs Tectonic-Igneous Associations Tectonic-Igneous Associations
  • 3.
    Chapter 13: Mid-OceanRifts Chapter 13: Mid-Ocean Rifts The Mid-Ocean Ridge System Figure 13.1. After Minster et al. (1974) Geophys. J. Roy. Astr. Soc., 36, 541-576.
  • 4.
    Ridge Segments andSpreading Rates Ridge Segments and Spreading Rates •Slow-spreading ridges: < 3 cm/a •Fast-spreading ridges: > 4 cm/a are considered •Temporal variations are also known
  • 5.
    Ridge Segments andSpreading Rates Ridge Segments and Spreading Rates Hierarchy of ridge segmentation Figure 13.3. Figure 13.3. S1-S4 refer to ridge segments of first- to fourth-order and D1-D4 refer to discontinuities between S1-S4 refer to ridge segments of first- to fourth-order and D1-D4 refer to discontinuities between corresponding segments. After Macdonald (1998). corresponding segments. After Macdonald (1998). OSC OSC Deval Deval OSC = overlapping spreading center Deval = deviation from axial linearity
  • 6.
    Oceanic Crust andUpper Mantle Structure Oceanic Crust and Upper Mantle Structure  4 layers distinguished via seismic velocities  Deep Sea Drilling Program  Dredging of fracture zone scarps  Ophiolites
  • 7.
    Oceanic Crust and UpperMantle Structure Typical Ophiolite Figure 13.4. Lithology and thickness of a typical ophiolite sequence, based on the Samial Ophiolite in Oman. After Boudier and Nicolas (1985) Earth Planet. Sci. Lett., 76, 84-92.
  • 8.
    Layer 1 A thinlayer of pelagic sediment Oceanic Crust and Upper Mantle Structure Oceanic Crust and Upper Mantle Structure Figure 13.5. Modified after Brown and Mussett (1993) The Inaccessible Earth: An Integrated View of Its Structure and Composition. Chapman & Hall. London.
  • 9.
    Layer 2 isbasaltic Subdivided into two sub-layers Layer 2A & B = pillow basalts Layer 2C = vertical sheeted dikes Oceanic Crust and Upper Mantle Structure Oceanic Crust and Upper Mantle Structure Figure 13.5. Modified after Brown and Mussett (1993) The Inaccessible Earth: An Integrated View of Its Structure and Composition. Chapman & Hall. London.
  • 10.
    Layer 3 morecomplex and controversial Believed to be mostly gabbros, crystallized from a shallow axial magma chamber (feeds the dikes and basalts) Layer 3A = upper isotropic and lower, somewhat foliated (“transitional”) gabbros Layer 3B is more layered, & may exhibit cumulate textures
  • 11.
    Discontinuous diorite and tonalite (“plagiogranite”) bodies= late differentiated liquids Oceanic Crust and Oceanic Crust and Upper Mantle Upper Mantle Structure Structure Figure 13.4. Lithology and thickness of a typical ophiolite sequence, based on the Samial Ophiolite in Oman. After Boudier and Nicolas (1985) Earth Planet. Sci. Lett., 76, 84-92.
  • 12.
    Layer 4 Layer 4= = ultramafic rocks ultramafic rocks Ophiolites: base of 3B Ophiolites: base of 3B grades into layered grades into layered cumulate wehrlite & cumulate wehrlite & gabbro gabbro Wehrlite Wehrlite intruded into intruded into layered gabbros layered gabbros Below Below   cumulate cumulate dunite dunite with harzburgite xenoliths with harzburgite xenoliths Below this is a Below this is a tectonite tectonite harzburgite and dunite harzburgite and dunite (unmelted residuum of the (unmelted residuum of the original mantle) original mantle)
  • 13.
    Elevation of ridgereduces with time as plate cools
  • 14.
    Petrography and MajorElement Chemistry Petrography and Major Element Chemistry A “typical” MORB is an olivine tholeiite with low K2O (< 0.2%) and low TiO2 (< 2.0%) Only glass is certain to represent liquid compositions
  • 15.
    The common crystallizationsequence is: olivine ( Mg- Cr spinel), olivine + plagioclase ( Mg-Cr spinel), olivine + plagioclase + clinopyroxene Figure 7.2. After Bowen (1915), A. J. Sci., and Morse (1994), Basalts and Phase Diagrams. Krieger Publishers.
  • 16.
     Fe-Ti oxides arerestricted to the groundmass, and thus form late in the MORB sequence Figure 8.2. AFM diagram for Crater Lake volcanics, Oregon Cascades. Data compiled by Rick Conrey (personal communication).
  • 17.
    The major elementchemistry of MORBs The major element chemistry of MORBs Originally considered to be extremely uniform, interpreted as a simple petrogenesis More extensive sampling has shown that they display a (restricted) range of compositions
  • 18.
    The major element Themajor element chemistry of MORBs chemistry of MORBs Table 13-2. Average Analyses and CIPW Norms of MORBs (BVTP Table 1.2.5.2) Oxide (wt%) All MAR EPR IOR SiO2 50.5 50.7 50.2 50.9 TiO2 1.56 1.49 1.77 1.19 Al2O3 15.3 15.6 14.9 15.2 FeO* 10.5 9.85 11.3 10.3 MgO 7.47 7.69 7.10 7.69 CaO 11.5 11.4 11.4 11.8 Na2O 2.62 2.66 2.66 2.32 K2O 0.16 0.17 0.16 0.14 P2O5 0.13 0.12 0.14 0.10 Total 99.74 99.68 99.63 99.64 Norm q 0.94 0.76 0.93 1.60 or 0.95 1.0 0.95 0.83 ab 22.17 22.51 22.51 19.64 an 29.44 30.13 28.14 30.53 di 21.62 20.84 22.5 22.38 hy 17.19 17.32 16.53 18.62 ol 0.0 0.0 0.0 0.0 mt 4.44 4.34 4.74 3.90 il 2.96 2.83 3.36 2.26 ap 0.30 0.28 0.32 0.23 All: Ave of glasses from Atlantic, Pacific and Indian Ocean ridges. MAR: Ave. of MAR glasses. EPR: Ave. of EPR glasses. IOR: Ave. of Indian Ocean ridge glasses.
  • 19.
    Figure 13.6. “Fenner-type”variation diagrams for basaltic glasses from the Afar region of the MAR. Note different ordinate scales. From Stakes et al. (1984) J. Geophys. Res., 89, 6995-7028. The major element The major element chemistry of MORBs chemistry of MORBs
  • 20.
    Conclusions about MORBs,and the processes beneath mid-ocean ridges  MORBs are not such completely uniform magmas  Chemical trends consistent with fractional crystallization of olivine, plagioclase, and perhaps clinopyroxene  MORBs cannot be primary magmas, but are derivative magmas resulting from fractional crystallization (up to ~ 60%)
  • 21.
     Fast ridge segments (EPR) a broader range of compositions and a larger proportion of evolved liquids  (magmas erupted slightly off the axis of ridges are more evolved than those at the axis itself) Figure 13.9. Histograms of over 1600 glass compositions from slow and fast mid- ocean ridges. After Sinton and Detrick (1992) J. Geophys. Res., 97, 197-216.
  • 22.
     For constant Mg#considerable variation is still apparent. Figure 13.10. Data from Schilling et al. (1983) Amer. J. Sci., 283, 510-586.
  • 23.
    Incompatible-rich and incompatible-poormantle source regions for MORB magmas  N-MORB (normal MORB) taps the depleted upper mantle source  Mg# > 65: K2O < 0.10 TiO2 < 1.0  E-MORB (enriched MORB, also called P-MORB for plume) taps the (deeper) fertile mantle  Mg# > 65: K2O > 0.10 TiO2 > 1.0
  • 24.
    Trace Element andIsotope Chemistry Trace Element and Isotope Chemistry REE diagram for MORBs Figure 13.11. Data from Schilling et al. (1983) Amer. J. Sci., 283, 510-586.
  • 25.
    E-MORBs are enrichedover N-MORBs: regardless of Mg# Lack of a distinct break suggests three MORB types  E-MORBs La/Sm > 1.8  N-MORBs La/Sm < 0.7  T-MORBs (transitional) intermediate values Figure 13.12. Data from Schilling et al. (1983) Amer. J. Sci., 283, 510-586.
  • 26.
     N-MORBs: 87 Sr/86 Sr <0.7035 and 143 Nd/144 Nd > 0.5030,  depleted mantle source  E-MORBs extend to more enriched values  stronger support distinct mantle reservoirs for N- type and E-type MORBs Figure 13.13. Data from Ito et al. (1987) Chemical Geology, 62, 157-176; and LeRoex et al. (1983) J. Petrol., 24, 267-318.
  • 27.
    Conclusions:  MORBs have >1 source region  The mantle beneath the ocean basins is not homogeneous  N-MORBs tap an upper, depleted mantle  E-MORBs tap a deeper enriched source  T-MORBs = mixing of N- and E- magmas during ascent and/or in shallow chambers
  • 28.
    Experimental data: parentwas multiply saturated with olivine, cpx, and opx  P range = 0.8 - 1.2 GPa (25-35 km) Figure 13.11. Data from Schilling et al. (1983) Amer. J. Sci., 283, 510-586.
  • 29.
    Implications of shallowP range from major element data:  MORB magmas = partial melting of mantle lherzolite in a rising solid diapir  Melting must take place over a range of pressures  P of multiple saturation = point at which melt was last in equilibrium with solid mantle Trace element and isotopic characteristics of melt reflect equilibrium distribution between melt and source reservoir (deeper for E-MORB) The major element (and hence mineralogical) character controlled by equilibrium between melt and residual mantle during rise until melt separates as a system with its own distinct character (shallow)
  • 30.
    MORB Petrogenesis MORB Petrogenesis  Separationof plates  Upward motion of mantle material into extended zone  Decompression partial melting associated with near-adiabatic rise  N-MORB melting initiated ~ 60-80 km depth in upper depleted mantle where it inherits depleted trace element and isotopic char. Generation Figure 13.14. After Zindler et al. (1984) Earth Planet. Sci. Lett., 70, 175-195. and Wilson (1989) Igneous Petrogenesis, Kluwer.
  • 31.
     Region of melting  Meltblobs separate at about 25-35 km Figure 13.14. After Zindler et al. (1984) Earth Planet. Sci. Lett., 70, 175-195. and Wilson (1989) Igneous Petrogenesis, Kluwer. Generation
  • 32.
     Lower enriched mantle reservoirmay also be tapped by an E-MORB plume initiated near the core-mantle boundary  Some ridge segments may be drawn to vigorous plumes (e.g. Iceland) Figure 13.14. After Zindler et al. (1984) Earth Planet. Sci. Lett., 70, 175- 195. and Wilson (1989) Igneous Petrogenesis, Kluwer.
  • 33.
    Langmuir “corner flow”model for rising and diverging mantle passing through a triangular melting region Hotter plume (deeper origin at a) creates larger melt triangle than cooler mantle (shallower origin at b) Mantle rising nearer axis of plume traverses greater portion of triangle and thus melts more extensively Figure 13.15. After Langmuir et al. (1992). AGU.
  • 34.
    Project Project FAMOUS FAMOUS (MAR) (MAR) From Ballard andVan Andel From Ballard and Van Andel (1977) (1977) GSA Bull., 88, 495-506. GSA Bull., 88, 495-506.
  • 35.
    The Axial MagmaChamber The Axial Magma Chamber Original Model  Semi-permanent  Fractional crystallization  derivative MORB magmas  Periodic reinjection of fresh, primitive MORB  Dikes upward through extending/faulting roof Figure 13.16. From Byran and Moore (1977) Geol. Soc. Amer. Bull., 88, 556-570. Hekinian et al. (1976) Contr. Min. Pet. 58, 107.
  • 36.
     Crystallization at topand sides  successive layers of gabbro (layer 3) “infinite onion”  Dense olivine and pyroxene crystals  ultramafic cumulates (layer 4)  Layering in lower gabbros (layer 3B) from density currents flowing down the sloping walls and floor?  Moho?? Seismic vs. Petrologic Figure 13.16. From Byran and Moore (1977) Geol. Soc. Amer. Bull., 88, 556-570.
  • 37.
    Figure 13-15. AfterPerfit et al. (1994) Geology, 22, 375-379. A modern concept of the axial magma chamber beneath a fast- spreading ridge
  • 38.
    The crystal mushzone contains perhaps 30% melt and constitutes an excellent boundary layer for the in situ crystallization process proposed by Langmuir Figure 11.12 From Winter (2001) An Introduction to Igneous and Metamorphic Petrology. Prentice Hall
  • 39.
    Attempts to reconcilethe lack of a large permanent magma chamber with the apparent cumulate textures and layered appearance of lower cumulates. Figure 13.18 “Gabbro glacier” model of ductile flow imparting a tectonic foliation to the lower gabbros. From Phipps Morgan et al. (1994).
  • 40.
    Attempts to reconcilethe lack of a large permanent magma chamber with the apparent cumulate textures and layered appearance of lower cumulates. Figure 13.19. “Sheeted sill” model in which shallow melt lens feeds into only a minor fraction of upper gabbros. From Kelemen et al. (1997).
  • 41.
    Attempts to reconcilethe lack of a large permanent magma chamber with the apparent cumulate textures and layered appearance of lower cumulates. Figure 13.20. Hybrid models for development of oceanic lithosphere at a fast-spreading ridge (arrows represent material flow-lines). a. Ductile flow model incorporating a second melt lens at the base of the crust (e.g. Schouten and Denham, 1995). b. Ductile flow with two melt lenses and off-axis sills (e.g. Boudier et al., 1996). c. Sheeted-sill hybrid model in which lower sills are fed from above by descending dense cumulate slurries from the upper melt lens (Rayleigh-Taylor instabilities) into the lower mush region (Buck, 2000).
  • 42.
     Melt body continuous reflector up to several kilometers along the ridge crest, with gaps at fracture zones, devals and OSCs  Large-scale chemical variations indicate poor mixing along axis, and/or intermittent liquid magma lenses, each fed by a source conduit Figure 13.21 After Sinton and Detrick (1992) J. Geophys. Res., 97, 197-216.
  • 43.
    Model for magmachamber beneath a slow-spreading ridge, such as the Mid-Atlantic Ridge  Dike-like mush zone and a smaller transition zone beneath well-developed rift valley  Most of body well below the liquidus temperature, so convection and mixing is far less likely than at fast ridges Distance (km) 10 10 5 5 0 2 4 6 8 Depth (km) Moho Transition zone Mush Gabbro Rift Valley Figure 13.22 After Sinton and Detrick (1992) J. Geophys. Res., 97, 197-216.
  • 44.
    Distance (km) 10 10 55 0 2 4 6 8 Depth (km) Moho Transition zone Mush Gabbro Rift Valley  Nisbit and Fowler (1978) suggested that numerous, small, ephemeral magma bodies occur at slow ridges (“infinite leek”)  Slow ridges are generally less differentiated than fast ridges  No continuous liquid lenses, so magmas entering the axial area are more likely to erupt directly to the surface (hence more primitive), with some mixing of mush Figure 13.22 After Sinton and Detrick (1992) J. Geophys. Res., 97, 197-216.
  • 45.
    Fast-Spreading Ridge Ophiolite example:Semial (Oman) Axial magma chambers are more steady-state, volcanism more frequent Smoother flanks (less faulted) Symmetric and less tectonically disrupted Ridge typically higher (shallower) Longer tectonic and magmatic segments Narrow axial rise with small axial trough Wider low seismic velocity (partial melt) zone Narrow axial neovolcanic zone Thinner lithosphere (higher heat flow) Thicker, more uniform crust Extensive sheet lava flows Slightly more evolved magmas (avg. Mg# = 52.8). Less compositional diversity within areas Mantle upwelling more “two-dimensional” Commonly exhibit “global” magmatic trends of Klein and Langmuir (1987, 1989). Slow-Spreading Ridge Ophiolite example: Troodos (Cyprus) Axial magma chambers are more ephemeral and scattered, volcanism less frequent Rougher flanks (highly faulted) Commonly asymmetric, more listric & detachment faulting. Layering is less uniform. Ridge typically lower (deeper) Shorter tectonic and magmatic segments Deep discontinuous axial valleys, uplifted flanks Narrower low velocity zone- melt lens rare Wider irregular axial neovolcanic zone with more distributed local sources  hills, seamounts Thicker lithosphere (lower heat flow) Thinner, less uniform crust Pillow lavas dominate extrusives Slightly less evolved magmas (avg. Mg# = 57.1). More compositional diversity within areas Mantle upwelling more “three-dimensional” Commonly exhibit “local” magmatic trends of Klein and Langmuir (1987, 1989). Table 13.3 General Differences Between Fast (> ~5 cm/a) and Slow-Spreading Ridges
  • 46.
    Figure 13.23. Topographicprofiles. From Macdonald (1998). AGU Along-axis Across-axis
  • 47.
    Figure 13.24 Interpretivecross-section across the slow-spreading Mid-Atlantic Ridge near the Kane fracture zone. Tectonic extension results in series of normal faults and exhumation along a shallow- dipping detachment surface, producing a disrupted and distinctly asymmetric architecture. From Thy and Dilek (2000). Listric and detachment faulting at slow-spreading centers (MAR). Note extensive exposure of ultramafic mantle rocks (source of dredge samples?).
  • 48.
    Figure 13.25 Geochemicalsystematics of Klein and Langmuir (1987, 1989) using the global trend vs. local trend scoring system of Niu and Batiza (1993). Global trends predominate at spreading (half) rates greater than 5 cm/a, whereas local trends are more apparent at lesser rates. After Niu and Batiza (1993) and Phipps Morgan et al. (1994).
  • 49.
    Figures I don’tuse in class Figures I don’t use in class Figure 13.6. Figure 13.6. From Stakes From Stakes et al. (1984) et al. (1984) J. Geophys. J. Geophys. Res., 89, 6995-7028. Res., 89, 6995-7028.
  • 50.
    Figures I don’t FiguresI don’t use in class use in class Figure 13.7. Figure 13.7. Data from Schilling et Data from Schilling et al. (1983) al. (1983) Amer. J. Sci., 283, 510-586. Amer. J. Sci., 283, 510-586.
  • 51.
    Figures I don’t FiguresI don’t use in class use in class
  • 52.
    Figures I don’t FiguresI don’t use in class use in class

Editor's Notes

  • #5 Major ridge segments probably relate to separate magma conduits to the surface, which propagate axially as more magma is added along conduit
  • #6 4 layers of the oceanic crust and mantle distinguished on the basis of discontinuities in seismic velocities Deep Sea Drilling Program rarely penetrates the volcanics, and then only to a maximum depth of 1500 m Dredging of fracture zone scarps  samples from deeper sources, but no reliable stratigraphic control Ophiolites = masses of oceanic crust and upper mantle thrust onto the edge of a continent or incorporated in mountain belts, now exposed by erosion
  • #8 Absent on newly generated crust at ridge axes, and thickens away from it
  • #9 Layer 2 A  B with fracture in-filling by mineral deposition (some call both A, and then call 2B sheeted dikes) Layer 2C = vertical sheeted dikes emplaced in the shallow brittle extensional environment at the ridge axis Many dikes have only a single chill margin  later dikes split and intruded earlier ones
  • #10 The layering may be horizontal, but more commonly dips at angles locally up to 90o
  • #11 At the top of the gabbros in the Oman are small discontinuous diorite and tonalite (“plagiogranite”) bodies = late differentiated liquids filter pressed and mobilized along the gabbro-sheeted dike contact, and may extend up into the pillow layer
  • #12 The boundary between layers 3 and 4 is, broadly speaking, the Moho Upper portion of layer 4 is thought to be layered, and of cumulate origin (olivine and pyroxenes sink to the bottom of the axial magma chamber) Below this is the original, unlayered, residual mantle material Exactly what is the crust/mantle boundary? 1) Top of the original mantle 2) Mafic/ultramafic transition (top of the added ultramafic cumulates) Is the mantle defined by petrogenesis or by composition? A number of authors distinguish a seismic Moho from a petrological Moho
  • #14 MORBs are chemically distinct from basalts of other petrogenetic associations Glass samples are very important chemically, because they represent liquid compositions, whereas the chemistry of phyric samples can be modified by crystal accumulation
  • #15 From textures and experiments on natural samples at low pressure the common crystallization sequence is:
  • #16  (hence the early Fe-enrichment characteristic of the tholeiite trend on an ACF diagram)
  • #18 All analyses are of glasses, so that only liquid compositions are represented Note the very low content of K2O and that all analyses are quartz-hypersthene normative (although olivine is common in the mode)
  • #19 Decrease in MgO and relative increase in FeO  early differentiation trend of tholeiites Patterns are compatible with crystal fractionation of the observed phenocryst phases Removal of olivine can raise the FeO/MgO ratio, and the separation of a calcic plagioclase can cause Al2O3 and CaO to decrease SiO2 is a ~ poor fractionation index (as we’d suspected) Na2O K2O TiO2 and P2O5 are all conserved and the concentration of each triples over FX range This implies that the parental magma undergoes 67% fractionation in a magma chamber somewhere beneath the ridge to reduce the original mass by 1/3
  • #21 Magma chamber processes may be different at fast-spreading ridges than at slow ones Fast ridge segments (EPR) display a broader range of compositions, and produce a larger proportion of evolved liquids than do slow segments Also (not shown here) magmas erupted slightly off the axis of ridges are more evolved than those at the axis itself
  • #22 Even when we compare for constant Mg# considerable variation is often still apparent Fig. 13-9 shows the variation in K2O with Mg# for the MAR data set of Schilling et al. (1983) MAR samples with high incompatibles come from the volcanic plateaus along the ridge, such as Jan Mayen, Iceland, and the Azores K2O, TiO2, and P2O5 are incompatible elements: their concentration is unlikely to be affected greatly by 0 - 40% fractional crystallization (F = 100 - 60) after separation from the mantle The concentrations of these elements are more likely to reflect characteristics inherited from the mantle source
  • #23 There must be incompatible-rich and incompatible-poor source regions for MORB magmas in the mantle beneath the ridges (related to the lower and upper mantle reservoirs?) N-MORB (normal MORB) taps the depleted (incompatible-poor) upper mantle source Mg# > 65: K2O < 0.10 TiO2 < 1.0 E-MORB (enriched MORB, also called P-MORB for plume) taps the deeper (incompatible-richer) mantle Mg# > 65: K2O > 0.10 TiO2 > 1.0 Major elements are not the best way to make these distinctions, which must be substantiated by trace element and isotopic differences
  • #24  Also see two types N-MORB has depleted trend E-MORB has non-depleted trend
  • #25 Ratios La/Sm vs. Mg#  slope for many REE analyses at once Note that E-MORBs (squares) always have a higher La/Sm ratio than N-MORBs (open triangles): enriched regardless of Mg# The lack of any distinct break between the enriched and depleted lavas suggests three MORB types E-MORBs have La/Sm > 1.8 N-MORBs have La/Sm < 0.7 T-MORBs (for “transitional”) have intermediate values Because T-MORBs form a continuous spectrum between N- and E-MORBs they may be the result of simple binary mixing of the two magma types T-MORBs do not necessarily imply a third distinct source
  • #26 Figure 13-11: 143Nd/144Nd vs. 87Sr/86Sr data for MORBs N-MORBs plot as a relatively tight cluster with 87Sr/86Sr < 0.7035 and 143Nd/144Nd > 0.5030, both of which indicate a depleted mantle source E-MORBs extend the MORB array to more enriched values (higher 87Sr/86Sr and lower 143Nd/144Nd), providing even stronger support for the distinct mantle reservoirs for N-type and E-type MORBs T-MORBs (not shown) exhibit intermediate mixed values
  • #27 The time required for the isotopic systems to develop suggests that these reservoirs have been distinct for a very long time
  • #28 Experimental data on the most likely parental MORBs and picrites indicates that the parent was multiply saturated with olivine, cpx, and opx in the P range of 0.8 to 1.2 Gpa (25-35 km) Spinel lherzolite field, which is compatible with the REEs lack of HREE depletion (expected if garnet were a residual phase) in the deeper garnet-lherzolite field Lack of a europium anomaly (expected if plagioclase were residual) in the shallow plagiocalse-lherz. field
  • #29 The depth of multiple saturation reflects the separation depth, which should be interpreted as the minimum depth of origin The ultimate source can be much deeper than the 25-35 km indicated by the experiments, perhaps as great as 80 km for N-MORB, and even deeper for plumes of E-MORB
  • #30 Continue with: % partial melting increases to ~ 15-40% as diapirs of melting mantle rise toward the surface % melted when reaches top depends on the source depth, temperature, and the rate of rise (and spreading) Melting is terminated by conductive heat loss to the surface near the top of the column, perhaps aided by the consumption of clinopyroxene, which, when gone, will create a discontinuous temperature jump in melting
  • #31 The region of melting is probably ~ 100 km wide, but is focused into the 3-8 km wide zone beneath the ridges Melt blobs separate at about 25-35 km where they are last in equilibrium with harzburgite residuum, and migrate to a depth of 1-2 km immediately beneath the ridge axis  axial magma chamber
  • #32 The plume may be of independent (but geograph-ically coincidental) origin The enriched plume undergoes decompression melting to form E-MORB As with N-MORB, the melt will not segregate until shallower depths, where the major element and mineralogical character is determined The E-MORB and N-MORB melt blobs may mix to varying degrees as funnel to the ridge (T-MORB)
  • #33 The plume may be of independent (but geograph-ically coincidental) origin The enriched plume undergoes decompression melting to form E-MORB As with N-MORB, the melt will not segregate until shallower depths, where the major element and mineralogical character is determined The E-MORB and N-MORB melt blobs may mix to varying degrees as funnel to the ridge (T-MORB)
  • #34 Relatively large (~ 5 km wide and 9 km deep)
  • #35 Relatively large (~ 5 km wide and 9 km deep)
  • #36 Infinite onion model, since it resembled an infinite number of onion shells created from within and added to the walls An elegant explanation for mid-ocean ridge magmatism and the creation of the oceanic crust The open-system periodic replenishment of primitive magma and the continuous differentiation within the chamber also explained: The narrow chemical range with a somewhat evolved character which reflected a near steady-state balance between differentiation and replenishment Not perfectly steady-state  the chemical variation shown in the erupted volcanics The more primitive nature of the volcanics toward the axis of the ridge and more evolved nature toward the flanks (observed by some investigators) could be explained by the fresh injections in the axial region and more advanced differentiation toward the cooler chamber walls All-in-all an excellent and elegant model… Too bad it’s wrong
  • #37 Recent seismic work has failed to detect any chambers of this size at ridges, thus causing a fundamental shift away from this traditional view of axial magma chambers as large, steady-state, predominantly molten bodies of extended duration Combines the magma chamber geometry proposed by Sinton and Detrick (1992) with the broad zone of volcanic activity noted by Perfit et al. (1994) Completely liquid body is a thin (tens to hundreds of meters thick) and narrow (< 2 km wide) sill-like lens 1-2 km beneath the seafloor Provides reflector noticed in detailed seismic profiles shot along and across sections of the EPR Melt surrounded by a wider mush and transition zone of low seismic velocity (transmits shear waves, but may still have a minor amount of melt) “Magma chamber” = melt + mush zone (the liquid portion is continuous through them) As liquid  mush the boundary moves progressively toward the liquid lens as crystallization proceeds Lens maintained by reinjection, much like the “infinite onion”
  • #38 Seismic velocities are still low beyond the mush (transition zone where the partially molten material grades to cooler solid gabbro) The small sill-like liquid chamber seems difficult to reconcile with the layered gabbros and cumulates, which appear to be more compatible with a large liquid chamber In situ crystallization in the mush zone, however may be a viable alternative for gabbro formation Much of the layering of ophiolite gabbros may be secondary, imposed during deformation of the spreading seafloor, and not by crystal settling
  • #39 Gabbro glacier model explains geometry of foliations observed at Oman (generally far from horizontal in upper zones), but does not explain layering or apparently primary near-vertical fabrics in upper gabbros
  • #43 Reduced heat and magma supply Steady-state eruptable magma lens is relinquished in favor of a dike-like mush zone and a smaller transition zone beneath the well-developed rift valley With the bulk of the body well below the liquidus temperature, convection and mixing is far less likely than at fast ridges
  • #44 Faster ridges with more persistent liquid chambers will, on average, undergo more advanced fractional crystallization in the liquid portion
  • #45 Faster ridges with more persistent liquid chambers will, on average, undergo more advanced fractional crystallization in the liquid portion
  • #46 Faster ridges with more persistent liquid chambers will, on average, undergo more advanced fractional crystallization in the liquid portion
  • #49 Variation in CaO/Al2O3 with Mg# for basaltic glasses from the Afar region of the MAR. The shaded region represents the range of glass analyses. Vectors show the expected path for liquid evolution resulting from fractional crystallization of the labeled phase. From Stakes et al. (1984).
  • #50 Variation diagrams for MORBs from the Mid-Atlantic Ridge. a. Plot of CaO/Al2O3 vs. Mg# /100 showing no discernible clinopyroxene trend. b. Pearce element ratio plot with 1:1 slope for (0.5(FeO+MgO)+2CaO+3Na2O) / K vs. Si/K, suggesting olivine + plagioclase fractionation. Data from Schilling et al. (1983).