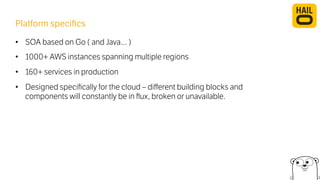
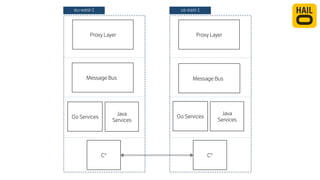
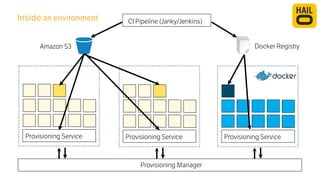
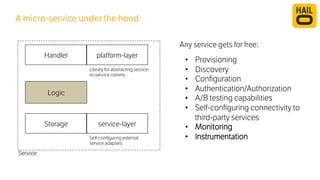
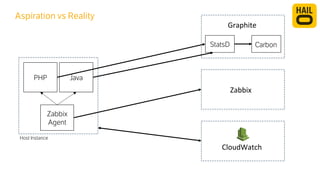
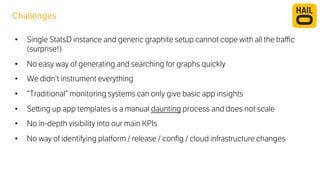
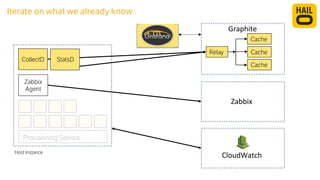
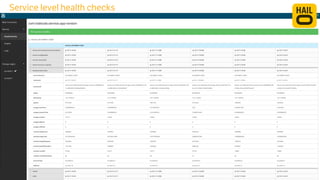
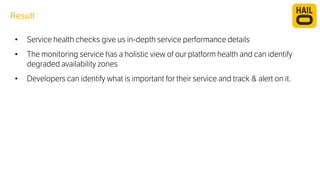
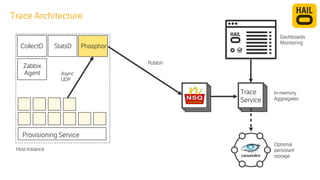
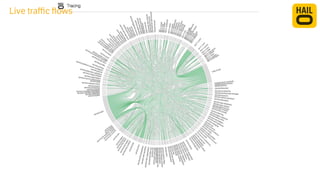
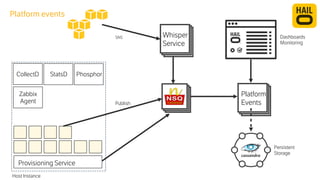
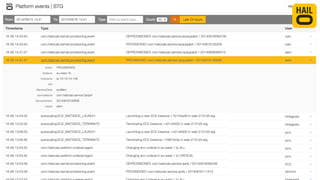
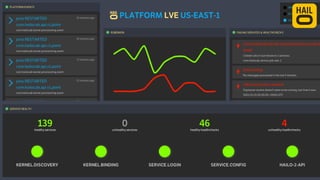
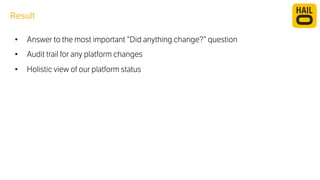
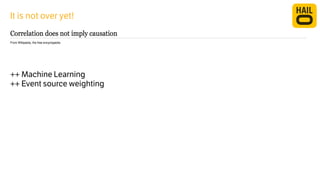
Monitoring micro-services platform 
Boyan Dimitrov, 
Platform Engineering @ Hailo @nathariel
Outline 
• Intro to the Hailo world 
• Platform Overview 
• Monitoring Evolution
The Platform 
Troll a platform by Swinsto101 / CC BY-SA 3.0 / Desaturated 
from original
Platform specifics 
• SOA based on Go ( and Java… ) 
• 1000+ AWS instances spanning multiple regions 
• 160+ services in production 
• Designed specifically for the cloud – different building blocks and 
components will constantly be in flux, broken or unavailable.
eu-west-1 
Proxy Layer 
Message Bus+ 
Go Services 
Java 
Services 
C* 
us-east-1 
Proxy Layer 
Message Bus+ 
Go Services Java 
C* 
Services
Provisioning Service 
CI Pipeline (Janky/Jenkins) 
Amazon S3 
Provisioning Service Provisioning Service 
Provisioning Manager 
Docker Registry 
Inside an environment
A micro-service under the hood 
Handler platform-layer 
Logic 
Storage 
Library for abstracting service-to- 
service comms 
service-layer 
Self-configuring external 
service adapters 
Service 
Any service gets for free: 
• Provisioning 
• Discovery 
• Configuration 
• Authentication/Authorization 
• A/B testing capabilities 
• Self-configuring connectivity to 
third-party services 
• Monitoring 
• Instrumentation
Mission: 
Define high level platform and business metrics 
Gather as many insights as possible 
Add automatic failover and recovery capabilities 
"A[ollo 8 Launch Control Room” by Tfawls 
/ Desaturated from original
PHP Java 
Host Instance 
Graphite 
Zabbix 
Aspiration vs Reality 
CloudWatch 
Zabbix 
Agent 
StatsD Carbon
Challenges 
• Single StatsD instance and generic graphite setup cannot cope with all the traffic 
(surprise!) 
• No easy way of generating and searching for graphs quickly 
• We didn’t instrument everything 
• “Traditional” monitoring systems can only give basic app insights 
• Se#ing up app templates is a manual daunting process and does not scale 
• No in-depth visibility into our main KPIs 
• No way of identifying platform / release / config / cloud infrastructure changes
Instrumentation++ 
“Airplaine board” by Smithore 
/ Desaturated from original
Host Instance 
Graphite 
Cache 
Zabbix 
Iterate on what we already know 
Relay 
CloudWatch 
CollectD StatsD 
Cache 
Cache 
Zabbix 
Agent
Result 
• Scaling up graphite and moving StatsD to every box allowed us to collect millions 
of metrics 
• Instrumenting everything gives us a lot of insights. 
• Grafana allows us to quickly build, store and search for important graphs. Widely 
adopted by the whole development team! 
Tip: Focus on upper 95th and 99th percentiles and work out from there.
Monitoring & 
Instrumentation
RReatzhiinekl Service 
Monitoring
Provisioning Service 
Message bus 
Monitoring 
Service 
New 
Service 
Publish 
Healthchecks 
Host Instance 
Provisioning Manager 
Binding Discovery 
Provisioning Service 
Host Instance 
Monitoring 
V2
healthcheck.Register(&healthcheck.HealthCheck{! 
Id: “MyHCId”,! 
ServiceName: ServiceName,! 
ServiceVersion: ServiceVersion,! 
Hostname: Hostname,! 
InstanceId: InstanceID,! 
Interval: time.Minute,! 
Checker: myCallbackFunc,! 
Priority: hc.Warning,! 
})!
Service level health checks
Result 
• Service health checks give us in-depth service performance details 
• The monitoring service has a holistic view of our platform health and can identify 
degraded availability zones 
• Developers can identify what is important for their service and track & alert on it.
Trace++ 
Monitoring & 
Instrumentation 
“Abstract conception of network and communication” 
by Leszekglasner / Desaturated from original
Trace Architecture 
CollectD StatsD 
Zabbix 
Agent 
Provisioning Service 
Host Instance 
Phosphor 
Publish 
Trace 
Service 
Dashboards 
Monitoring 
In-memory 
Aggregates 
Optional 
persistant 
storage 
Async 
UDP
Live traffic flows
Live traffic flows
Automatic request tracing
Result 
• Trace incoming requests and pinpoint bo#lenecks & SLA offenders 
• Easily identify problems on the request/response path 
• Quickly find out exactly which services participate on the request path
Robomon
Automated Jobs
Result 
• Identify business impacting issues immediately 
• Highlight the service on the critical path that is most likely responsible for the 
problems
Event Correlation 
“Connection” by A2bb5s 
/ Desaturated from the original
CollectD StatsD 
Zabbix 
Agent 
Provisioning Service 
Host Instance 
Phosphor 
Publish 
c 
Dashboards 
Monitoring 
Persistent 
Storage 
SNS 
Platform 
Events 
Whisper 
Service 
c 
Platform events
Result 
• Answer to the most important “Did anything change?” question 
• Audit trail for any platform changes 
• Holistic view of our platform status
It is not over yet! 
++ Machine Learning 
++ Event source weighting
Thanks! 
PS. We’re hiring! 
@nathariel 
boyan@hailocab.com London DevOps

Monitoring microservices platform

  • 1.
    Monitoring micro-services platform Boyan Dimitrov, Platform Engineering @ Hailo @nathariel
  • 2.
    Outline • Introto the Hailo world • Platform Overview • Monitoring Evolution
  • 4.
    The Platform Trolla platform by Swinsto101 / CC BY-SA 3.0 / Desaturated from original
  • 5.
    Platform specifics •SOA based on Go ( and Java… ) • 1000+ AWS instances spanning multiple regions • 160+ services in production • Designed specifically for the cloud – different building blocks and components will constantly be in flux, broken or unavailable.
  • 6.
    eu-west-1 Proxy Layer Message Bus+ Go Services Java Services C* us-east-1 Proxy Layer Message Bus+ Go Services Java C* Services
  • 7.
    Provisioning Service CIPipeline (Janky/Jenkins) Amazon S3 Provisioning Service Provisioning Service Provisioning Manager Docker Registry Inside an environment
  • 8.
    A micro-service underthe hood Handler platform-layer Logic Storage Library for abstracting service-to- service comms service-layer Self-configuring external service adapters Service Any service gets for free: • Provisioning • Discovery • Configuration • Authentication/Authorization • A/B testing capabilities • Self-configuring connectivity to third-party services • Monitoring • Instrumentation
  • 9.
    Mission: Define highlevel platform and business metrics Gather as many insights as possible Add automatic failover and recovery capabilities "A[ollo 8 Launch Control Room” by Tfawls / Desaturated from original
  • 10.
    PHP Java HostInstance Graphite Zabbix Aspiration vs Reality CloudWatch Zabbix Agent StatsD Carbon
  • 11.
    Challenges • SingleStatsD instance and generic graphite setup cannot cope with all the traffic (surprise!) • No easy way of generating and searching for graphs quickly • We didn’t instrument everything • “Traditional” monitoring systems can only give basic app insights • Se#ing up app templates is a manual daunting process and does not scale • No in-depth visibility into our main KPIs • No way of identifying platform / release / config / cloud infrastructure changes
  • 12.
    Instrumentation++ “Airplaine board”by Smithore / Desaturated from original
  • 13.
    Host Instance Graphite Cache Zabbix Iterate on what we already know Relay CloudWatch CollectD StatsD Cache Cache Zabbix Agent
  • 14.
    Result • Scalingup graphite and moving StatsD to every box allowed us to collect millions of metrics • Instrumenting everything gives us a lot of insights. • Grafana allows us to quickly build, store and search for important graphs. Widely adopted by the whole development team! Tip: Focus on upper 95th and 99th percentiles and work out from there.
  • 15.
  • 16.
  • 17.
    Provisioning Service Messagebus Monitoring Service New Service Publish Healthchecks Host Instance Provisioning Manager Binding Discovery Provisioning Service Host Instance Monitoring V2
  • 18.
    healthcheck.Register(&healthcheck.HealthCheck{! Id: “MyHCId”,! ServiceName: ServiceName,! ServiceVersion: ServiceVersion,! Hostname: Hostname,! InstanceId: InstanceID,! Interval: time.Minute,! Checker: myCallbackFunc,! Priority: hc.Warning,! })!
  • 19.
  • 20.
    Result • Servicehealth checks give us in-depth service performance details • The monitoring service has a holistic view of our platform health and can identify degraded availability zones • Developers can identify what is important for their service and track & alert on it.
  • 21.
    Trace++ Monitoring & Instrumentation “Abstract conception of network and communication” by Leszekglasner / Desaturated from original
  • 22.
    Trace Architecture CollectDStatsD Zabbix Agent Provisioning Service Host Instance Phosphor Publish Trace Service Dashboards Monitoring In-memory Aggregates Optional persistant storage Async UDP
  • 23.
  • 24.
  • 25.
  • 26.
    Result • Traceincoming requests and pinpoint bo#lenecks & SLA offenders • Easily identify problems on the request/response path • Quickly find out exactly which services participate on the request path
  • 27.
  • 28.
  • 29.
    Result • Identifybusiness impacting issues immediately • Highlight the service on the critical path that is most likely responsible for the problems
  • 30.
    Event Correlation “Connection”by A2bb5s / Desaturated from the original
  • 31.
    CollectD StatsD Zabbix Agent Provisioning Service Host Instance Phosphor Publish c Dashboards Monitoring Persistent Storage SNS Platform Events Whisper Service c Platform events
  • 34.
    Result • Answerto the most important “Did anything change?” question • Audit trail for any platform changes • Holistic view of our platform status
  • 35.
    It is notover yet! ++ Machine Learning ++ Event source weighting
  • 36.
    Thanks! PS. We’rehiring! @nathariel boyan@hailocab.com London DevOps