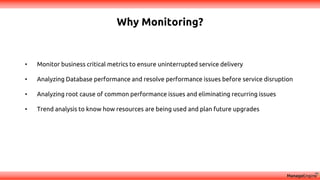
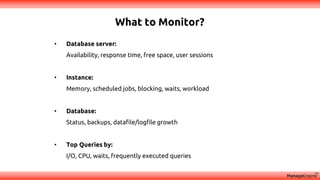
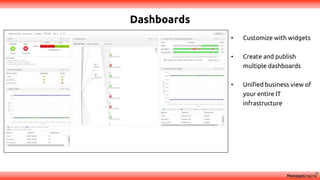
Sap hana modelling Online Training is Offering at Glory IT Technologies. We have Certified Working Professionals on this Modules. They trained so many Global Students. We also Provides Corporate Training, Job/Project Support Services to sap hana modelling. We are Only Institute Delivering Best Online Training Services to this Module.
En esta sesión revisamos las nuevas mejoras y funcionalidades que estarán implementadas en la siguiente versión de SQL Server principalmente en Seguridad, Rendimiento y Alta Disponibilidad
Maximize Dynamics AX System Performance with a Health CheckStoneridge Software
Discover tips on maximizing your system performance through a Dynamics AX Health Check. Your Microsoft Dynamics AX solution is critical to successfully managing your business. Proactively identifying and correcting issues will ensure those flagged items don't turn into future problems. View this deck put together by Stoneridge Software's Director of Technical Consulting Catherine McDade to covering the common issues identified by her team during Microsoft Dynamics AX Health Checks and the importance of correctly sizing and configuring your system.
VMworld 2013: Performance Management of Business Critical Applications using ...VMworld
VMworld 2013
Vas Mitra, VMware
David Overbeek, VMware
Learn more about VMworld and register at http://www.vmworld.com/index.jspa?src=socmed-vmworld-slideshare
Visualize cloud analytics for effective resource planning and understand the key performance metrics of your AWS, Azure and O-365 services to accelerate your digital transformation endeavours.
Learn how to monitor key metrics of your business critical servers, analyze process-wise CPU breakup and configure events, scheduled tasks, services and server actions.
Explore the components of a simple web app and then see how Applications Manager helps you discover and map relationships between your apps and take a look at the wide range of business critical metrics monitored for every app/ server in your network. We will also explore how to logically group your apps so as to achieve maximum productivity from your IT department.
Oracle Database Performance Tuning Advanced Features and Best Practices for DBAsZohar Elkayam
Oracle Week 2017 slides.
Agenda:
Basics: How and What To Tune?
Using the Automatic Workload Repository (AWR)
Using AWR-Based Tools: ASH, ADDM
Real-Time Database Operation Monitoring (12c)
Identifying Problem SQL Statements
Using SQL Performance Analyzer
Tuning Memory (SGA and PGA)
Parallel Execution and Compression
Oracle Database 12c Performance New Features
Discover the server in your IT ecosystem automatically and understand how various app components interact with each other. Reach us out at appmanager-support@manageengine.com
Learn how to track the user experience of your web applications across multiple geographical locations. Measure and understand the ways customers interact with your software. Discover the basic skills and information needed to get the most out of your synthetic monitoring.
This session introduces tools that can help you analyze and troubleshoot performance with SharePoint 2013. This sessions presents tools like perfmon, Fiddler, Visual Round Trip Analyzer, IIS LogParser, Developer Dashboard and of course we create Web and Load Tests in Visual Studio 2013.
At the end we also take a look at some of the tips and best practices to improve performance on SharePoint 2013.
NBITS provides the SAP BODS training in Hyderabad. It can provides online and classroom training by real time industrial experts. It can provide also the job assistance. BODS stand for Business objects Data services. Bods is one of the part of SAP.
Similar to Monitor database essentials with Applications Manager (20)
Learn how analyzing key website metrics that are related to user interactions will help you make insightful improvements. Understand how replaying individual customer transactions and analyzing every element of your webpage will help drill down to the root causes issues and create better content strategies respectively.
Learn how to how to monitor and gain code-level insights into the performance of your Java, Node.js, PHP, and .NET Core applications in real-time with the help of ManageEngine Applications Manager.
Get a complete overview of NetFlow Analyzer. Learn about the basic initial settings, configuration, customization, alerts, reports, and the various other features of the product.
Learn how to monitor the operational status of servers and virtual machines across an organization's IT infrastructure, track the status of critical metrics, tackle hardware problems, and optimize resource allocation effectively with ManageEngine Applications Manager.
Learn the various advanced monitoring, customization, troubleshooting and security features in Netflow Analyzer.
Agenda:
-Troubleshooting with forensics and ASAM
-Reporting and automation
-Traffic shaping
-Distributed Monitoring
Learn how to track key operational metrics of your Node.js and PHP infrastructure in real-time and get insight into the nuances of autonomous databases.
NetFlow Analyzer captures flow data and monitors interface bandwidth usage in real-time. This product overview will help you get the most out of NetFlow Analyzer.
Tips and tricks to monitor your network efficiently.
Through this training, learn more about:
1) Alarm severity levels
2) Threshold violation alarms
3) Other alarms : VMWare, Eventlogs, SNMP traps and Syslogs
Notifications
4) Using an IT workflow to remediate problems
Tips and tricks to monitor your network efficiently.
Through this training, learn more about:
1) Monitoring device availability
2) Monitoring server performance
3) Monitoring virtual server performance
4) Creating custom WMI monitor
5) Script monitoring
6) Troubleshooting tips
Accelerate your Kubernetes clusters with Varnish CachingThijs Feryn
A presentation about the usage and availability of Varnish on Kubernetes. This talk explores the capabilities of Varnish caching and shows how to use the Varnish Helm chart to deploy it to Kubernetes.
This presentation was delivered at K8SUG Singapore. See https://feryn.eu/presentations/accelerate-your-kubernetes-clusters-with-varnish-caching-k8sug-singapore-28-2024 for more details.
Welocme to ViralQR, your best QR code generator.ViralQR
Welcome to ViralQR, your best QR code generator available on the market!
At ViralQR, we design static and dynamic QR codes. Our mission is to make business operations easier and customer engagement more powerful through the use of QR technology. Be it a small-scale business or a huge enterprise, our easy-to-use platform provides multiple choices that can be tailored according to your company's branding and marketing strategies.
Our Vision
We are here to make the process of creating QR codes easy and smooth, thus enhancing customer interaction and making business more fluid. We very strongly believe in the ability of QR codes to change the world for businesses in their interaction with customers and are set on making that technology accessible and usable far and wide.
Our Achievements
Ever since its inception, we have successfully served many clients by offering QR codes in their marketing, service delivery, and collection of feedback across various industries. Our platform has been recognized for its ease of use and amazing features, which helped a business to make QR codes.
Our Services
At ViralQR, here is a comprehensive suite of services that caters to your very needs:
Static QR Codes: Create free static QR codes. These QR codes are able to store significant information such as URLs, vCards, plain text, emails and SMS, Wi-Fi credentials, and Bitcoin addresses.
Dynamic QR codes: These also have all the advanced features but are subscription-based. They can directly link to PDF files, images, micro-landing pages, social accounts, review forms, business pages, and applications. In addition, they can be branded with CTAs, frames, patterns, colors, and logos to enhance your branding.
Pricing and Packages
Additionally, there is a 14-day free offer to ViralQR, which is an exceptional opportunity for new users to take a feel of this platform. One can easily subscribe from there and experience the full dynamic of using QR codes. The subscription plans are not only meant for business; they are priced very flexibly so that literally every business could afford to benefit from our service.
Why choose us?
ViralQR will provide services for marketing, advertising, catering, retail, and the like. The QR codes can be posted on fliers, packaging, merchandise, and banners, as well as to substitute for cash and cards in a restaurant or coffee shop. With QR codes integrated into your business, improve customer engagement and streamline operations.
Comprehensive Analytics
Subscribers of ViralQR receive detailed analytics and tracking tools in light of having a view of the core values of QR code performance. Our analytics dashboard shows aggregate views and unique views, as well as detailed information about each impression, including time, device, browser, and estimated location by city and country.
So, thank you for choosing ViralQR; we have an offer of nothing but the best in terms of QR code services to meet business diversity!
LF Energy Webinar: Electrical Grid Modelling and Simulation Through PowSyBl -...DanBrown980551
Do you want to learn how to model and simulate an electrical network from scratch in under an hour?
Then welcome to this PowSyBl workshop, hosted by Rte, the French Transmission System Operator (TSO)!
During the webinar, you will discover the PowSyBl ecosystem as well as handle and study an electrical network through an interactive Python notebook.
PowSyBl is an open source project hosted by LF Energy, which offers a comprehensive set of features for electrical grid modelling and simulation. Among other advanced features, PowSyBl provides:
- A fully editable and extendable library for grid component modelling;
- Visualization tools to display your network;
- Grid simulation tools, such as power flows, security analyses (with or without remedial actions) and sensitivity analyses;
The framework is mostly written in Java, with a Python binding so that Python developers can access PowSyBl functionalities as well.
What you will learn during the webinar:
- For beginners: discover PowSyBl's functionalities through a quick general presentation and the notebook, without needing any expert coding skills;
- For advanced developers: master the skills to efficiently apply PowSyBl functionalities to your real-world scenarios.
A tale of scale & speed: How the US Navy is enabling software delivery from l...sonjaschweigert1
Rapid and secure feature delivery is a goal across every application team and every branch of the DoD. The Navy’s DevSecOps platform, Party Barge, has achieved:
- Reduction in onboarding time from 5 weeks to 1 day
- Improved developer experience and productivity through actionable findings and reduction of false positives
- Maintenance of superior security standards and inherent policy enforcement with Authorization to Operate (ATO)
Development teams can ship efficiently and ensure applications are cyber ready for Navy Authorizing Officials (AOs). In this webinar, Sigma Defense and Anchore will give attendees a look behind the scenes and demo secure pipeline automation and security artifacts that speed up application ATO and time to production.
We will cover:
- How to remove silos in DevSecOps
- How to build efficient development pipeline roles and component templates
- How to deliver security artifacts that matter for ATO’s (SBOMs, vulnerability reports, and policy evidence)
- How to streamline operations with automated policy checks on container images
State of ICS and IoT Cyber Threat Landscape Report 2024 previewPrayukth K V
The IoT and OT threat landscape report has been prepared by the Threat Research Team at Sectrio using data from Sectrio, cyber threat intelligence farming facilities spread across over 85 cities around the world. In addition, Sectrio also runs AI-based advanced threat and payload engagement facilities that serve as sinks to attract and engage sophisticated threat actors, and newer malware including new variants and latent threats that are at an earlier stage of development.
The latest edition of the OT/ICS and IoT security Threat Landscape Report 2024 also covers:
State of global ICS asset and network exposure
Sectoral targets and attacks as well as the cost of ransom
Global APT activity, AI usage, actor and tactic profiles, and implications
Rise in volumes of AI-powered cyberattacks
Major cyber events in 2024
Malware and malicious payload trends
Cyberattack types and targets
Vulnerability exploit attempts on CVEs
Attacks on counties – USA
Expansion of bot farms – how, where, and why
In-depth analysis of the cyber threat landscape across North America, South America, Europe, APAC, and the Middle East
Why are attacks on smart factories rising?
Cyber risk predictions
Axis of attacks – Europe
Systemic attacks in the Middle East
Download the full report from here:
https://sectrio.com/resources/ot-threat-landscape-reports/sectrio-releases-ot-ics-and-iot-security-threat-landscape-report-2024/
Securing your Kubernetes cluster_ a step-by-step guide to success !KatiaHIMEUR1
Today, after several years of existence, an extremely active community and an ultra-dynamic ecosystem, Kubernetes has established itself as the de facto standard in container orchestration. Thanks to a wide range of managed services, it has never been so easy to set up a ready-to-use Kubernetes cluster.
However, this ease of use means that the subject of security in Kubernetes is often left for later, or even neglected. This exposes companies to significant risks.
In this talk, I'll show you step-by-step how to secure your Kubernetes cluster for greater peace of mind and reliability.
The Art of the Pitch: WordPress Relationships and SalesLaura Byrne
Clients don’t know what they don’t know. What web solutions are right for them? How does WordPress come into the picture? How do you make sure you understand scope and timeline? What do you do if sometime changes?
All these questions and more will be explored as we talk about matching clients’ needs with what your agency offers without pulling teeth or pulling your hair out. Practical tips, and strategies for successful relationship building that leads to closing the deal.
Epistemic Interaction - tuning interfaces to provide information for AI supportAlan Dix
Paper presented at SYNERGY workshop at AVI 2024, Genoa, Italy. 3rd June 2024
https://alandix.com/academic/papers/synergy2024-epistemic/
As machine learning integrates deeper into human-computer interactions, the concept of epistemic interaction emerges, aiming to refine these interactions to enhance system adaptability. This approach encourages minor, intentional adjustments in user behaviour to enrich the data available for system learning. This paper introduces epistemic interaction within the context of human-system communication, illustrating how deliberate interaction design can improve system understanding and adaptation. Through concrete examples, we demonstrate the potential of epistemic interaction to significantly advance human-computer interaction by leveraging intuitive human communication strategies to inform system design and functionality, offering a novel pathway for enriching user-system engagements.
Elevating Tactical DDD Patterns Through Object CalisthenicsDorra BARTAGUIZ
After immersing yourself in the blue book and its red counterpart, attending DDD-focused conferences, and applying tactical patterns, you're left with a crucial question: How do I ensure my design is effective? Tactical patterns within Domain-Driven Design (DDD) serve as guiding principles for creating clear and manageable domain models. However, achieving success with these patterns requires additional guidance. Interestingly, we've observed that a set of constraints initially designed for training purposes remarkably aligns with effective pattern implementation, offering a more ‘mechanical’ approach. Let's explore together how Object Calisthenics can elevate the design of your tactical DDD patterns, offering concrete help for those venturing into DDD for the first time!
SAP Sapphire 2024 - ASUG301 building better apps with SAP Fiori.pdfPeter Spielvogel
Building better applications for business users with SAP Fiori.
• What is SAP Fiori and why it matters to you
• How a better user experience drives measurable business benefits
• How to get started with SAP Fiori today
• How SAP Fiori elements accelerates application development
• How SAP Build Code includes SAP Fiori tools and other generative artificial intelligence capabilities
• How SAP Fiori paves the way for using AI in SAP apps
DevOps and Testing slides at DASA ConnectKari Kakkonen
My and Rik Marselis slides at 30.5.2024 DASA Connect conference. We discuss about what is testing, then what is agile testing and finally what is Testing in DevOps. Finally we had lovely workshop with the participants trying to find out different ways to think about quality and testing in different parts of the DevOps infinity loop.
Dev Dives: Train smarter, not harder – active learning and UiPath LLMs for do...UiPathCommunity
💥 Speed, accuracy, and scaling – discover the superpowers of GenAI in action with UiPath Document Understanding and Communications Mining™:
See how to accelerate model training and optimize model performance with active learning
Learn about the latest enhancements to out-of-the-box document processing – with little to no training required
Get an exclusive demo of the new family of UiPath LLMs – GenAI models specialized for processing different types of documents and messages
This is a hands-on session specifically designed for automation developers and AI enthusiasts seeking to enhance their knowledge in leveraging the latest intelligent document processing capabilities offered by UiPath.
Speakers:
👨🏫 Andras Palfi, Senior Product Manager, UiPath
👩🏫 Lenka Dulovicova, Product Program Manager, UiPath
3. Why Monitoring?
• Monitor business critical metrics to ensure uninterrupted service delivery
• Analyzing Database performance and resolve performance issues before service disruption
• Analyzing root cause of common performance issues and eliminating recurring issues
• Trend analysis to know how resources are being used and plan future upgrades
4. What to Monitor?
• Database server:
Availability, response time, free space, user sessions
• Instance:
Memory, scheduled jobs, blocking, waits, workload
• Database:
Status, backups, datafile/logfile growth
• Top Queries by:
I/O, CPU, waits, frequently executed queries
5. Tools Used
• Perfmon
• Extended Events
• DMVs and System views
• Query Store
• Custom Scripts
Note: Some tools do not work with all versions of servers. Please check version compatibility if they don't.
7. Prerequisites to add DB
servers
• Protocol used: JDBC connection
• Ports required: Port used by the DB server (SQL:1433,Oracle:1521)
• User Permissions:
MS SQL:
http://help.appmanager.com/applications-manager-prerequisites$mssql
Oracle DB:
http://help.appmanager.com/applications-manager-prerequisites$OracleDatabaseServers
9. Represents whether a particular monitor is currently available to
undertake requests.
Represents the overall state of the monitor. Depends on
the severity of all the other attributes.
Up
Down
Availabilit
y
Clear
Warning
Critical
Health
10. Log details &
DB overview
Monitor each DB & its underlying metrics
12. Connection
stats
Monitor metrics like:
• Connection time
• Number of users connected to the system.
• Logins, Logouts per min
• Number of SQL batch requests received by
server.
15. Backup/ Restore
stats
Displays the performance metric about various SQL backup set
present in the SQL Server.
Select Action to enable/disable monitoring, and reset status.
16. Replication
stats
Display information of log shipping status, publications, subscriptions,
information about each replication agents, agents history running in the
corresponding SQL server.
17. Session
details
Displays the SQL server session ID running in SQL Server along with its status.
Shows information on blocked request and allows user to kill user session.
25. SGA sharing
Monitor metrics like:
• Buffer, Data Dictionary & Library hit
ratio
• System Global Area (SGA) details.
26. Tablespace
stats
• Identify used & free bytes of individual table space.
• Monitor Reads and Writes per min
• Track data files & monitor datafile auto extend
27. Session
details
• Identify ONLINE, OFFLINE, or INVALID sessions as well as sessions initiated
by specific users.
• Monitor number of memory sorts, table scans performed.
• Track physical & logical reads of the session as well as buffer cache hit ratio
34. Reports
Trend Analysis Report:
Understand performance trends of your business servers based on historical data to predict future trends
and stay informed.
Forecast Report:
Let Applications Manager make forecast based on utilization as well as growth trends of your servers
Reports based on Monitor Types and their respective metrics:
Generate reports instantaneously for custom attributes of individual servers, monitor types and even
monitor groups
35. Trend analysis report
• History Report
• Hour of Day Report
• Day of Week Report
• Statistical Report
• Heat Chart
36. Forecast report
• Balance hardware
costs with computing
needs.
• Plan future utilization
requirements.
37. View & compare reports
Compare performance attribute
reports of different monitors.
38. Dashboards
• Customize with widgets
• Create and publish
multiple dashboards
• Unified business view of
your entire IT
infrastructure