Download to read offline
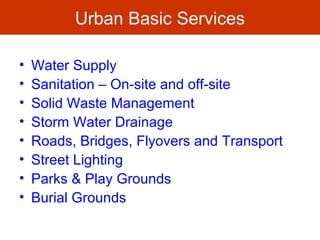
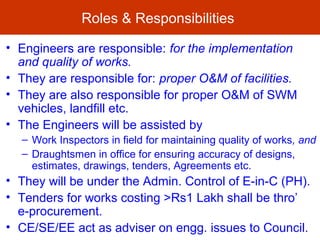
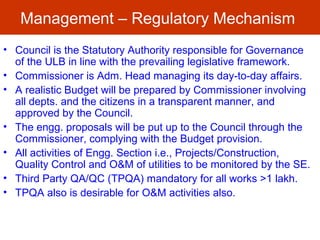
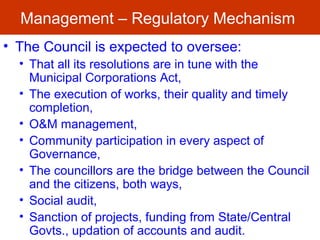
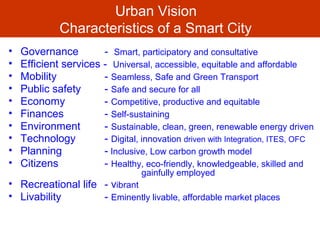
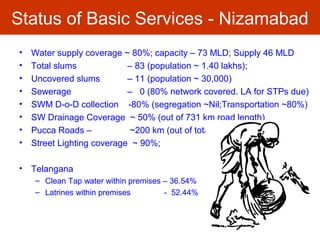


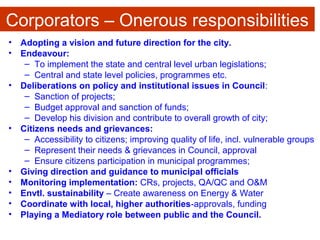
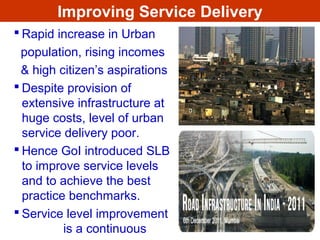


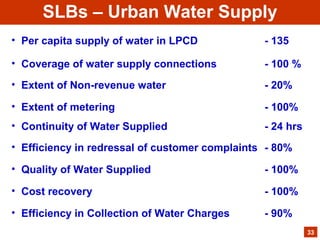
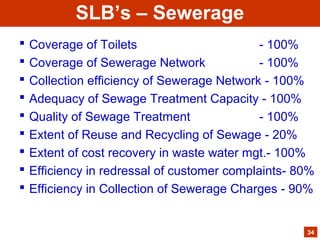
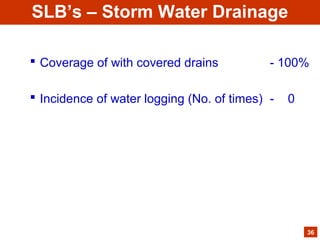


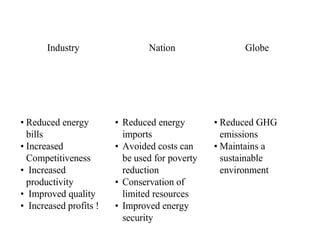

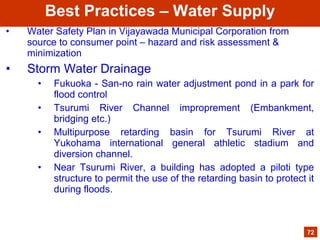


The document presents a comprehensive overview of improving urban basic service delivery in municipalities, detailing various services like water supply, sanitation, waste management, and infrastructure development. It highlights the regulatory mechanisms, roles of officials, challenges in service delivery, and the need for participatory governance in achieving urban sustainability. Furthermore, it emphasizes the importance of city development planning and service level benchmarking to enhance the quality of life for citizens amidst rapid urbanization.

![Public private partnership_(sanitation)[1]](https://cdn.slidesharecdn.com/ss_thumbnails/publicprivatepartnershipsanitation1-170904035328-thumbnail.jpg?width=640&height=640&fit=bounds)


![Smart.city.VSIT.Vasad.April.6.21 [Autosaved] (1).pptx](https://cdn.slidesharecdn.com/ss_thumbnails/smart-250417130949-fe17247c-thumbnail.jpg?width=640&height=640&fit=bounds)


