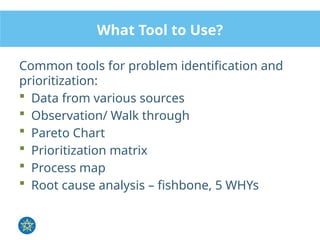
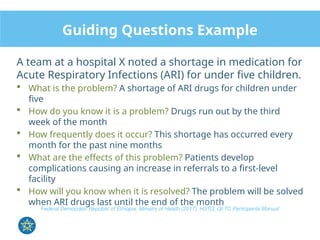
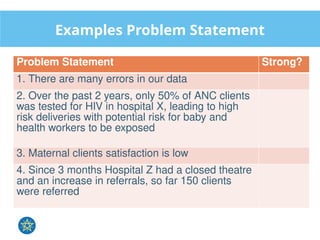
Problem Identification, Prioritization
and Aim Setting
Plenary Discussion
 You have had an ongoing problem with
frequently occurring maternal mortalities
(more than 3 per month) in your facility. You
have been tasked to bring a solution to this
problem.
 What should be done differently to reduce
maternal deaths in the facility?
 Time: 5 minutes
Module Objectives
 Use appropriate problem identification and
prioritization tools for aim setting
 Identify problems using the dimensions of quality
 Utilize different types of data to identify problems
 Apply tools to prioritize problems
 Formulate problem statement
 Formulate aim statement for identified problems
Introduction
A problem is
“ the difference between things as perceived and
things as desired”
Gause and Weinberg (1989)
“ the gap between the existing state and the
desired state of a process”
Health Quality Ontario
Problem Identification
Problem Identification in QI
 What to improve?
 Need to identify the opportunity for improvement
 Effectiveness issues: system does not deliver
according to performance expectations
 Efficiency issues: system uses too many
resources to deliver its performance
 Responsiveness issues: system does not
address the needs of its clients
Federal Democratic Republic of Ethiopia, Ministry of Health (2017), HSTQ, QI-TC Participants Manual
Identify Problems in Quality of Care
Safe
Effective
Efficient
Equitable
Timely
Person
Centered
Six healthcare
quality
dimensions
Institute of Medicine, 2001
Adapted from Institute of Medicine (2001) Six Healthcare Quality Dimensions
Small Group Exercise
 Form groups of 3-5 participants
 Use the 6 dimensions of Quality Care and
brainstorm about existing performance gaps
in the Ethiopian Healthcare System (or
specifically the facility/organization they work)
 Time: 10 minutes
What Tool to Use?
Common tools for problem identification and
prioritization:
 Data from various sources
 Observation/ Walk through
 Pareto Chart
 Prioritization matrix
 Process map
 Root cause analysis – fishbone, 5 WHYs
Small Group Exercise – Data use
 Identify Problems using Data sources –
registers
 Work in groups of 3-5 participants
 Use the data provided in the Module 4 Annex,
page 182-185
 Analyze the data and identify an area for
improvement
 Time: 15 minutes
Compare Performance with Target (I)
Jan Feb Mar Apr May Jun Jul Aug Sep Oct Nov Dec
0
5
10
15
20
25
30
35
40
45
50
First Trimester Registrants for ANC in Hospital X
1st Trimester registrants Total ANC registrants
Number
Observation
Data QI Clinical skills
Observation - Walk-through
 Enables providers to better understand the
experience of care from the patients’ and
families’ point of view
 It generates data that address the total
experience of the patient including
frustrations, confusion, anxiety
Adapted from Institute for Healthcare Improvement, Walk-through Tool
Prioritization Tools
Pareto Chart and Prioritization
Matrix
~~~~~~Vilfredo Pareto~~~~~~
If you’re Noah, and your ark
is about to sink, look for the
elephants first, because you
can throw over a bunch of
cats, dogs, squirrels, and
everything else that is just a
small animal and your ark
will keep sinking. But if you
can find one elephant to get
overboard, you’re in much
better shape.
Pareto Principle
 A small amount of effort accounts for most of
the results.
 80/20 rule
What is a Pareto Chart?
A graphical tool that helps to prioritize efforts to where
they will have the most impact.
It is made up of three (3) key components:
1. Bar/Column chart – representing
categories/frequencies displayed in order of size
2. Line graph – representing the cumulative percentage
3. Two vertical (y-) axis
Steps for Constructing a Pareto Chart
1. List all the possible categories/groups
2. Collect the data – how many of each
3. Arrange the categories/groups from the highest to the lowest
frequency/impact
4. Calculate the total, add up the frequencies
5. Calculate percentage for each category/group
6. Calculate the cumulative percentage
7. Draw the axes – horizontal: categories/groups
vertical left: frequencies/ ‘raw’ data
vertical right: cumulative percentage
8. Plot the data in your graph
9. Label the axes and annotate the graph (specifying the vital few
and useful many)
Prepare Pareto Chart (30 min.)
Contributing factor
(Causes of Neonatal deaths) Frequency Percentage
Cumulative
Percentage
Prematurity 49 32.2% 32.2%
Birth Asphyxia 45 29.6% 61.8%
Neonatal Sepsis 31 20.4% 82.2%
Congenital Abnormalities 11 7.2% 89.5%
Pneumonia 9 5.9% 95.4%
Tetanus 4 2.6% 98.0%
Malnutrition 1 0.7% 98.7%
Diarrhea 1 0.7% 99.3%
Birth injury 1 0.7% 100%
Total 152 100%
Pareto Chart on Neonatal deaths
 Causes of neonatal deaths in the scenario facility
0
10
20
30
40
50
60
0
20
40
60
80
100
Cause of Neonatal Deaths in 2016
Frequencies
Cumulative
percentage
Useful many
Vital few
Priority Matrix
 Which identified problem should be
prioritized?
 Common criteria used to prioritize problems
 Cost and/or gains when resolved
 Availability of solutions
 Availability of resources (staff, time, equipment,
etc.)
 Urgency of solving
 Size of problem
Adapted from National Association of Country & City Health Officials (NACCHO), First Things First
Step-by-Step Instructions
1. Create a matrix
2. List the problems vertically and the criteria
horizontally
3. Add one extra column on the right for
priority score
4. Weight the criteria, according to level of
importance
5. Rate the problems for the criteria according
to predetermined rating scale
6. Calculate priority scores
Adapted from National Association of Country & City Health Officials (NACCHO), First Things First
Example of Prioritization Matrix
*Rating Scale used: 0-15
Priority Score
Small Group Exercise
 Work in groups of 3-5 participants (per facility,
department, organization)
 Brainstorm with your group about prevailing
health problems in your work place
 List the problems and the criteria you use to rank
them
 Develop the prioritization matrix
 Which health problem are you prioritizing and
why?
 Use your project workbook (Annexed)
 Time: 20 minutes
Problem Statement
Components of Problem Statement
A clear and concise statement that describes
the symptoms of a problem. Guided by the
following questions:
1. What is the problem? What is not functioning as
desired? What are the boundaries? (Size)
2. How do we know it is a problem?
3. How long has it be a problem (time)?
4. What are the effects (impact) of this problem?
5. Where does the problem exist?
6. How will we know the problem is resolved?
Federal Democratic Republic of Ethiopia, Ministry of Health (2017), HSTQ, QI-TC Participants Manual
What is does NOT do…
 Does NOT include the causes
 Does NOT include the actions or corrections
required
 Does NOT assign blame
 Does NOT address more than one problem
Guiding Questions Example
A team at a hospital X noted a shortage in medication for
Acute Respiratory Infections (ARI) for under five children.
 What is the problem? A shortage of ARI drugs for children under
five
 How do you know it is a problem? Drugs run out by the third
week of the month
 How frequently does it occur? This shortage has occurred every
month for the past nine months
 What are the effects of this problem? Patients develop
complications causing an increase in referrals to a first-level
facility
 How will you know when it is resolved? The problem will be solved
when ARI drugs last until the end of the month
Federal Democratic Republic of Ethiopia, Ministry of Health (2017), HSTQ, QI-TC Participants Manual
Examples Problem Statement
Problem Statement Strong?
1. There are many errors in our data
2. Over the past 2 years, only 50% of ANC clients
was tested for HIV in hospital X, leading to high
risk deliveries with potential risk for baby and
health workers to be exposed
3. Maternal clients satisfaction is low
4. Since 3 months Hospital Z had a closed theatre
and an increase in referrals, so far 150 clients
were referred
Aim Statement
Purpose of Aim Statement
 1st
Principle of Improvement – know why to
improve
 An Aim Statement is an explicit description
with specific actions or focus
 An internal and external communication tool
for the work to be done
Components of Aim Statement
Specific
Measureable
Ambitious (Achievable)
Realistic
Time bound
Examples of Aim Statements
S M A R T
To increase the percentage of syphilis
tested pregnant mothers attending
ANC from 0% to 80% by the end of
January 2017.
To improve PNC within 48 hours
To increase number of 4th
ANC from
50% to 85% at Y.P. Hospital by the end
of June 2017.
To increase skilled delivery from 68% to
85% by the end of May 2017.
To increase the percentage of
inpatient referral feedback given from
Quality Improvement Project Work
Section I – Problem identification,
prioritization and aim statement
 Develop a problem statement and a SMART aim
statement for a problem identified in your
facility/organization
 If relevant use the prioritized problem from the
priority matrix exercise
 Document in your project workbook, subsequent
sessions will build on this (Annexed)
 Time: 20 minutes
Summary
 Problem identification is the first step in QI
 Prioritization tools can help focus which
problem to start with
 A good problem statement answers a series
questions including the size, impact, location
and frequency of the problem
 A aim statement should be SMART

Module 5_Problem_Identification,_Prioritization_and_Aim_Statement.pptx

  • 1.
  • 2.
    Plenary Discussion  Youhave had an ongoing problem with frequently occurring maternal mortalities (more than 3 per month) in your facility. You have been tasked to bring a solution to this problem.  What should be done differently to reduce maternal deaths in the facility?  Time: 5 minutes
  • 3.
    Module Objectives  Useappropriate problem identification and prioritization tools for aim setting  Identify problems using the dimensions of quality  Utilize different types of data to identify problems  Apply tools to prioritize problems  Formulate problem statement  Formulate aim statement for identified problems
  • 4.
    Introduction A problem is “the difference between things as perceived and things as desired” Gause and Weinberg (1989) “ the gap between the existing state and the desired state of a process” Health Quality Ontario
  • 5.
  • 6.
    Problem Identification inQI  What to improve?  Need to identify the opportunity for improvement  Effectiveness issues: system does not deliver according to performance expectations  Efficiency issues: system uses too many resources to deliver its performance  Responsiveness issues: system does not address the needs of its clients Federal Democratic Republic of Ethiopia, Ministry of Health (2017), HSTQ, QI-TC Participants Manual
  • 7.
    Identify Problems inQuality of Care Safe Effective Efficient Equitable Timely Person Centered Six healthcare quality dimensions Institute of Medicine, 2001 Adapted from Institute of Medicine (2001) Six Healthcare Quality Dimensions
  • 8.
    Small Group Exercise Form groups of 3-5 participants  Use the 6 dimensions of Quality Care and brainstorm about existing performance gaps in the Ethiopian Healthcare System (or specifically the facility/organization they work)  Time: 10 minutes
  • 9.
    What Tool toUse? Common tools for problem identification and prioritization:  Data from various sources  Observation/ Walk through  Pareto Chart  Prioritization matrix  Process map  Root cause analysis – fishbone, 5 WHYs
  • 10.
    Small Group Exercise– Data use  Identify Problems using Data sources – registers  Work in groups of 3-5 participants  Use the data provided in the Module 4 Annex, page 182-185  Analyze the data and identify an area for improvement  Time: 15 minutes
  • 11.
    Compare Performance withTarget (I) Jan Feb Mar Apr May Jun Jul Aug Sep Oct Nov Dec 0 5 10 15 20 25 30 35 40 45 50 First Trimester Registrants for ANC in Hospital X 1st Trimester registrants Total ANC registrants Number
  • 12.
  • 13.
    Observation - Walk-through Enables providers to better understand the experience of care from the patients’ and families’ point of view  It generates data that address the total experience of the patient including frustrations, confusion, anxiety Adapted from Institute for Healthcare Improvement, Walk-through Tool
  • 14.
    Prioritization Tools Pareto Chartand Prioritization Matrix ~~~~~~Vilfredo Pareto~~~~~~ If you’re Noah, and your ark is about to sink, look for the elephants first, because you can throw over a bunch of cats, dogs, squirrels, and everything else that is just a small animal and your ark will keep sinking. But if you can find one elephant to get overboard, you’re in much better shape.
  • 15.
    Pareto Principle  Asmall amount of effort accounts for most of the results.  80/20 rule
  • 16.
    What is aPareto Chart? A graphical tool that helps to prioritize efforts to where they will have the most impact. It is made up of three (3) key components: 1. Bar/Column chart – representing categories/frequencies displayed in order of size 2. Line graph – representing the cumulative percentage 3. Two vertical (y-) axis
  • 17.
    Steps for Constructinga Pareto Chart 1. List all the possible categories/groups 2. Collect the data – how many of each 3. Arrange the categories/groups from the highest to the lowest frequency/impact 4. Calculate the total, add up the frequencies 5. Calculate percentage for each category/group 6. Calculate the cumulative percentage 7. Draw the axes – horizontal: categories/groups vertical left: frequencies/ ‘raw’ data vertical right: cumulative percentage 8. Plot the data in your graph 9. Label the axes and annotate the graph (specifying the vital few and useful many)
  • 18.
    Prepare Pareto Chart(30 min.) Contributing factor (Causes of Neonatal deaths) Frequency Percentage Cumulative Percentage Prematurity 49 32.2% 32.2% Birth Asphyxia 45 29.6% 61.8% Neonatal Sepsis 31 20.4% 82.2% Congenital Abnormalities 11 7.2% 89.5% Pneumonia 9 5.9% 95.4% Tetanus 4 2.6% 98.0% Malnutrition 1 0.7% 98.7% Diarrhea 1 0.7% 99.3% Birth injury 1 0.7% 100% Total 152 100%
  • 19.
    Pareto Chart onNeonatal deaths  Causes of neonatal deaths in the scenario facility 0 10 20 30 40 50 60 0 20 40 60 80 100 Cause of Neonatal Deaths in 2016 Frequencies Cumulative percentage Useful many Vital few
  • 20.
    Priority Matrix  Whichidentified problem should be prioritized?  Common criteria used to prioritize problems  Cost and/or gains when resolved  Availability of solutions  Availability of resources (staff, time, equipment, etc.)  Urgency of solving  Size of problem Adapted from National Association of Country & City Health Officials (NACCHO), First Things First
  • 21.
    Step-by-Step Instructions 1. Createa matrix 2. List the problems vertically and the criteria horizontally 3. Add one extra column on the right for priority score 4. Weight the criteria, according to level of importance 5. Rate the problems for the criteria according to predetermined rating scale 6. Calculate priority scores Adapted from National Association of Country & City Health Officials (NACCHO), First Things First
  • 22.
    Example of PrioritizationMatrix *Rating Scale used: 0-15 Priority Score
  • 23.
    Small Group Exercise Work in groups of 3-5 participants (per facility, department, organization)  Brainstorm with your group about prevailing health problems in your work place  List the problems and the criteria you use to rank them  Develop the prioritization matrix  Which health problem are you prioritizing and why?  Use your project workbook (Annexed)  Time: 20 minutes
  • 24.
  • 25.
    Components of ProblemStatement A clear and concise statement that describes the symptoms of a problem. Guided by the following questions: 1. What is the problem? What is not functioning as desired? What are the boundaries? (Size) 2. How do we know it is a problem? 3. How long has it be a problem (time)? 4. What are the effects (impact) of this problem? 5. Where does the problem exist? 6. How will we know the problem is resolved? Federal Democratic Republic of Ethiopia, Ministry of Health (2017), HSTQ, QI-TC Participants Manual
  • 26.
    What is doesNOT do…  Does NOT include the causes  Does NOT include the actions or corrections required  Does NOT assign blame  Does NOT address more than one problem
  • 27.
    Guiding Questions Example Ateam at a hospital X noted a shortage in medication for Acute Respiratory Infections (ARI) for under five children.  What is the problem? A shortage of ARI drugs for children under five  How do you know it is a problem? Drugs run out by the third week of the month  How frequently does it occur? This shortage has occurred every month for the past nine months  What are the effects of this problem? Patients develop complications causing an increase in referrals to a first-level facility  How will you know when it is resolved? The problem will be solved when ARI drugs last until the end of the month Federal Democratic Republic of Ethiopia, Ministry of Health (2017), HSTQ, QI-TC Participants Manual
  • 28.
    Examples Problem Statement ProblemStatement Strong? 1. There are many errors in our data 2. Over the past 2 years, only 50% of ANC clients was tested for HIV in hospital X, leading to high risk deliveries with potential risk for baby and health workers to be exposed 3. Maternal clients satisfaction is low 4. Since 3 months Hospital Z had a closed theatre and an increase in referrals, so far 150 clients were referred
  • 29.
  • 30.
    Purpose of AimStatement  1st Principle of Improvement – know why to improve  An Aim Statement is an explicit description with specific actions or focus  An internal and external communication tool for the work to be done
  • 31.
    Components of AimStatement Specific Measureable Ambitious (Achievable) Realistic Time bound
  • 32.
    Examples of AimStatements S M A R T To increase the percentage of syphilis tested pregnant mothers attending ANC from 0% to 80% by the end of January 2017. To improve PNC within 48 hours To increase number of 4th ANC from 50% to 85% at Y.P. Hospital by the end of June 2017. To increase skilled delivery from 68% to 85% by the end of May 2017. To increase the percentage of inpatient referral feedback given from
  • 33.
    Quality Improvement ProjectWork Section I – Problem identification, prioritization and aim statement  Develop a problem statement and a SMART aim statement for a problem identified in your facility/organization  If relevant use the prioritized problem from the priority matrix exercise  Document in your project workbook, subsequent sessions will build on this (Annexed)  Time: 20 minutes
  • 34.
    Summary  Problem identificationis the first step in QI  Prioritization tools can help focus which problem to start with  A good problem statement answers a series questions including the size, impact, location and frequency of the problem  A aim statement should be SMART

Editor's Notes

  • #2 In the discussion it should come up that the problem is too broad to be addressed and to be able to generate ideas that can address the problem Problem identification and analysis should be the first step Using various tools to analyze the problem and get to its root-cause Know where to prioritize
  • #5 Allow participants to reflect, take some views Explain: to solve a problem we have to understand the root-causes, know where to prioritize Without doing rigorous problem analysis we may get solutions that are not addressing the problem Problem analysis guides you to possible solutions (change ideas)
  • #6 Problems can be grouped in three broad categories Effectiveness: e.g. stock out, low cure rate, increase case fatality, high lost to follow up (HIV/AIDS,TB), incomplete medical records, canceled supervision visits Efficiency: e.g. long waiting time, lost lab results, over-prescription (antibiotics) Responsiveness: lack of timely response to emergency, stigmatization of patients, culturally insensitive care
  • #7 Refer back to module 1: STEEEP Care should be Effective, Efficient, all the time and for everyone, focusing on the patients and their needs Don’t harm me, heal me, be nice to me – and be safe
  • #8 Allow 10 minutes for brainstorming and 10 minutes for discussion Ask 3 groups to share their work
  • #10 Assume the data provided is a 1 month data in a facility you work with. Ask each group to share the problem they identified and provide feedback ANC register: late registration (1st visit 5-7 months) 3 out of 5 patients (60%) Delivery register: incomplete documentation (especially neonatal part) PNC register: data gaps (first PNC client 47 not documented), fail to follow up client 47, incomplete documentation, BCG not provided?
  • #11 Another way of using data to identify a problem. This is 1 year data on pregnant women registering for ANC in the first 3 months of their pregnancy in Hospital X Which month or which period can you identify a problem/gap
  • #12 Observation is another type of data that can be collected -review data documented in registers to identify performance gaps but also to target data quality improvement -observe clinical practices and identify which clinical skills needs to be strengthened (and on the job training) walk-through; health professional is a patient, give detailed inside on service provided, frustrations, feelings such as fear, pain, etc. and patient/family centered care (next slide) Ask what other types of observational methods can be used to gather data
  • #13 So we can use different types of data HMIS (broad, no details per patient but a good starting point) Registers (a lot of information summarized per client, reference to get more details from patient charts) Patient charts (time consuming but very detailed) Observation of clinical skills, data quality Walk-through Any other examples?
  • #14 Read the statement first More often than not, we don’t have resources available to address all our problems so we need to prioritize. And of course we want to have the greatest impact with minimal resources (time, cost, HR, equipment, etc.)
  • #15 Ask who has heard of Pareto
  • #17 Go through the steps and demonstrate with an example on flipchart can use causes of Maternal/Neonatal/Child mortality for example
  • #18 Use the exercise sheet provided, then demonstrate the various steps and ask participants before each step what the next thing would be to do.
  • #20 Another tool for prioritization of problems or solutions is a prioritization/focus matrix Ask what a matrix is Ask what possible criteria they could think of using child morbidity in Ethiopia as a problem to address (what are the morbidities)
  • #23 Group per facility/ region
  • #25 Clear statement about the problem and its symptoms (not implied causes, solutions are blame) Using the 6 questions can guide you to write a complete problem statement to serve as internal and external communication tool on the problem you are trying to address
  • #28 Are these good problem statements? Size (no), evidence (maybe), time/how long (no), impact/consequence (No), where/location (no), solution (no) Size (yes), evidence (yes), time/how long (yes), impact/consequence (yes), where/location (yes), solution (no) Size (no), evidence (maybe), time/how long (no), impact/consequence (No), where/location (no), solution (no) Size (yes), evidence (maybe), time/how long (yes), impact/consequence (yes), where/location (yes), solution (no)
  • #30 Refer back to the central principles of improvement (module 2) and the MFI (module 3)
  • #31 Specific: specify system and/or target group Measureable: goal that can be measured, over time -> data Ambitious: for the current state (Achievable or realistic in the new/re-designed system) Realistic for the new state Time bound: specify beginning and end
  • #32 Score the aims
  • #33 Use project book Share some of the aim statements and score with a matrix on flipchart as done in the previous slide