The document summarizes a study comparing the productivity of low-diversity (3 species) and high-diversity (12 species) mixed vegetable plots. Key findings include:
1) The high-diversity plots were slightly more productive per land area, yielding on average 3.5 kg/m2 vs 3.1 kg/m2 for the low-diversity plots.
2) When accounting for time spent, the low-diversity plots were more productive, yielding on average 3.4 kg/hour vs 2.3 kg/hour for the high-diversity plots.
3) Some crops like peas, spinach and radish grew better in the low-diversity plots, while others like rocket grew very well
Jenna Rose Kol Biology Honor's Project Poster Board Jenna Rose Kol
This is my Biology Honor's Poster for the Honor's Program. This experiment took an entire semester to examine. I conducted and came up with my very own experiment to test the growth rate effects of fertilizer on nitrogen fixated plants.
Grade 1 School Garden Lesson Plan - Seeds Lesson; What is a Seed ~ Massachusetts
|=> In this activity students will closely observe a variety of objects: seed and non-seeds. They will conduct experiments to test their assumptions as to which are seeds by soaking the objects and then planting them and then observing the results
`
For more information, Please see websites below:
`
Organic Edible Schoolyards & Gardening with Children
http://scribd.com/doc/239851214
`
Double your School Garden Food Production with Organic Tech
http://scribd.com/doc/239851079
`
Free School Gardening Art Posters
http://scribd.com/doc/239851159`
`
Companion Planting Increases School Garden Food Production by 250 Percent
http://scribd.com/doc/239851159
`
Healthy Foods Dramatically Improves Student Academic Success
http://scribd.com/doc/239851348
`
City Chickens for your Organic School Garden
http://scribd.com/doc/239850440
`
Simple Square Foot Gardening for Schools - Teacher Guide
http://scribd.com/doc/239851110
Diversity of fern/ pteridophytes - introduction , history , classification of pteridophytes, diversity of fern in India , about fern , Fern's diversity alpha diversity and beta diversity , explanation of fern through the reproduction example , different varieties of fern.
Grade 3 School Garden Lesson Plan - Seeds Lesson; Wild Beasts of the Soil ~ Massachusetts
|=> In this activity, students will bring some garden soil from the school garden and find out what macro-organisms live it it, and have the ability to observe them
`
For more information, Please see websites below:
`
Organic Edible Schoolyards & Gardening with Children
http://scribd.com/doc/239851214
`
Double your School Garden Food Production with Organic Tech
http://scribd.com/doc/239851079
`
Free School Gardening Art Posters
http://scribd.com/doc/239851159`
`
Companion Planting Increases School Garden Food Production by 250 Percent
http://scribd.com/doc/239851159
`
Healthy Foods Dramatically Improves Student Academic Success
http://scribd.com/doc/239851348
`
City Chickens for your Organic School Garden
http://scribd.com/doc/239850440
`
Simple Square Foot Gardening for Schools - Teacher Guide
http://scribd.com/doc/239851110
Master's Thesis Defense for Julie Edward's 11th grade Environmental Science class at San Lorenzo High.
Keywords: Conium maculatum, hemlock, curriculum, volunteerism, high school, HIPPO, biocultural diversity, control treatment, taxonomy, plant keys.
How to Split Bills in the Odoo 17 POS ModuleCeline George
Bills have a main role in point of sale procedure. It will help to track sales, handling payments and giving receipts to customers. Bill splitting also has an important role in POS. For example, If some friends come together for dinner and if they want to divide the bill then it is possible by POS bill splitting. This slide will show how to split bills in odoo 17 POS.
Ethnobotany and Ethnopharmacology:
Ethnobotany in herbal drug evaluation,
Impact of Ethnobotany in traditional medicine,
New development in herbals,
Bio-prospecting tools for drug discovery,
Role of Ethnopharmacology in drug evaluation,
Reverse Pharmacology.
How to Create Map Views in the Odoo 17 ERPCeline George
The map views are useful for providing a geographical representation of data. They allow users to visualize and analyze the data in a more intuitive manner.
Read| The latest issue of The Challenger is here! We are thrilled to announce that our school paper has qualified for the NATIONAL SCHOOLS PRESS CONFERENCE (NSPC) 2024. Thank you for your unwavering support and trust. Dive into the stories that made us stand out!
The Roman Empire A Historical Colossus.pdfkaushalkr1407
The Roman Empire, a vast and enduring power, stands as one of history's most remarkable civilizations, leaving an indelible imprint on the world. It emerged from the Roman Republic, transitioning into an imperial powerhouse under the leadership of Augustus Caesar in 27 BCE. This transformation marked the beginning of an era defined by unprecedented territorial expansion, architectural marvels, and profound cultural influence.
The empire's roots lie in the city of Rome, founded, according to legend, by Romulus in 753 BCE. Over centuries, Rome evolved from a small settlement to a formidable republic, characterized by a complex political system with elected officials and checks on power. However, internal strife, class conflicts, and military ambitions paved the way for the end of the Republic. Julius Caesar’s dictatorship and subsequent assassination in 44 BCE created a power vacuum, leading to a civil war. Octavian, later Augustus, emerged victorious, heralding the Roman Empire’s birth.
Under Augustus, the empire experienced the Pax Romana, a 200-year period of relative peace and stability. Augustus reformed the military, established efficient administrative systems, and initiated grand construction projects. The empire's borders expanded, encompassing territories from Britain to Egypt and from Spain to the Euphrates. Roman legions, renowned for their discipline and engineering prowess, secured and maintained these vast territories, building roads, fortifications, and cities that facilitated control and integration.
The Roman Empire’s society was hierarchical, with a rigid class system. At the top were the patricians, wealthy elites who held significant political power. Below them were the plebeians, free citizens with limited political influence, and the vast numbers of slaves who formed the backbone of the economy. The family unit was central, governed by the paterfamilias, the male head who held absolute authority.
Culturally, the Romans were eclectic, absorbing and adapting elements from the civilizations they encountered, particularly the Greeks. Roman art, literature, and philosophy reflected this synthesis, creating a rich cultural tapestry. Latin, the Roman language, became the lingua franca of the Western world, influencing numerous modern languages.
Roman architecture and engineering achievements were monumental. They perfected the arch, vault, and dome, constructing enduring structures like the Colosseum, Pantheon, and aqueducts. These engineering marvels not only showcased Roman ingenuity but also served practical purposes, from public entertainment to water supply.
2024.06.01 Introducing a competency framework for languag learning materials ...Sandy Millin
http://sandymillin.wordpress.com/iateflwebinar2024
Published classroom materials form the basis of syllabuses, drive teacher professional development, and have a potentially huge influence on learners, teachers and education systems. All teachers also create their own materials, whether a few sentences on a blackboard, a highly-structured fully-realised online course, or anything in between. Despite this, the knowledge and skills needed to create effective language learning materials are rarely part of teacher training, and are mostly learnt by trial and error.
Knowledge and skills frameworks, generally called competency frameworks, for ELT teachers, trainers and managers have existed for a few years now. However, until I created one for my MA dissertation, there wasn’t one drawing together what we need to know and do to be able to effectively produce language learning materials.
This webinar will introduce you to my framework, highlighting the key competencies I identified from my research. It will also show how anybody involved in language teaching (any language, not just English!), teacher training, managing schools or developing language learning materials can benefit from using the framework.
Welcome to TechSoup New Member Orientation and Q&A (May 2024).pdfTechSoup
In this webinar you will learn how your organization can access TechSoup's wide variety of product discount and donation programs. From hardware to software, we'll give you a tour of the tools available to help your nonprofit with productivity, collaboration, financial management, donor tracking, security, and more.
Instructions for Submissions thorugh G- Classroom.pptxJheel Barad
This presentation provides a briefing on how to upload submissions and documents in Google Classroom. It was prepared as part of an orientation for new Sainik School in-service teacher trainees. As a training officer, my goal is to ensure that you are comfortable and proficient with this essential tool for managing assignments and fostering student engagement.
Students, digital devices and success - Andreas Schleicher - 27 May 2024..pptxEduSkills OECD
Andreas Schleicher presents at the OECD webinar ‘Digital devices in schools: detrimental distraction or secret to success?’ on 27 May 2024. The presentation was based on findings from PISA 2022 results and the webinar helped launch the PISA in Focus ‘Managing screen time: How to protect and equip students against distraction’ https://www.oecd-ilibrary.org/education/managing-screen-time_7c225af4-en and the OECD Education Policy Perspective ‘Students, digital devices and success’ can be found here - https://oe.cd/il/5yV
This is a presentation by Dada Robert in a Your Skill Boost masterclass organised by the Excellence Foundation for South Sudan (EFSS) on Saturday, the 25th and Sunday, the 26th of May 2024.
He discussed the concept of quality improvement, emphasizing its applicability to various aspects of life, including personal, project, and program improvements. He defined quality as doing the right thing at the right time in the right way to achieve the best possible results and discussed the concept of the "gap" between what we know and what we do, and how this gap represents the areas we need to improve. He explained the scientific approach to quality improvement, which involves systematic performance analysis, testing and learning, and implementing change ideas. He also highlighted the importance of client focus and a team approach to quality improvement.
ESC Beyond Borders _From EU to You_ InfoPack general.pdf
Mixed Vegetable Polyculture Trials - University of Cumbria
1. Mixed
Vegetable www.permaculture.org.uk
Polyculture
Trials the results In association with
‘Mixed veg’ can mean so much more than a quick-fix
packet from the freezer.
For 50 people around the UK last year, it took on a
new meaning – a new way of growing vegetables all by Dr Naomi van
mixed up together. der Velden
Rationale - Learning Photo: C. Atkin
from nature?
Look around at the natural world to see
where plants choose to grow. You will
notice that they tend to grow in mixes of
different plants rather than large areas of
a just one species.
Often species grow together in relatively
consistent and discernible mixes. For
example, we might expect to find
bramble and bluebells in lowland oak
woodlands.
Plants naturally form communities. There
is some good scientific evidence that
communities of wild plants growing
together may be more productive than
any one of the component species
growing on its own would be 1.
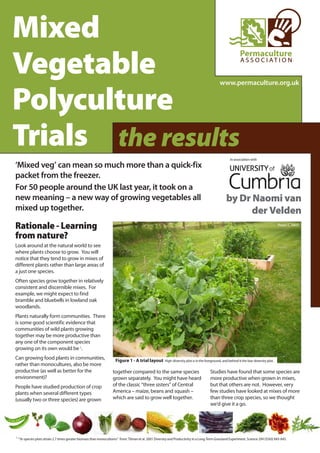
Can growing food plants in communities, Figure 1 - A trial layout High-diversity plot is in the foreground, and behind it the low-diversity plot.
rather than monocultures, also be more
productive (as well as better for the together compared to the same species Studies have found that some species are
environment)? grown separately. You might have heard more productive when grown in mixes,
People have studied production of crop of the classic “three sisters” of Central but that others are not. However, very
plants when several different types America – maize, beans and squash – few studies have looked at mixes of more
(usually two or three species) are grown which are said to grow well together. than three crop species, so we thought
we’d give it a go.
1
“16-species plots attain 2.7 times greater biomass than monocultures” from: Tilman et al. 2001 Diversity and Productivity in a Long-Term Grassland Experiment. Science 294 (5543) 843-845.
2. Mixed vegetable polycultures
We conducted our own study to
compare low- and high-diversity mixes
to find out:
Are more diverse (12 species) vegetable
mixes more productive than less-diverse
(three species) mixes?
How easy do gardeners find these systems
to use?
The vegetables used are as listed below
and in Figure 1. We chose common
vegetables from a range of plant families
and which would complement the
spaces available (e.g. some roots, some
climbers, some low, some high) above
and below ground.
How did we
investigate this?
Fifty sets of seeds were kindly provided
by four lovely seed companies and sent
to households around the country. Figure 2 - Plant roots and shoots occupy different areas
Onion, lettuce, sweet corn, peas, radish, & runner beans.
Everyone made two plots – one smaller (Roots drawn after Weaver & Bruner, 1927 “Root development of vegetable crops”)
one for three species - Low diversity -
and one larger one for the more diverse Some plant ecology: For example, different plants have
different rooting zones so could be
mix - High diversity (see Figure 1). Plant niches, competition and combined to maximise use of the soil
Larger plants (beans, sweet corn, kale) co-operation. area, rather than competing in a single
were first grown in pots then planted layer (see above).
The growing of plants in mixtures
out. Others (onions, peas) were sown in These plants might be described as
is effectively a balance between
clusters, and the remainder were mixed occupying different niches.
competition for resources, and
together with some soil and scattered
“co-operation” to use all available They can also benefit each other,
across the plot.
resources as efficiently as possible. for example by fixing nitrogen or
Participants were asked to record providing food for pest predators or
information about when they visited for pollinators.
their plots, how long they spent there,
and also to weigh each species each time
it was harvested. We measured productivity of the edible
plant parts (the bits you’d buy) by
What have we found
Twenty four participants were able to looking at: out?
complete the study and return their data.
Weight harvested per area (square-metres) Which plot-type was most productive?
Weight harvested per minute of time spent In terms of the total amount produced
on the plot per land area, the high diversity plot was
What’s in the plots? slightly more productive (see top graph
Length of time plots were productive for in Figure 3).
(longevity of production)
Low diversity: On average, 3.1 kg were produced from
Peas, radish and perpetual spinach Participants were also asked to fill in a square metre (m2) in the low diversity
(beet). questionnaires before and after so we plot and 3.5 kg in the high diversity
could find out what they thought of plot. These slight differences are not
growing in this way. significant2 because there is a lot of
High diversity:
Thirty-one people returned the initial variation in how much was harvested by
As above, plus onions, lettuce,
questionnaire and twenty-one the final different people (see maps in Figure 4).
beetroot, sweet corn, coriander,
runner beans, kale, marigolds and questionnaire of whom nineteen had When considered by the amount of time
rocket. also returned data. people put into the plots, then the low
diversity plot was more productive for
the effort (see lower graph in Fig. 3).
2
Wilcoxon signed rank test for 24 samples, z = 1.154, p = 0.130 . The difference between means is considered statistically significant if the value of p is less than 0.05, so in this case, this is not
significant. The error bars in the graphs also overlap each other quite a lot which is always a clue that the difference in the average isn’t too important.
3. The results
On average, 3.4 kg were harvested from
a square-metre of the low diversity plots Yield per square metre The vertical black lines (“error bars”)
for every hour of effort put in, and the show standard error and indicate the
high diversity plots yielded 2.3 kg. amount of variability in the data.
productivity (kg m-2)
Although this difference is quite large, Small lines mean that most people
it is not quite statistically significant3. It harvested close to the average
should be noted that people tended to amount, larger lines mean that some
record time to the nearest five minutes, people got lots and some people
so the amount of time spent on the low diversity high diversity
got a little.
low-diversity plot might have been over-
estimated.
Yield per hour
Overall, there’s little difference in productivity (kg per hour)
productivity between the two types of
plot when we account for area and time.
This could be because of the crops
chosen or other factors that mean there
is a lot of variation in the data.
You can see in the maps in Figure 4 that low diversity high diversity
some quite high levels of production Figure 3 - Productivity of low and high
were reached – up to 10.6 kg of food diversity mixes when considered per area
(top graph, kilograms produced from one square metre) and
from one square metre of ground! in terms of how much effort was put into growing (lower
graph, kilograms produced per hour of effort from one square
There are lots of reasons why this might metre of land). One kilogram (kg) is 2.2 lbs.
be – better soils, better weather, more
time, more experience. Productivity of each plot.
The amount of time put into plots was
significantly related to the amount of
yield people got in the high diversity plot4
and a little so in the low diversity plot 5.
People who got a good yield on the high
diversity plot also tended to get a good
yield on the low diversity plot6, perhaps
because their site was better or because
they are more experienced gardeners.
It is interesting to see from the maps in
Figure 4 that areas typically considered
more marginal, like Scotland, Wales, and
the far north of England, generally had
some quite high production.
Perhaps success with different types of
the crops used might also be important?
To give some context, 3.5 kg
per metre-square works out
at 35 tonnes per hectare! UK
wheat yields are about 7-8
tonnes per hectare and that’s Figure 4 - Yellow shows lower production and
on the best growing land! red shows higher production in grams, harvested from 0 - 0.75 kg
one square-metre, the values are:
0.76 - 1.5
Mind you, it’d take quite a lot
1.6 - 3.0
of time to harvest a hectare
3.1 - 5.0
(that’s an area 100 by 100
5.1 - 10.6
metres) using this method!
3
Wilcoxon Z statistic = 1.680, p = 0.093, 20 people returned data on time spent on the plots. 4 Spearman’s Rank correlation test: Rho = 0.446, p = 0.046 The relationship is considered statistically
significant if the value of p is less than 0.05. Rho is a value between +1.000 and -1.000. If it is +1, then there is a perfect straight line fit between increasing time and increasing yield. If it was -1,
then increasing time would always lead to a reduced yield. 5 Rho = 0.430, p = 0.052. 6 Rho = 0.845, p < 0.001 (Here you can see Rho is closer to +1.000 meaning that there is a stronger relationship
between yield from high diversity plots and low diversity plots, than there is between experience and yield. This is also reflected by the p value being much less than 0.05)
4. Mixed vegetable polycultures
Which crop types did things that could cope with some shade Longevity of crop
(e.g. spinach beet, lettuce, peas, radish,
best? plot also tended to get a good yield on the coriander, rocket, beetroot), it their site
diversity low diversity plot , perhaps because
seems
6 production
In the low-diversity plot – Peasgreen fingers. It is that there wasfrom the maps in Figure 4in the
was better or because they have and interesting to see a lot of competition that As well as looking at the total amounts
spinach were successful for most people High-diversity plot.
areas typically considered more marginal, like Scotland, Wales, and the far north of England, produced, it’s also important to look at
generally had some quite high production. Perhaps success with different types of the crops used
(see left also be side of Figure 5) and gave
might hand important? The density of crops is very important when crops are being harvested.
high yields (Figure 6). Radish grew for in determining yield – too far apart and In theory, having a greater diversity
most people and produced reasonably
Which crop types did best? crops are isolated and susceptible to the of different crops might mean more
well (given it’s small!) – Peas and spinach were successful for most people (see left hand side of
In the low-diversity plot elements. continuous food production, and fewer
Figure 5) and gave high yields (Figure 6). Radish grew for most people and produced reasonably
In the high-diversity plot - Well, rocket
well (given it’s small!) Grow lots of one crop close together and “gluts” where we’re overwhelmed with a
grew. Vigorously. This was meant to be the individual plants can’t obtain all the particular crop.
a cover crop that weplot - Well, rocketate Vigorously. This wasneed. to be a cover crop that
In the high-diversity pulled up and grew.
resources they meant
we pulled up and ate early on to give room for other things…but it’s so tempting to just cut a bit off From our data, the High-diversity plot
early on toharvesting it. for other things… also harvested well for most people.
and keep give room Kale, onions, and beans It is possible that our High-diversity has higher yields earlier in the season
but it’s so tempting to just cut a bit off
crop mix was too dense to perform at giving a greater spread of when food is
and keep harvestingcoriander, and lettuce really didn’t grow for many people (Figure 5) and even
Sweet corn, beetroot, it.
those who got a harvest didn’t get very much (see the right hand we look at when people were
its best. If side of Figure 6). available (see Figure 7).
Kale, onions, and beans also harvested harvesting crops, we also see some
For the three species grown in both plots, spinach7 and peas8 and radish9 all grew much better in the Looking at individual species, we can
well for most people. interesting results that support this.
Low-diversity plots than the High-diversity plots (see Figure 6). also see some important differences.
Figure 8 shows that peas were harvested
for longer from the Low-diversity plot,
and spinach was ready much earlier.
The radish was generally ready around
the same time in both.
Spinach, lettuce, and beetroot in the
High-diversity plot all started to increase
towards the end of our growing season
(last harvest on 31st October), suggesting
that these all started to do well after
some of the other crops (rocket, beans,
onion) were harvested (Figure 9).
Figure 5 Number of people who harvested each crop (max 24). Organised by most successful
Figure 5 - Number of people who harvested each crop (max 24).
crops in Low- then High-diversity plots.
Organised by most successful crops in Low- then High-diversity plots.
Sweet corn, beetroot, coriander, and
lettuce really didn’t grow for many
people=(Figure<5) and even can see Rho is closer to +1.000 meaning that there is a stronger relationship between
6
Rho 0.845, p 0.001 (Here you those who
got athefrom high didn’t get and lowmuch plots, than there is between experience and yield. This is also reflected
yield
by
harvestbeing much less very diversity
p value
diversity plots
than 0.05)
(seeSpinach. Difference is highly statistically significant. Wilcoxon signed-rank statistic 3.574, p < 0.0005. So there is a
7
the right hand side of Figure 6).
huge difference in the average amount of spinach people are getting from each plot and we can see that much more
Forperson’s Low- and High-diversity plot, and so eliminates some of a paired test whichmight occur from people growing in
comes three species grown in Wilcoxon signed-rank is
the from the Low diversity plot. The both the variations that
compares production from each
plots, spinach7 ways. peas8 and radish9 all
slightly different and
8
grew much better in the statistic 3.782, < 0.0005. Differencethe highly statistically significant. 0.05.
9
Peas. Wilcoxon signed-rank statistic 4.171, p
Radish. Wilcoxon signed-rank
Low-diversity p < 0.0005. Again,
is
p-value is much, much less than
plots than the High-diversity plots (see
Figure 6).
Overall, more diverse plots seem to
yield a little more for the land area than
less diverse plots, although diversity of
vegetables harvested might be at the
expense of yields of individual species. Figure 66Average productivity of theof the plantstwo the two plots Measured in
Figure - Average productivity plants on the on plots Measured in kilograms per metre-
squared, organised by most productiveproductive crops Low-Low- then High-diversity plots
kilograms per metre-squared, organised by most crops in the in the then High-diversity plots
We can see that some crops grew well The vertical black lines show standard error and indicate the amount of variability in the data. Small lines mean
but others, like sweetcorn, consistently that most people harvested close to the average amount (e.g. spinach in the High-diversity plot), larger lines
The vertical black lines show standard (e.g. spinach in the High-diversity plot),
mean that some people got lots and some people got a little (e.g. spinach in the Low-diversity plot).
failed to produce. It is interesting to see error and indicate the amount of larger lines mean that some people got
that the most productive crop, spinach, variability in the data. seem to yield a little morelotsthe land area than less diverse little (e.g.
Overall, more diverse plots for and some people got a plots,
did well only on the Low-diversity plot. although diversity of vegetables harvested might be at the expense the Low-diversity plot).
spinach in of yields of individual species.
Small lines mean that most well but others, like sweetcorn, consistently failed to produce. It is
We can see that some crops grew people
Most crops need a certain amount of harvested close to the average amount
interesting to see that the most productive crop, spinach, did well only on the Low-diversity plot.
sunshine, and although we tried to pick Most crops need a certain amount of sunshine, and although we tried to pick things that could cope
with some shade (e.g. spinach beet, lettuce, peas, radish, coriander, rocket, beetroot), it seems that
7
Spinach. Difference is highly statistically significant. Wilcoxon signed-rank statistic lot ofp < 0.0005. So there is a huge difference in the average amount of spinach people are getting from each
there was a 3.574, competition in the High-diversity plot.
plot and we can see that much more comes from the Low diversity plot. The Wilcoxon signed-rank is a paired test which compares production from each person’s Low- and High-diversity plot,
and so eliminates some of the variations that might occur from peopleThe density of crops is very important in determining statistic 4.171, far 0.0005.and crops is highly statistically
growing in slightly different ways. 8 Peas. Wilcoxon signed-rank yield – too p < apart Difference are isolated and
significant. 9 Radish. Wilcoxon signed-rank statistic 3.782, p < 0.0005. susceptible to themuch, much less thanlots of one crop close together and the individual plants can’t
Again, the p-value is elements. Grow 0.05.
obtain all the resources they need. It is possible that our High-diversity crop mix was too dense to
perform at its best. If we look at when people were harvesting crops, we also see some interesting
5. in amount of sunshine, and although we tried to pick things that could cope
pinach beet, lettuce, peas, radish, coriander, rocket, beetroot), it seems that
Looking at individual at individual species,also see some important differences. Figure 8 shows that peas
Looking species, we can we can also see some important differences. Figure 8 shows that peas
The results
etition in the High-diversity plot. were harvested for longer from the Low-diversity plot, and spinach was ready much earlier. The
were harvestedradish was generally readyLow-diversitytime in and spinach lettuce, and beetroot in the High-The
for longer from the around the same plot, both. Spinach, was ready much earlier.
radish was generally ready aroundto increase towards the both. our growing lettuce, and beetrootst in the High-
very important in determining yield – too far apart and crops are isolated and diversity plot all started the same time in end of Spinach, season (last harvest on 31
ents. Grow lots of one crop close together and the individual plants can’t
diversity plot all started to increasethese all started to do well after some of the other crops (rocket, beans, 31st
they need. It is possible that our High-diversity crop mix was too dense to
October), suggesting that towards the end of our growing season (last harvest on
October), suggestingwere harvested (Figure 9). to do well after some of the other crops (rocket, beans,
we look at when people were harvesting crops, we also see some interesting
onion)
that these all started
onion) were harvested (Figure 9).
duction
e total
also
en crops
theory,
ty of
ean
gluts”
med with
h-
r yields
ing a
Figure 7 Continuity of production. Amount harvested each month.
Figure 7 - Continuity of production
Solid line shows High-diversity plot, dashed line the Low-diversity.
Amount harvested each month. Solid line shows
High-diversity plot, dashed line the Low-diversity.
What about the quality of the food produced?
Overall, the High-diversity plot had a What about the quality of the food produced?
Most of what was harvested was of high quality for
more sustained availability of crops, Most of what was harvested was of highwith relatively little damage. Peas did
garden produce quality for
Figure 8 Timing of harvests for crops in both plots. Solid
with different crops peaking at different garden producethe cropswell, spinachdamage. Peas did and radish fared rather
Figure 8 - Timing of harvests for Low-
line shows High-diversity plot, dashed line with relatively little reasonably well,
times. well, spinach reasonably well, and radish fared rather
in both plots Solid line shows High-diversity one
diversity. Amount harvested each month in grams from less well. (Figure 10). The low-diversity plot tended to
square-metre. line the Low-diversity. (Figure 10). The low-diversity plot tended to
plot, dashed less well. have slightly better quality food, but the overall
It’s also likely that several crops only Amount harvested each month in grams from one quality food, but the overall
have slightly better differences between the plots are not significant10.
square-metre.
really started to grow after other crops differences a more sustainedplots are not significant10.
Overall, the High-diversity plot hadbetween theIdeally, we would like to compare these results to those
availability of crops, with different would likeat compare these results to those
Ideally, we crops peaking to
(like rocket) were removed. from own-grown crops under “normal” growing
different times. It’s also likely that several crops only
Figure 8 Timing of really startedforgrow after own-grown crops methods.
harvests to crops in both plots. rocket) were “normal” growing
from other crops (like Solid under
It is important to understand howshows High-diversity plot,important to understand how these
line these removed. It is dashed line the Low-
methods.
systems can work to provide adiversity. Amount harvested eachto providein sustainedfromof food.
sustained systems can work month a grams yield one
Looking at damage to the crops shown in Figure 11,
Perhaps this is a good way of getting lots of food but
yield of food. square-metre. avoiding gluts. However if youat damage to the crops shown the Low diversity plot suffered less
Looking really want lots of people felt that in Figure 11,
spinach, then giving plenty felt that the Low diversity plot suffered less
people food to grow will be
What about the qualityitof theof space produced?
Perhaps this is a good way of getting important.
damage than the High-diversity plot and the usual way
Most of what was harvested was of high High-diversity plot9and thefood. The High-diversity plot
damage than the quality for Figure Timing ofusual way other crops
in which they grew harvests for
lots of food but avoiding gluts. However the High-diversity relatively more angrew food. Thein the High-diversityplot Amount harvested
Overall,
garden produce with plot had a little damage.for perhaps suffered a little more pest and disease damage.
It should also be noted whichgave sustained Peas didHigh-diversity plot.
in that we they end date our
if you really want lots of spinach, then well, spinach reasonably well, andpeakingfared rather pestmonth diseasefrom one square-metre.
availability of crops, with different crops harvest everything
perhaps suffered a at more each and in grams damage.
experiment and asked everyone to
radish little
giving it plenty of space to grow will be times.that was remainingThe low-diversitySome crops
different It’s also likely thatend of October. only
at the several
less well. would have10). growing for longer.crops plot tended to
(Figure kept
really started to grow after other crops (like rocket) were
important. have slightly better quality food, but the overall
removed. It is important to understand how these
differences between the plots are not significant10.
It should also be noted that we gave an can work to provide a sustained yield of food.
systems
Perhaps this is a good like to compare of food but to those
Ideally, we would
end date for our experiment and askedfrom own-grownway of getting“normal” growing lots these results
crops under
avoiding gluts. However if you really want lots of
everyone to harvest everything that was then giving it plenty of space to grow will be
methods.
spinach,
remaining at the end of October. important.
Looking at damage to the crops shown in Figure 11, Figure 9 Timing of harvests for other crops
Figure 9 - Timing of harvests for other
Some crops would have kept growing for
It should also be that the Low diversity plot suffered less in crops in the High-diversity plot harvested
people felt noted that we gave an end date for our the High-diversity plot. Amount
longer. Amount harvested each month in grams from one
damage than the High-diversity plot and the usual way month in grams from one square-metre.
experiment and asked everyone to harvest everything each square-metre.
that was remaining at the end of October. Some cropsplot
in which they grew food. The High-diversity
would have kept growing for longer. pest and disease damage.
perhaps suffered a little more
What about the
quality of the food
produced?
Most of what was harvested was of
high quality for garden produce with Figure 10 Quality of c
relatively little damage. Amount of damage in
a, none – will eat all; b
Looking at damage to the crops shown c, moderate – will eat h
in Figure 10, people felt that the Low eat little; e, devastated
diversity plot suffered less damage than
the High-diversity plot and the usual way
in which they grew food.
The High-diversity plot perhaps suffered Figure 11 Perceived damage on Low-diversity,
Figure 11 Perceived damage on Low-diversity,
Figure 10 - Perceived damage on Low-diversity, High-diversity and growing methods.
High-diversity and “Normal”
a little more pest and disease damage. “Normal” growing methods Note that Normal methodsgrowing methods.
High-diversity and “Normal” are the usual growing methods
of participants and differed between people. Answers based on questionnaire responses for pests – 24 usual growing
Note that Normal methods are theNormal methods are the
Note that usual growing
The low-diversity plot tended to have responses, for disease - 15 responses. methods of participantsQuality of crops harvested.
Figure 10 and differed between people.
methods of participants and differed between people.
slightly better quality food, but the Answers based on questionnaire responsesquestionnaire responses for pests –
Answers based on forof damage in categories:
Amount pests –
overall differences between the plots are 24 responses, for disease - eat responses. – will eat most;
a, none – will 15 all; b, mild
24 responses, for disease - 15 responses.
not significant10. c, moderate – will eat half; d, severe – will
10
10
Chi-squared tests little; e, devastated – will eat none. 4.60 p>0
2
eat for; Peas Χ2 = 3.89 p>0.05; Spinach2 Χ2 =
2
Chi-squared tests for; Peas Χ = 3.89 p>0.05; Spinach Χ = 4.60 p>0.05; Radish Χ = 3.09 p>0.05
10
Chi-squared tests for; Peas Χ2 = 3.89 p>0.05; Spinach Χ2 = 4.60 p>0.05; Radish Χ2 = 3.09 p>0.05. No significant differences between Low- between Low- and High-diversity plots.
differences and High-diversity plots.
differences between Low- and High-diversity plots.
6. ed in and completed the initial survey did have some experience of growing
inner out of 31people), so we don’t really know what it would be like for
Mixed vegetable polycultures
It did seem that people with more experience of vegetable growing got a little
gh diversity plot, but it didn’t make a difference for the low diversity one11, but
istically significant, so if you grow veg you could give this method a go and
Peas did well, spinach reasonably well,
and radish fared rather less well (see
How easy was it to How much effort is it?
figure 11). grow? Was the yield worth the effort?
t?
Ideally, we would like to compare these Most people who joined in and Overwhelmingly, people thought it was
he effort? completed the initial survey did have worth having a go, especially with the
results to those from own-grown crops
ple thought it“normal” growing methods.
under was some experience of growing veg before smaller Low-diversity plot (see pie charts
pecially with the (just one beginner out of 31 people), so in Figure 12).
y plot (see pie charts we don’t really know what it would be
Overall, people enjoyed trying out this
like for complete beginners.
method of growing and were keen to
It did seem that people with more give it a go (Figure 13).
yed trying out this experience of vegetable growing got a
But – be careful!
nd were keen to little bit more out of the high diversity
3). plot, but it didn’t make a difference for Although the results look good, they are
the low diversity one11, but neither of by no means the final answer. There are
Figure 12 Was yield worth the effort?
these is statistically significant, so if you some important things to consider:
Reponses from finalgrow veg you could give this method a
questionnaire (21 responses) We’re really happy that 24 people
ook good, they are go and get good results! completed the trial. However, it’s still
answer. There are some important only a relatively small number of plots.
appy that 24 people completed the Any one grower can have a large
influence on the overall results.
r, it’s still only a relatively small
ts. Any one grower can have a large We’d like to repeat it again with
he overall results. We’d like to hundreds of people joining in to get a
real feel for what is happening!
with hundreds of people joining in
el for what is happening! It was a strange year for weather and
asy wasweather grow? people
e year for it to and many many people agreed it was a difficult
growing season.
a difficult growing season. Perhaps
ople who joined in and completed the initial survey did have some experience of growing yield
r would yield different results Perhaps a different year would
ore (just 1 beginner vegetable
binations and types of out of 31people), so we don’t really know what itdifferent resultslike for
would be
e beginners. It did seem that people with more experience of vegetable growing got aand types
give very different results – there’s Different combinations little
hout of the high diversity plot, but it didn’t make a difference for the low diversity one11give very
isn’t known about polycultures! of vegetable species might , but
Figure 12 - Would you plant a mixed different results – there’s still a lot which
13 grow you
of these is statistically significant, FigureyouWould again?you could give isn’t known abouta go and
so if vegetable bed veg plant a mixed this method polycultures!
d results! vegetable bed again?
ctive method of growing; on average 3.5 kg of food were produced from one
me people achieved over 10kg. Gardens and allotments have the potential to
uch effort is it?
tyield worth a small amount of space. They also generally avoid many of the
of food from the effort?
wildlife and the environment that might be associated with other methods of
elmingly, people thought it was
wever, this is a much more labour-intensive method of production which people
aving growing as much aswith the product, tasty though that may be!
ent in a go, especially for the final
Low-diversity plot (see pie charts
e 12).
Figure 10 Quality of crops harvested.
ation on experience11 - Quality of crops harvested
Figure and production per metre-square: High diversity plot Rho is 0.420, p =
Amount of damage in categories:
, people a:enjoyed all; b, will eatoutwill eat most; would be +1.000 if all the data
a, increasing – willeat trying most; this and -1.000 if increasing experience but
05); Low diversityofplot Rho is 0.311, p = 0.159 . Rho
Amount damage in categories:
ine of none – will eat all; b: mild – mild – yield,
none
experience and increasing
means experience and were bit, d, severe – will experience can still get high yields.
of c, moderate counts eathalf; d: severe –but eatto with less
growing – –will aeat half; will people
e: devastated – will little keen
c: moderate will eat little;
none
goeat little; e,13).
(Figure devastated – will eat none.
Figure- 12 yield worth the effort? the effort?
Figure 13 Was Was yield worth
e careful! Reponses from final questionnaire (21 responses)
Reponses from final questionnaire (21 responses)
h the results look good, they are
eans the final answer. There are some important
o consider:
We’re really happy that 24 people completed the plot Rho is 0.420, p = 0.051 (almost less than 0.05); Low diversity plot Rho is 0.311, p = 0.159 . Rho
11
Spearman’s rank correlation on experience and production per metre-square: High diversity
rial. However,if all the data formedonlystill get high yields. smalland increasing yield, and -1.000 if increasing experience but decreasing yield. So this means experience counts
would be +1.000
it’s still a perfect straight line of increasing experience
a little bit, but people with less experience can
a relatively
number of plots. Any one grower can have a large
nfluence on the overall results. We’d like to
7. The results
In summary,
This is a highly productive method of
growing. On average 3.5 kg of food were
produced from one square-metre and
some people achieved over 10kg.
Gardens and allotments have the
potential to give us a large amount of
food from a small amount of space.
They also generally avoid many of the
negative impacts on wildlife and the
environment that might be associated
with other methods of food production.
However, this is a much more labour-
intensive method of production which
people tend to do for enjoyment in
growing as much as for the final product, High-diversity plot in June
tasty though that may be!
Comparing the plots, the High-diversity from competition for space and nutrients Some of the seed onions have also
crop was slightly more productive, and and less able to cope with additional started to grow well this year.
gave a longer period for harvesting food; pressures.
Perhaps we need to consider these
however, the crops grown in the Low- Getting a balance between different food systems in terms of year-long
diversity plot were individually more plants can be important for many production, or continuous production?
productive, perhaps because they had reasons.
Maddy Harland’s article on the
less competition with other species.
People enjoyed having a go at this, and Permaculture Magazine website
There is a balance between growing a most were inspired to do it again. (22nd May 2012), talks about choosing
variety of different food and growing a perennial varieties or annuals which
Generally, they found the Low-diversity
large amount of any one crop. self-seed, to create a naturalistic self-
plot easier to manage, perhaps because
It is also likely that the more time you put sustaining polyculture.
it was smaller, perhaps because the mix
into your garden the more it will reward of species was less confusing, or perhaps There are many ideas here which you
you with food. because it wasn’t overwhelmed with might like to explore further. This
Having a mix of some species may also rocket early on! summer, several of us are working on
reduce damage from pests and diseases, different species mixes so that we are
It’s June now, and I am still harvesting
but it is not clear how much diversity is prepared for our future trials.
spinach from both plots, even though I
needed. cut them right back in October. If you have suggestions of crop mixes
Our results suggest that the High- that have worked for you, we would love
I’m sure the kale would have kept going
diversity plot suffered most damage. It to hear from you!
through the winter too but I honestly
may be that plants were more stressed couldn’t face any more so pulled it up!
The polyculture research team Acknowledgements
Dr Naomi van der Velden - Plant ecologist at the Massive thanks to Celia Ashman for all her help in co-
University of Cumbria ordinating the trials and all the data collection, and Edgars
Andy Goldring, Tomas Remiarz, Roz Brown, Dr Ian Fitzpatrick - our Latvian hard-working student placement.
- the Permaculture Association mixed veg team Big shout out to Garden Organic, Edwin Tucker & Son Ltd.,
Please note that we have a research co-ordinator in place - Beans and Herbs, and Chase Organics for supplying the
Chris Warburton-Brown. seeds for this trial.
Send any enquiries to research@permaculture.org.uk Thanks to Chris Evans for advice on appropriate plant mixes.
To everyone who participated, and especially those who
completed the trials, many, many thanks – we couldn’t have
done it without you!