Downloaded 148 times

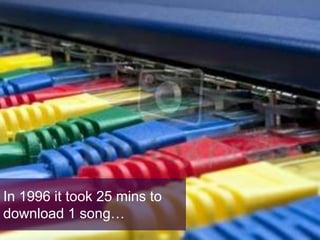

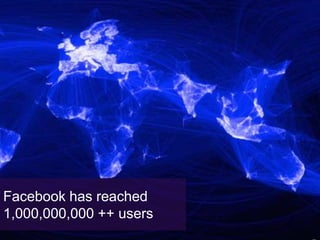


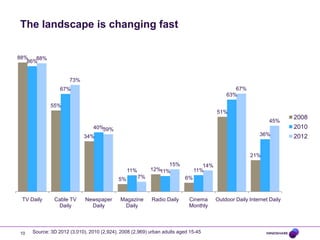
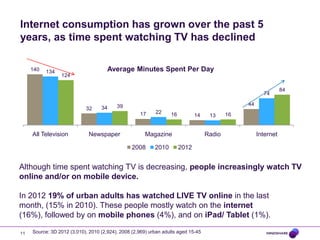
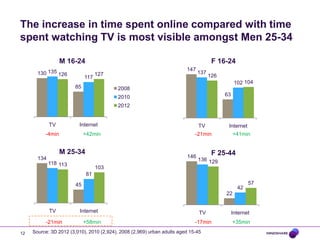
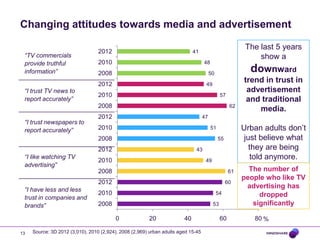
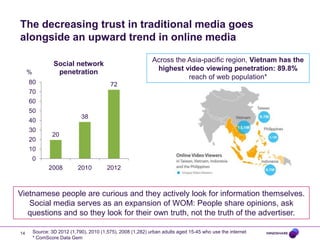
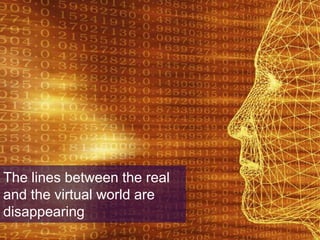


Digital 2013 Mindshare The document discusses changes in digital media consumption over time. It notes that downloading a song used to take 25 minutes but now takes only 25 seconds on a mobile phone. It also discusses the growth of Facebook users to over 1 billion and changes in media consumption habits, with time spent online increasing as time spent watching TV declines. Trust in traditional media sources like television news and newspapers is decreasing as well. Internet and social media penetration in Vietnam is high, especially among younger demographics. The lines between real and virtual worlds are blurring as digital media becomes integrated into daily life.