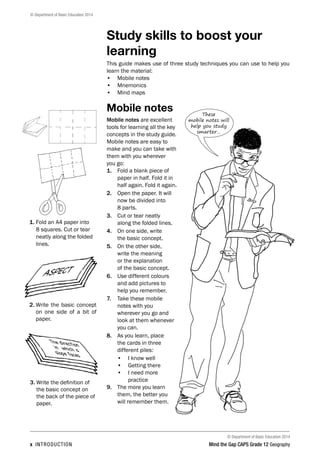
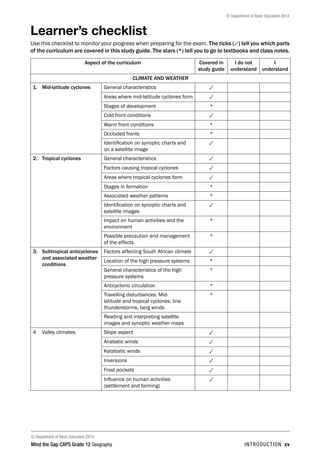
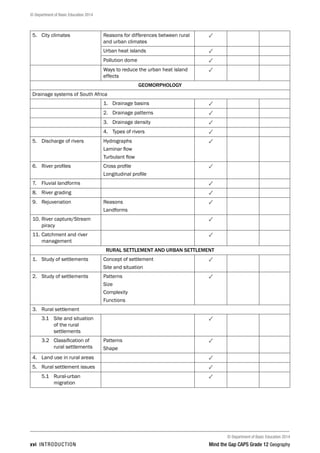
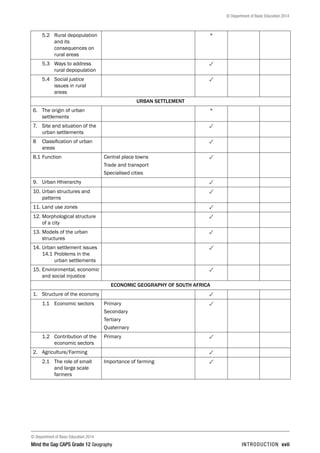
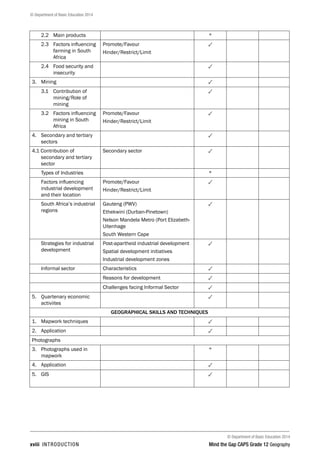
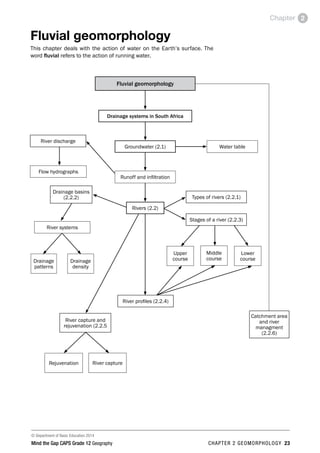
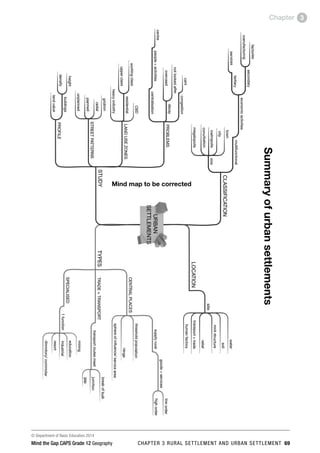
This document is the study guide for Grade 12 Geography according to the Curriculum and Assessment Policy Statement (CAPS). It provides explanations, examples and activities to help learners prepare for the Grade 12 national exams. The study guide covers key topics in the Geography curriculum, including climate and weather, geomorphology, settlements, the South African economy, and mapwork skills. It aims to fill gaps in learners' understanding and guide them to achieving a high-quality pass. Various study tips and exam guidelines are also provided to support effective exam preparation.


![© Department of Basic Education 2014
© Department of Basic Education 2014
xiv INTRODUCTION Mind the Gap CAPS Grade 12 Geography
Question words to help you
answer questions
It is important to look for the question words (the words that tell you what
to do) to correctly understand what the examiner is asking. Use the words
in the following table as a guide when answering questions.
Question word What is required of you
Account for Explain the cause of; explain why; give reasons for
Analyse Separate; examine and interpret critically; positives and negatives; pros and cons
Annotate To add explanatory notes to a sketch, map or drawing
Argue Put forward reasons in support of or against a statement
Classify Place things with similar characteristics in the same group; to arrange according to type or sort
Comment Give your opinion, based on facts
Compare To list both similarities and differences
Contrast Stress the differences between things, events or problems
Define Give a concise and clear meaning
Demonstrate Show or make clear; illustrate or explain; prove by reasoning and evidence (note that you can
give examples)
Describe List the main characteristics of something; give an account of (note that a diagram or map
may be part of a description)
Discuss Give the reasons for your statement; present both sides and reach a conclusion
Evaluate Express an opinion, using evidence, of how good/bad, negative/positive, successful/
unsuccessful something is
Explain Make clear, interpret, and spell out the material you present. Give reasons for differences of
opinion or of results
Give To state facts without discussions or explanations (note that you may be asked to ‘Give a
reason’)
Identify Name a feature from the source material
Interpret To give an explanation of; to give the meaning of
In every exam
question, put a CIRCLE
around the question word and
underline any other important
key words. These words tell
you exactly what is
being asked.
PAY SPECIAL ATTENTION
ACTIVITIES boy
and girl-left and
right of page
EG - worked examples
HINT!
e.g.
NB NB
hint
activity
activity
exams
Examples of question words
1. Draw a longitudinal profile of a river (from source to mouth)
and show the upper, middle and lower course. (4 × 1 = 4)
2. List two features of the upper course of a river. (2 × 2 = 4)
3. Describe a river in its lower course. (2 × 2 = 4)
4. Describe one difference between the river channel in the
upper course and the lower course. (2 × 2 = 4)
[16]](https://image.slidesharecdn.com/mindtheseriesstudyguidegeographygrade12-230512090758-7aa84044/85/MIND-THE-SERIES-STUDY-GUIDE-GEOGRAPHY-GRADE-12-pdf-16-320.jpg)
![© Department of Basic Education 2014
Mind the Gap CAPS Grade 12 Geography CHAPTER 1 CLIMATE AND WEATHER 15
Chapter 1
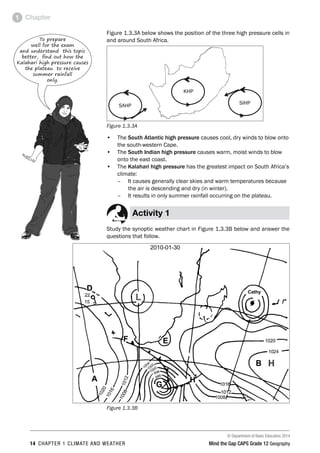
1. Name the high pressure cells labelled A and B. (2 × 2 = 4)
2. Give TWO pieces of evidence from the map that this is
a summer map. (2 × 2 = 4)
3. Identify the low pressure cell labelled E. (1 × 2 = 2)
4. The letter G indicates a mid-latitude cyclone.
a) Name the fronts labelled F and H. (2 × 2 = 4)
b) In which direction does this cyclone generally move? (1 × 2 = 2)
c) Describe how front F will affect the weather of
Cape Town. (3 × 2 = 6)
5. Refer to the cyclone named Cathy.
a) What type of cyclone is Cathy? (1 × 2 = 2)
b) State how many cyclones have occurred for this
season, including Cathy. (1 × 2 = 2)
c) In which direction does this cyclone move? (1 × 2 = 2)
d) List TWO conditions necessary for this cyclone to form. (2 × 2 = 4)
6. Refer to the weather station labelled D and describe the
weather in terms of: cloud cover, wind speed, wind
direction, air temperature, dewpoint temperature. (4 × 2 = 8)
[40]
Answers to activity 1
1. A – South Atlantic high pressure33
B – South Indian high pressure33(4)
2. A tropical cyclone can be seen on the map.33
Mid-latitude cyclones are seen south of South Africa.33
The South Indian and South Atlantic high pressures are
south of South Africa.33
A low pressure cell can be seen over the centre of
South Africa.33
The date: 30/01/201033 (any 2) (4)
3. Coastal low pressure33(2)
4. a) F – Cold front33; H – Warm front33(4)
b) In an easterly direction/from west to east33(2)
c) Temperatures will decrease33; pressure will increase33;
Cumulonimbus clouds and thunderstorms will occur33(6)
5. a) Tropical cyclone33(2)
b) Three33(2)
c) Westerly/from east to west33(2)
d) Temperature must be above 27°C33; Humidity must be
high33; There must only be light and variable wind33;
The atmosphere must be unstable33; There must be a
wide area of low pressure with closed isobars33; It must
be between 5°S and 25°S (needs Coriolis force)33;
Little surface friction33 (any 2) (4)
6. Cloud cover: Clear skies33; Wind speed: 10 knots33;
Wind direction: SSE33; Air temperature: 22°C33;
Dewpoint temperature: 15 °C33(8)
[40]](https://image.slidesharecdn.com/mindtheseriesstudyguidegeographygrade12-230512090758-7aa84044/85/MIND-THE-SERIES-STUDY-GUIDE-GEOGRAPHY-GRADE-12-pdf-35-320.jpg)
![© Department of Basic Education 2014
18 CHAPTER 1 CLIMATE AND WEATHER Mind the Gap CAPS Grade 12 Geography
Chapter
1
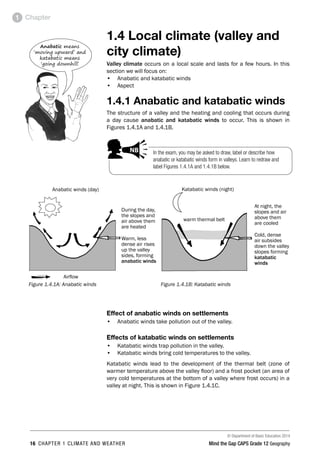
Let us look at how the Sun’s rays affect slope temperatures in the southern
hemisphere:
• North-facing slopes receive the direct rays of the Sun, making them
warmer.
• South-facing slopes receive the indirect rays of the Sun, making
them cooler.
Figure 1.4.2A shows how aspect influences the temperatures of north- and
south-facing slopes in the southern hemisphere.
Figure 1.4.2A: The impact of aspect on the temperatures of north- and south-facing slopes in the southern
hemisphere
North-
facing slope
South-
facing slope
• Direct Sun’s rays
• Heat a smaller surface
• Therefore slope is
warmer
• Indirect (oblique) Sun’s
rays
• Heat a larger surface area
• Therefore slope is cooler
Activity 2
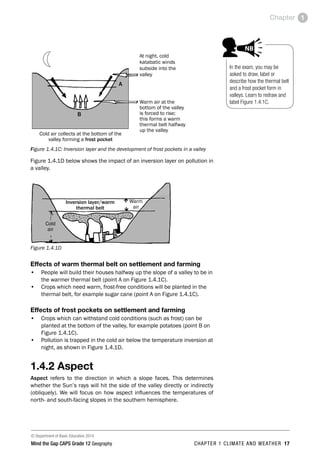
Figure 1.4.2B (left) illustrates valley climates. Study the diagram and
answer the questions that follow.
1. Name the valley winds depicted in A and B. (2 × 2 = 4)
2. State ONE advantage of the wind labelled A. (1 × 2 = 2)
3. Name the layer labelled C. (1 × 2 = 2)
4. Explain how the wind labelled B influences:
a) Farming in the valley (2 × 2 = 4)
b) Industry in the valley (2 × 2 = 4)
[16]
Answers to activity 2
1. A – Anabatic wind/upslope wind33
B – Katabatic wind/downslope wind/gravity wind33(4)
2. It can carry pollution out of the valley.33(2)
3. Inversion layer/thermal belt33(2)
Warm air
rising
Cold air
sinking
A
B
C
Figure 1.4.2B: Valley climates
S N
In the exam, you may be asked to draw, label or describe how
aspect affects the temperature on a north- or south-facing slope in
the southern hemisphere. Learn to redraw and label Figure 1.4.2A.
PAY SPECIAL ATTENTION
ACTIVITIES boy
and girl-left and
right of page
Step by step comment
EG - worked examples
HINT!
e.g.
NB NB
hint
activity
activity
comment
exams](https://image.slidesharecdn.com/mindtheseriesstudyguidegeographygrade12-230512090758-7aa84044/85/MIND-THE-SERIES-STUDY-GUIDE-GEOGRAPHY-GRADE-12-pdf-38-320.jpg)
![© Department of Basic Education 2014
Mind the Gap CAPS Grade 12 Geography CHAPTER 1 CLIMATE AND WEATHER 19
Chapter 1
Answers to activity 2 continued
4. a) Winds bring cold air into the valley.33
These winds cause a frost pocket to form.33
The frost can kill the crops.33(4)
b) Cold conditions make working conditions in the industry
difficult.33
Pollution produced by the industry will be trapped in the
valley.33(4)
[16]
1.4.3 City climates
Urbanareas(cities)experienceadifferentclimatecomparedtothesurrounding
rural areas. This results in the formation of a heat island over the city. In this
section, we will focus on the causes of a heat island. An urban heat island
is when the city has warmer temperatures than the surrounding rural areas.
In the exam, you may be asked how the temperatures change as you move
towards the centre of the city. Figure 1.4.3A shows how the temperatures
increase the closer you get to the city centre (also called the Central
Business District, or CBD). Note also the lower temperatures over the park.
Temperature
(°C)
Rural Suburban
residential
Commercial CBD Urban
residential
Park Suburban
residential
28
27
26
25
24
23
Figure 1.4.3A: An urban heat island profile
temperature
Figure 1.4.3B: Pollution dome: Pollution dome is a layer of pollution trapped over the city.
Pollution dome
Temperature profile
Urban Suburban Rural
Air
temperature
Air flow
Pollution
Pollution dome is closer to the
surface during the night.
Pollution domes have a vertical dimension
during the day.](https://image.slidesharecdn.com/mindtheseriesstudyguidegeographygrade12-230512090758-7aa84044/85/MIND-THE-SERIES-STUDY-GUIDE-GEOGRAPHY-GRADE-12-pdf-39-320.jpg)
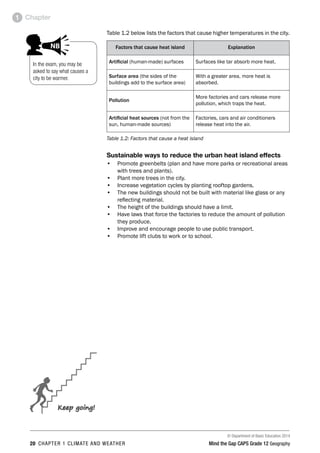
![© Department of Basic Education 2014
Mind the Gap CAPS Grade 12 Geography CHAPTER 2 GEOMORPHOLOGY 25
Chapter 2
To see how these three aspects affect runoff and infiltration
study Table 2.1 below.
Factor Impact on groundwater
Porous rock More infiltration, less runoff and more groundwater
Rock is not porous Less infiltration, more runoff and less groundwater
More time (gentle
slope)
More infiltration, less runoff and more groundwater
Less time (steep
slope)
Less infiltration, more runoff and less groundwater
More vegetation More infiltration, less runoff and more groundwater
Less vegetation Less infiltration, more runoff and less groundwater
Table 2.1: Factors affecting runoff and infiltration
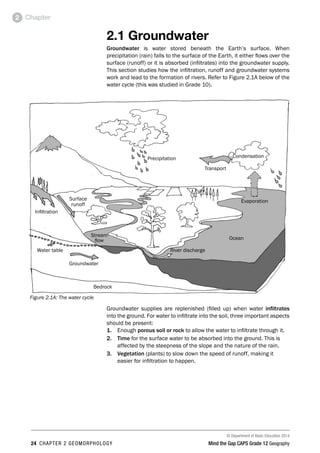
Figure 2.1B below shows the impact of rock type, time and vegetation on
groundwater. From the diagram we can see how the amount of groundwater
affects the height of the water table. This is the level below which the
ground is saturated (when it can hold no more water).
Precipitation
Infiltration
Runoff loss
by overland
flow
Soil layer
Water table
Groundwater
Base flow
Stream
runoff
Moisture loss
by transpiration
and
evaporation
Figure 2.1B: Factors that affect groundwater and movement of water on the
surface
Activity 2.1
1. List three important things that should be present for
water to infiltrate into the soil. (3 × 2 = 6)
2. Describe how groundwater supplies are replenished
(filled up). (1 × 2 = 2)
3. Why is it important to manage (look after) groundwater? (1 × 2 = 2)
[10]
Run-off and infiltration factors
are the same as drainage
density factors.
PAY SPECIAL ATTENTION
ACTIVITIES boy
and girl-left and
right of page
Step by step comment
EG - worked examples
HINT!
e.g.
NB NB
hint
activity
activity
comment
exams
In the exam, you may be
given a diagram and asked to
identify which aspect or factor
has affected the runoff or
infiltration.
PAY SPECIAL ATTENTION
ACTIVITIE
and girl-l
right of p
Step by step com
EG - worked examples
HINT!
e.g.
NB
hint
activity
activity
exams](https://image.slidesharecdn.com/mindtheseriesstudyguidegeographygrade12-230512090758-7aa84044/85/MIND-THE-SERIES-STUDY-GUIDE-GEOGRAPHY-GRADE-12-pdf-45-320.jpg)
![© Department of Basic Education 2014
26 CHAPTER 2 GEOMORPHOLOGY Mind the Gap CAPS Grade 12 Geography
Chapter
2
Answers to activity 2.1
1. Porous rock33, time for water to infiltrate (steepness of the
slope) 33, more vegetation33(6)
2. Groundwater supplies are replenished by precipitation33.(2)
3. South Africa has a shortage of water33.
To ensure we have a sustainable supply of water33.(2)
[10]
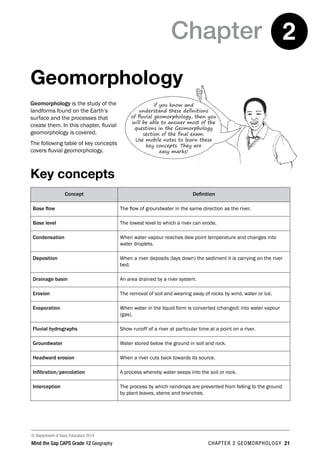
2.2 Rivers
When there is less infiltration, more runoff takes place. This starts as sheet
flow but very soon the water flows in a path called channel flow.
When we study rivers we look at them in different ways:
• Types of rivers
• River discharge
• Drainage basins
• Stages and profiles of rivers
2.2.1 Types of rivers
The water table refers to the surface of the water-saturated part of the
ground. The height of the water table changes each season. This gives rise
to different types of rivers. Rivers are classified depending on when (or if)
the river valley cuts into the water table.
There are three types of rivers:
• Permanent rivers flow all year round and are always in contact with
the water table.
• Periodic rivers only flow during the rainy season. They are in contact
with the water table only in the rainy season.
• Episodic rivers only flow after heavy rainfall when runoff flows into
the river. They do not come into contact with the water table.
Permanent river Periodic river Episodic river
KEY:
Water table (rainy season)
Water table (dry season)
Figure 2.2.1A: Cross section of the three different types of rivers
In paper 2 you may be asked
to identify the types of rivers.
AL ATTENTION
ACTIVITIES boy
and girl-left and
right of page
p comment
ed examples
NB
comment
In the exam, you may be
given a diagram of a cross
section of a river and asked
to identify the type of river.
Learn to identify the different
river types by redrawing and
labelling Figure 2.2.1A.
PAY SPECIAL ATTENTION
EG - worked examples
HINT!
e.g.
NB NB
hint
activity
exams](https://image.slidesharecdn.com/mindtheseriesstudyguidegeographygrade12-230512090758-7aa84044/85/MIND-THE-SERIES-STUDY-GUIDE-GEOGRAPHY-GRADE-12-pdf-46-320.jpg)
![© Department of Basic Education 2014
30 CHAPTER 2 GEOMORPHOLOGY Mind the Gap CAPS Grade 12 Geography
Chapter
2
Interpretation of Figure 2.2.2B (ii):
Drainage basin (ii) has more tributaries so it has a high drainage density.
Some reasons for high drainage density are:
• Heavy rainfall causing more runoff
• Steep slopes causing more runoff
• Very little vegetation causing more runoff
• Lots of rain so the ground cannot hold any more water causing more
runoff
Activity 2.2
Refer to drainage basins A and B in Figure 2.2.2C and the flow hydrograph
showing line graphs D and E after a period of rainfall, to answer the
following questions.
1. The rivers in drainage basin A flow all year
round. What type of river would this be
classified as? (1 × 2 = 2)
2. Graph D in the flow hydrograph shows the
runoff of drainage basin A after a period of rain.
a) Define the term ‘lag time’. (1 × 2 = 2)
b) How would the lag time change if massive
deforestation were to occur in drainage
basin A where D was recorded? (1 × 2 = 2)
c) Justify your answer in question b). (2 × 2 = 4)
d) Name another factor which could occur
and have the same impact on the lag
time as mentioned in question b). (1 × 2 = 2)
3. a) State the drainage density of drainage
basin B. (1 × 2 = 2)
b) Describe THREE possible causes for the drainage density
found in drainage basin B. (3 × 2 = 6)
[20]
Answers to activity 2.2
1. Permanent river33(2)
2. a)
The difference in time between when it rains and when the
peak flow discharge occurs.33(2)
b) Lag time will be shorter33(2)
c) There is less vegetation33, so there is more runoff33.(4)
d) Steep slope33/Heavy rainfall33/Lots of rain33 (any 1)(2)
3. a) High drainage density33(2)
b) Heavy rainfall causing more runoff33
Steep slopes causing more runoff33
Very little vegetation causing more runoff33
Lots of rain so the ground cannot hold any more water
causing more runoff33 (any 3)(6)
[20]
Complete
activity 2.2 to
practise the concepts
you have learnt so far
in this chapter.
A B
Q
D
E
Figure 2.2.2C: Drainage basins and flow
hydrograph](https://image.slidesharecdn.com/mindtheseriesstudyguidegeographygrade12-230512090758-7aa84044/85/MIND-THE-SERIES-STUDY-GUIDE-GEOGRAPHY-GRADE-12-pdf-50-320.jpg)
![© Department of Basic Education 2014
Mind the Gap CAPS Grade 12 Geography CHAPTER 2 GEOMORPHOLOGY 31
Chapter 2
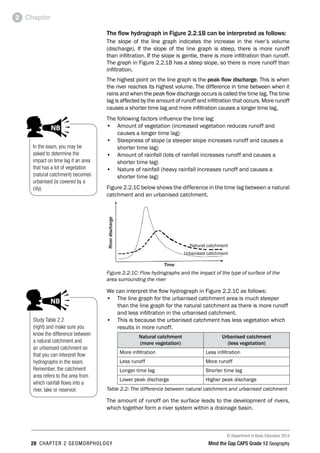
Drainage patterns
In a river system, individual streams flow over the surface in stream
channels. These channels will cut into the rock surface where it is easiest
to erode the rock. These channels form patterns known as drainage
patterns. Figure 2.2.2D, E, F below show three types of drainage patterns.
Figure 2.2.2D: Dendritic pattern
Name: Dendritic
Description: Looks like the branches of a tree with tributaries joining the
main river at acute angles
Explanation: Occurs where the underlying rock is of homogenous (equal)
resistance, namely either horizontal (flat) sedimentary rock, massive
igneous or metamorphic rock
Figure 2.2.2E: Trellis pattern
Name: Trellis
Description: Parallel streams with short tributaries joining at right angles
(90°)
Explanation: Occurs where the surface rock is of alternate resistance
(strong and weak rock), or where sedimentary rock is folded
Figure 2.2.2F: Radial pattern
Name: Radial
Description: Streams flow outwards from one raised central point (dome or
volcano)
Explanation: Rivers flow downhill and away from the highest central point.
Activity 2.3
Identify and briefly describe the drainage patterns in Figure 2.2.3G below.
(3 × 4 = 12)
[12]
A B C
Figure 2.2.3G: Drainage patterns
You may be asked in an exam to identify the drainage pattern,
describe the pattern (what it looks like) or explain what caused the
pattern to occur. When you are asked to explain the cause of the drainage pattern, you
may be required to name the underlying rock structure in the area.
ECIAL ATTENTION
ACTIVITIES boy
and girl-left and
right of page
step comment
orked examples
NB
comment
Figures
2.2.2 D, E and F
summarise the main
things you need to
learn about drainage
patterns.](https://image.slidesharecdn.com/mindtheseriesstudyguidegeographygrade12-230512090758-7aa84044/85/MIND-THE-SERIES-STUDY-GUIDE-GEOGRAPHY-GRADE-12-pdf-51-320.jpg)
![© Department of Basic Education 2014
32 CHAPTER 2 GEOMORPHOLOGY Mind the Gap CAPS Grade 12 Geography
Chapter
2
Answers to activity 2.3
A Dendritic: Looks like the branches of a tree with tributaries
joining the main river at acute angles. 3333(4)
B Trellis: Parallel streams with short tributaries joining at right
angles (90°). 3333(4)
C Radial: Streams flow outwards from one raised central point
(dome or volcano). 3333(4)
[12]
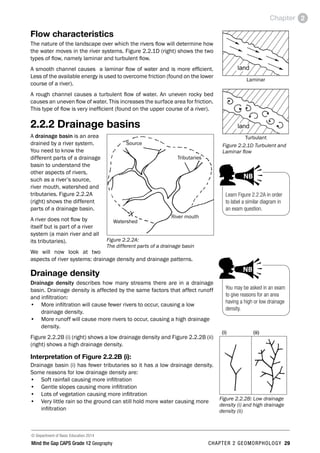
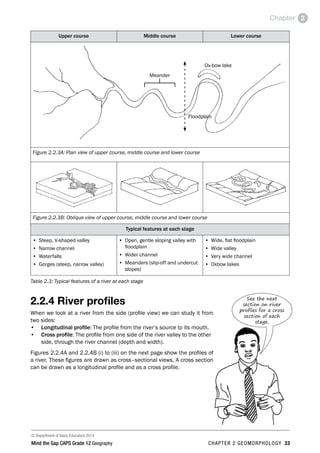
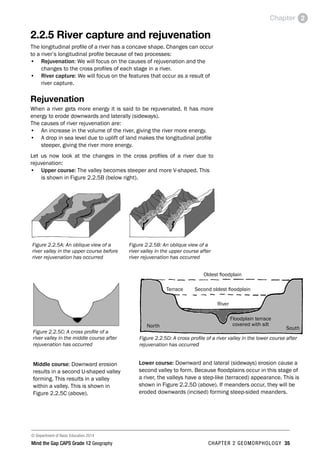
2.2.3 Stages of a river
As a river flows from the mountains (source) to the sea (mouth), the amount
of erosion and deposition changes. This changes what the river looks like
from its source to its mouth:
• In its upper course, a river erodes vertically (downwards) creating
steep valleys.
• In the middle course, lateral erosion and a little bit of deposition
occur. The lateral erosion occurs unequally (unevenly) on the sides
of the river. This causes the river to start meandering (flowing or
bending from side to side).
• By the time the river reaches its lower course, the eroded material
(sediment) carried by the river begins to be deposited onto the
floodplains. A floodplain is a wide, flat area alongside a river.
• Floodplains are formed by the river eroding laterally (sideways). In
the lower course the meanders may be cut off when the river flows
straight, forming an ox-bow (U-shaped) lake.
Figure 2.2.3A (see page 33) shows the stages of a river in plan
view.
Figure 2.2.3B (see page 33) shows the stages of a river in oblique
view.
Table 2.3 (see page 33) summarises the features of a river at
each stage.
You may be asked in an exam to identify the stage of a river
from a plan view, an oblique view or a cross section diagram. You
may also be asked to draw a river in a plan view or a cross section diagram of a river
at a particular stage. To do this, learn the characteristic features of each stage. This is
also useful for identifying the stage of a river on a topographic map.
EXAM
TIP
PAY SPECIAL ATTENTION
ACTIVITIES boy
and girl-left and
right of page
EG - worked examples
HINT!
e.g.
NB
hint
tip
activity
exam
activity](https://image.slidesharecdn.com/mindtheseriesstudyguidegeographygrade12-230512090758-7aa84044/85/MIND-THE-SERIES-STUDY-GUIDE-GEOGRAPHY-GRADE-12-pdf-52-320.jpg)
![© Department of Basic Education 2014
34 CHAPTER 2 GEOMORPHOLOGY Mind the Gap CAPS Grade 12 Geography
Chapter
2
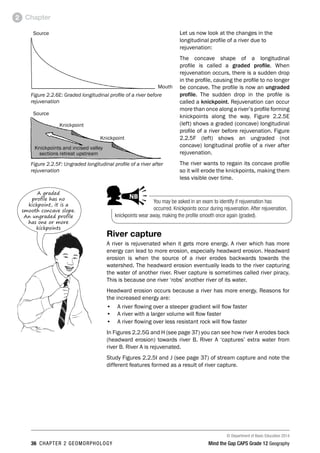
Source
Mouth
Figure 2.2.4A: Cross sectional view of a longitudinal profile
(i) Cross profile of (ii) Cross profile of (iii) Cross profile of
upper course middle course lower course
Figure 2.2.4B: Cross-sectional views of a cross profile at different stages in a
river
Activity 2.4
1. Draw a longitudinal profile of a river (from source to mouth)
and show the upper, middle and lower courses. (1 × 4 = 4)
2. List two features of the upper course of a river. (2 × 2 = 4)
3. Describe a river in its lower course. (2 × 2 = 4)
4. Describe one difference between the river channel in the
upper course and the lower course. (2 × 2 = 4)
[16]
Answers to activity 2.4
1.
Source
Mouth
Upper
course
Middle
course
Lower
course
(4)
2. Steep V-shaped valley 33
Narrow channel 33
Interlocking spurs 33
Waterfalls 33
Gorges 33 (any 2) (4)
3. Wide flat floodplain 33
Wide valley 33
Very wide channel 33
Ox-bow lakes 33 (any 2) (4)
4. Narrow channel in the upper course 33
Wide channel in the lower course 33(4)
[16]](https://image.slidesharecdn.com/mindtheseriesstudyguidegeographygrade12-230512090758-7aa84044/85/MIND-THE-SERIES-STUDY-GUIDE-GEOGRAPHY-GRADE-12-pdf-54-320.jpg)
![© Department of Basic Education 2014
38 CHAPTER 2 GEOMORPHOLOGY Mind the Gap CAPS Grade 12 Geography
Chapter
2
Activity 2.5
Figure 2.2.5K (right) shows
a plan view of an area before
river capture has occurred.
Redraw the rivers after river
capture has occurred.
On the diagram you have
drawn, label the resultant
features of river capture.
[6]
Answer to activity 2.5
Captured river3
Elbow of capture3
Misfit stream3
Captor river3
Waterfall3
Wind gap3
Figure 2.2.5L [6]
2.2.6 Catchment area and river
management
Importance of managing drainage basins
and catchment areas
• South Africa is not a water rich country.
• Our river systems are a resource.
• Like all other natural resources, rivers are shared.
• Water is essential for our survival and well-being, as well as for social
and economic development.
• Water resources are used for agriculture, industry, domestic use,
hydro electric power and recreation.
• River systems are part of the water cycle.
• All water bodies are linked.
• The way we use the land has a dramatic impact on the water cycle.
• Our river systems are a habitat and function as ecosystems.
• A river links together many ecosystems in a catchment.
River B
Watershed
Headward
erosion
River A
Figure 2.2.5K
This may be
examined as a
case study.](https://image.slidesharecdn.com/mindtheseriesstudyguidegeographygrade12-230512090758-7aa84044/85/MIND-THE-SERIES-STUDY-GUIDE-GEOGRAPHY-GRADE-12-pdf-58-320.jpg)
![© Department of Basic Education 2014
Mind the Gap CAPS Grade 12 Geography CHAPTER 2 GEOMORPHOLOGY 39
Chapter 2
Impact of people on drainage basins and
catchment areas
• Landfills, mining and agriculture pollute groundwater.
• Industries and sewage works discharge water waste into rivers.
• Agricultural run-off contains fertilizers and pesticides, which pollute
rivers.
• Domestic use of rivers in informal settlements pollutes and litters
rivers.
• Boreholes reduce the amount of groundwater that feeds rivers.
• Alien vegetation consumes large quantities of water very quickly in
the river zone.
• Overgrazing and removal of vegetation reduce groundwater and
increase run-off.
• Dams change the flow of a river.
• Draining of wetlands causes increased flooding.
• Flood control methods restrict the path of a river.
Activity 2.6
Use the topographical map of Nelspruit 2530BD at the back of this study
guide to answer the following questions.
1. The contour interval of this topographical map is...
A. 1000 metres B. 50 000 metres
C. 25 metres D. 20 metres
2. The Crocodile River is a/an...
A. Periodic river B. Exotic river
C. Permanent river D. Seasonal river
(2 × 2 = 4)
[4]
Answers to activity 2.6
1. D 33
2. C 33 [4]
Keep going!](https://image.slidesharecdn.com/mindtheseriesstudyguidegeographygrade12-230512090758-7aa84044/85/MIND-THE-SERIES-STUDY-GUIDE-GEOGRAPHY-GRADE-12-pdf-59-320.jpg)
![© Department of Basic Education 2014
44 CHAPTER 3 RURAL SETTLEMENT AND URBAN SETTLEMENT Mind the Gap CAPS Grade 12 Geography
Chapter
3
Activity 3.1
Complete the table to illustrate your understanding of the classification of
settlements as either rural or urban.
Rural Urban
Function (activity) (1 × 2 = 2) (1 × 2 = 2)
Size and complexity
(smallest to largest
settlements) (3) (5)
[12]
Answers to activity 3.1
Rural Urban
Function (activity) Unifunctional (primary
activities)33(2)
Multifunctional (secondary
and tertiary activities)33
(2)
Size and complexity
(smallest to largest
settlements)
Farmstead, hamlet
and village333
(3)
Town3
, city3, metropolis3,
conurbation3,
megalopolis3(5)
[12]
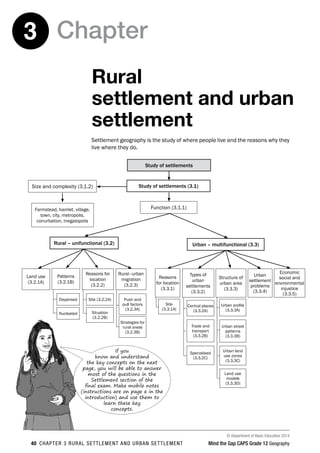
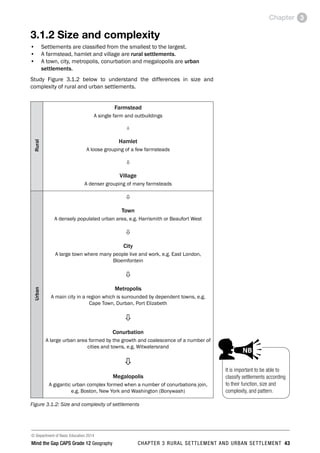
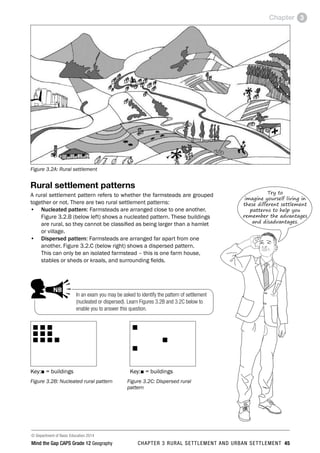
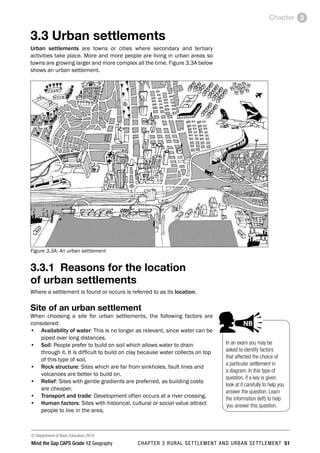
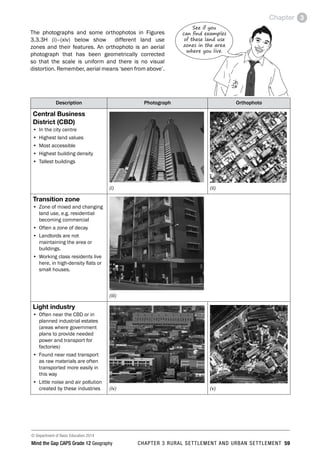
3.2 Rural settlements
Rural settlements are the smallest settlements which are unifunctional.
They are farmsteads, hamlets or villages, where primary activities
(farming, fishing, forestry or mining) take place. Figure 3.2.A illustrates a
rural settlement.
Land use in rural settlements
The largest land use in South Africa is agriculture. Approximately 12, 1% of
the land is used for both commercial and subsistence cultivation of crops.
Although rural communities focus on primary economic activities (farming
and forestry), there are a number of different ways in which the land in
these settlements can be used.
Subsistence farming involves using the land to grow crops and breed
animals that are a source of food for the family living on the farm. The aim
is not to sell the goods, but to consume them.
Commercial farming is practised where the land is used to grow crops or
breed animals that are then sold as food sources to other markets. The
main aim of this rural land use is to generate income for the farmers.
Commercial farming can be either intensive or extensive.
Commercial farming can be divided into:
• Stock farming: Animals, for example, cows, chicken, sheep, pigs.
• Crop farming: Cultivation of land, for example, maize, wheat, fruit,
vegetables.
• Mixed farming: A combination of stock and crop farming.
You need to
know how to
identify stock and
crop farming on
a map.](https://image.slidesharecdn.com/mindtheseriesstudyguidegeographygrade12-230512090758-7aa84044/85/MIND-THE-SERIES-STUDY-GUIDE-GEOGRAPHY-GRADE-12-pdf-64-320.jpg)
![© Department of Basic Education 2014
Mind the Gap CAPS Grade 12 Geography CHAPTER 3 RURAL SETTLEMENT AND URBAN SETTLEMENT 47
Chapter 3
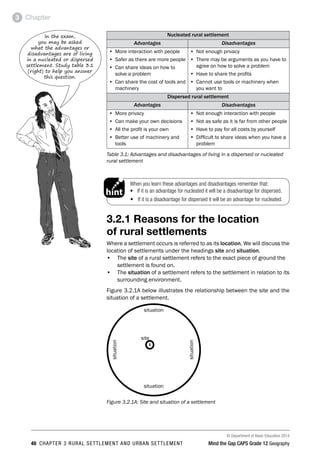
Site of a rural settlement
When choosing a site for rural settlements, the following factors are
considered:
• Availability of water
• Arable (fertile) land
• Pastoral (grazing) land
• Building materials
• Fuel such as wood from a forest
Situation of a settlement
When choosing a situation for rural settlements the following factors are
considered:
• Above the flood line away from a river
• On the north-facing slope for warmer temperatures
• In the thermal belt for warmer night time temperatures
• Next to a road for accessibility
In an exam you may be asked to identify factors that affected
the choice of the site of a particular settlement in a diagram. In
this type of question if a key is given, study it carefully to help you answer the question.
Learn the information above to help you answer this question.
PECIAL ATTENTION
ACTIVITIES boy
and girl-left and
right of page
y step comment
worked examples
NB
y
y
comment
Activity 3.2
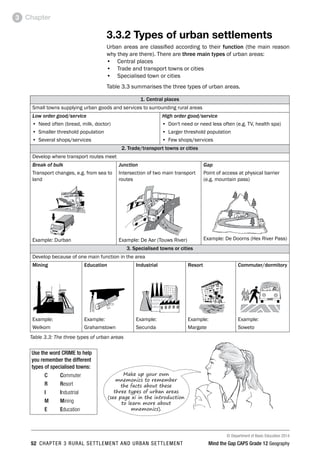
Study the two rural settlement diagrams in Figures 3.2.1B and 3.2.1C and
complete the table.
Figure 3.2.1B Figure 3.2.1C
Figure 3.2.2B Figure 3.2.2C
Function (1 × 2 = 2) (1 × 2 = 2)
Settlement pattern (1 × 2 = 2) (1 × 2 = 2)
Factors affecting the site (1 × 2 = 2) (1 × 2 = 2)
Factors affecting the situation (1 × 2 = 2) (1 × 2 = 2)
[16]
These last two
factors are not as
relevant today as they
were in the past.
Practise
applying what you have
learnt about the site
and situation of rural
settlements by
completing Activity
3.2.](https://image.slidesharecdn.com/mindtheseriesstudyguidegeographygrade12-230512090758-7aa84044/85/MIND-THE-SERIES-STUDY-GUIDE-GEOGRAPHY-GRADE-12-pdf-67-320.jpg)
![© Department of Basic Education 2014
48 CHAPTER 3 RURAL SETTLEMENT AND URBAN SETTLEMENT Mind the Gap CAPS Grade 12 Geography
Chapter
3
Answers to activity 3.2
Figure 3.2.2B Figure 3.2.2C
Function Rural/unifunctional33
(2)
Rural/unifunctional 33
(2)
Settlement
pattern
Nucleated33
(2)
Dispersed/isolated33
(2)
Factors affecting
the site
Arable land33
Drinking water33
(any 1) (2)
Arable land33
Drinking water33
Grazing land 33
(any 1) (2)
Factors affecting
the situation
Away from water33
Dry point settlement33
(any 1) (2)
Away from water33
Dry point settlement33
Near a road for
transport33
(any 1) (2)
[16]
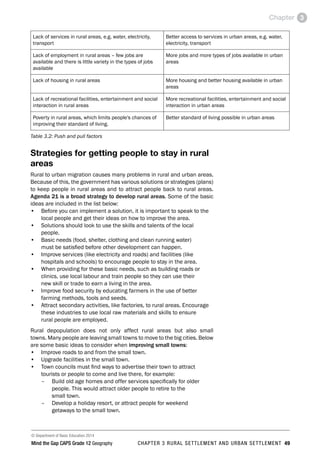
3.2.2 Rural-urban migration
As countries develop and urban areas expand, more and more people
move from the rural areas to cities and towns. This movement of people
from a rural area to an urban area is called rural-urban migration.
In this section we look at the factors that cause people to leave the rural
areas (push factors) and move to the urban areas (pull factors). We will
also look at what governments do to keep people in the rural areas.
Push and pull factors causing people
to leave the rural areas
Table 3.2 below summarises the factors that make people want to leave
the rural areas and move to cities.
Make sure
you understand the
difference between
push and pull
factors.
Push factors
Remember, these make you
want to leave rural areas.
They push you away.
Pull factors
Remember, these make you
want to move to urban areas.
They pull you in.
Natural disasters, such as drought or floods, have a
greater impact in rural areas.
Natural disasters have a smaller impact; government
provides more help to urban areas during droughts
and floods.
Lack of facilities in rural areas, e.g. fewer schools,
colleges or universities, and fewer hospitals or clinics in
rural areas
Better and more access to education and medical
facilities in urban areas](https://image.slidesharecdn.com/mindtheseriesstudyguidegeographygrade12-230512090758-7aa84044/85/MIND-THE-SERIES-STUDY-GUIDE-GEOGRAPHY-GRADE-12-pdf-68-320.jpg)
![© Department of Basic Education 2014
Mind the Gap CAPS Grade 12 Geography CHAPTER 3 RURAL SETTLEMENT AND URBAN SETTLEMENT 53
Chapter 3
Central places
Centralplacesaresmalltownsthatsupplyurbanservicestothesurrounding
rural area. They have shops that sell basic goods or provide basic services
to people who live and work on the farms in the area. Goods or services
may be classified as low or high order. Study Table 3.4 below to learn the
differences between low and high order goods or services.
Low order goods/services High order goods/services
Definition A function or good you need or buy
often
A function or good you buy less often or
do not need on a regular basis
Examples Low order goods: bread, milk, petrol
Low order services: doctors,
mechanics
High order goods: television, designer
shoes
High order services: specialist doctors,
health spas
Threshold population Smaller number of people Larger number of people
Number of these shops or
services
Many – people want to buy low order
goods and services on a regular basis
Few – people do not need high order
goods and services very often
Table 3.4: Low and high order goods or services
• Threshold population: The number of people a function must
serve in order to be profitable, or the number of people needed
to support a function or town. Threshold population refers to
how many customers a shop or service must have in order to be
profitable.
• Range: The distance a person will travel to obtain a particular good
or service. Range refers to how far someone will travel to buy a
particular product or access a particular service.
• Sphere of influence or service area: The area served by a business
selling a particular good or service. This is the area where people
live who buy goods from a particular shop or use a particular
service.
Activity 3.3
1. Expand the blank diagram in Figure 3.3.2A below and use the
following terms to add a key to the diagram:
a) Threshold population (1 × 2 = 2)
b) Range (1 × 2 = 2)
c) Sphere of influence (1 × 2 = 2)
Figure 3.3.2A
2. Write definitions to show your understanding of the terms in
a), b) and c). (3 × 2 = 6)
[12]
Make sure you
know these three
definitions which relate
to central places. They
are easy marks!
Apply what
you have learnt
about central places
by completing
activity 3.3.](https://image.slidesharecdn.com/mindtheseriesstudyguidegeographygrade12-230512090758-7aa84044/85/MIND-THE-SERIES-STUDY-GUIDE-GEOGRAPHY-GRADE-12-pdf-73-320.jpg)
![© Department of Basic Education 2014
54 CHAPTER 3 RURAL SETTLEMENT AND URBAN SETTLEMENT Mind the Gap CAPS Grade 12 Geography
Chapter
3
Answers to activity 3.3
1.
KEY:
Settlement or function33
Sphere of influence33
Range33
Threshold population33
Figure 3.3.2B
2. a)
The minimum number of people needed to maintain a
settlement or function33(2)
b) The maximum distance people are prepared to travel to a
settlement or a function33(2)
c) The maximum area served by a settlement or function33(2)
[12]
Trade and transport towns or cities
These are towns or cities which develop at a point where transport routes
meet. Easy access to trade and transport in the area is the reason why
people settle there.
There are three types of trade and transport cities:
• Break-of-bulk towns or cities: They develop at a point where the
type of transport changes. This is most often at a harbour where the
transport changes from sea to land.
• Junction towns or cities: They develop at an intersection of two major
transport routes, for example a railway junction.
• Gap towns or cities: They develop at a point of access through or
over a physical barrier, for example at a mountain pass.
Specialised towns or cities
These are towns or cities which have developed because of one main
or dominant function occurring in the area. If the function were to stop
then the city would be at risk of becoming a ghost town (a deserted town).
Examples of specialised towns or cities are:
• Mining towns or cities, e.g. Welkom
• Education towns or cities, e.g. Grahamstown
• Industrial towns or cities, e.g. Secunda, Sasolburg
• Resort towns or cities, e.g. Margate
• Dormitory or commuter towns or cities, e.g. Soweto
In an exam, you may be asked to identify the type of trade and transport city in a
diagram. If a key is given, look at it carefully to help you answer the question. Learn the
information above to help you answer this question.
PAY SPECIAL ATTENTION
ACTIVITIES boy
and girl-left and
EG - worked examples
HINT!
e.g.
NB NB
hint
activity
exams](https://image.slidesharecdn.com/mindtheseriesstudyguidegeographygrade12-230512090758-7aa84044/85/MIND-THE-SERIES-STUDY-GUIDE-GEOGRAPHY-GRADE-12-pdf-74-320.jpg)
![© Department of Basic Education 2014
56 CHAPTER 3 RURAL SETTLEMENT AND URBAN SETTLEMENT Mind the Gap CAPS Grade 12 Geography
Chapter
3
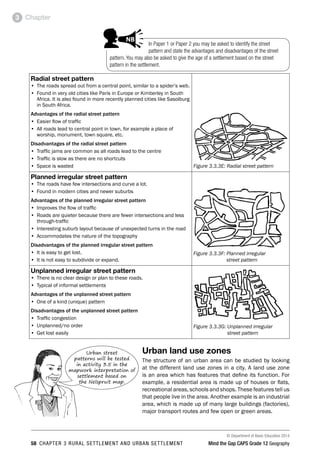
Figure 3.3.3B below shows the urban profile and how the land value
decreases from the central business district (CBD) towards the outskirts
of the urban area.
High-income
residential: Large;
expensive homes;
swimming pools; tennis
courts; big grounds
Suburban office park
(also called outlying
business district):
Landscaped offices
in suburbs; parking
available; peaceful
surroundings
Low-cost housing/
informal settlement:
Residential; high
density; basic services
not always available
Transitional zone: Around
CBD; old buildings,
usually run-down; mixed
land use e.g. warehouses
and industry; some
redevelopment
Suburban shopping
centre: Large shopping
centres in residential
suburbs; lots of parking
available; entertainment
and retail (shops)
Industrial zone:
Factories (heavy and
light industry); out of
town; noisy and dirty;
needs to be close to
transport routes
Urban–rural fringe:
On outskirts of
built-up area;
smallholdings, golf
courses; horse-
riding stables; plant
nurseries; cemeteries;
land not so expensive
CBD (Central Business
District): Tallest
buildings; most
expensive land; centre
of business activity;
accessible to all
Figure 3.3.3B: Urban profile showing decrease in land value from the CBD towards the outskirts of the urban area
In an exam you may be asked to describe how the building density
or buildings might change as you move away from the CBD. You
may also be asked to explain why the height or density of buildings changes. Learn the
information above to help you answer this question.
PAY SPECIAL ATTENTION
ACTIVITIES boy
and girl-left and
right of page
Step by step comment
EG - worked examples
HINT!
e.g.
NB NB
hint
activity
activity
comment
exams
Activity 3.4
1. On the urban profile shown in Figure 3.3.3B on page 56 draw
a line graph to show how land value changes as you move
towards the CBD. (1 × 2 = 2)
2. How does building density change as you move towards the
centre of the city? (1 × 2 = 2)
3. Explain your answer in question 2. (2 × 2 = 4)
4. Why would an office park move away from the Central
Business District? (2 × 2 = 4)
[12]
Apply your
understanding of urban
profiles by completing
Activity 3.4.](https://image.slidesharecdn.com/mindtheseriesstudyguidegeographygrade12-230512090758-7aa84044/85/MIND-THE-SERIES-STUDY-GUIDE-GEOGRAPHY-GRADE-12-pdf-76-320.jpg)
![© Department of Basic Education 2014
Mind the Gap CAPS Grade 12 Geography CHAPTER 3 RURAL SETTLEMENT AND URBAN SETTLEMENT 57
Chapter 3
Answers to activity 3.4
1.
Land
value
City profile
Figure 3.3.3C
2. The density of the buildings increases. 33(2)
3. The land is very expensive in the CBD so many buildings are built
closer together and on smaller pieces of land. 33 (4)
4. Land value is cheaper 33/There is less traffic congestion 33/
It is closer to clients 33/There is less noise 33/There is more
parking33 (any 2) (4)
[12]
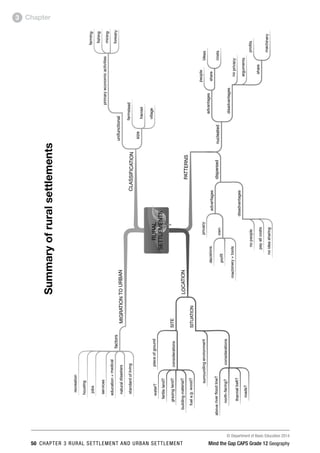
Urban street patterns
The structure of an urban area can be studied from above by looking at the
patterns formed by the streets of the urban area. The layout or arrangement
of the roads is called the street pattern. In this section we focus on four
street patterns:
• Gridiron
• Radial
• Planned irregular
• Unplanned irregular
Study Figures 3.3.3A to D to G (below and on page 58) to understand the
four street patterns.
Gridiron street pattern
• The roads intersect at right angles, forming rectangular blocks.
• Found in the CBD and older cities
Advantages of the gridiron street pattern
• Easy to find way around (cannot get lost)
• Land can be divided up easily
• Can be converted into one-way streets to ease traffic congestion
• Shorter distance to travel
• Little wastage of land
Disadvantages of the gridiron street pattern
• Traffic congestion as traffic stops at every intersection
• More accidents because of intersections
• Monotonous (boring) suburb layout
Figure 3.3.3D: Gridiron street pattern
land value](https://image.slidesharecdn.com/mindtheseriesstudyguidegeographygrade12-230512090758-7aa84044/85/MIND-THE-SERIES-STUDY-GUIDE-GEOGRAPHY-GRADE-12-pdf-77-320.jpg)
![© Department of Basic Education 2014
64 CHAPTER 3 RURAL SETTLEMENT AND URBAN SETTLEMENT Mind the Gap CAPS Grade 12 Geography
Chapter
3
b) How could this farm help to prevent rural–urban
migration? (1 × 2 = 2)
6. What type of city would Nelspruit/Mbombela be classified
as? Explain your answer. (2 × 2 = 4)
7. a)
Give the block reference of the land use zone known
as the CBD. (1 × 2 = 2)
b) Draw a simple cross section sketch to illustrate the
urban profile of the land use zone in question a). (2 × 2 = 4)
c) What type of street pattern is found in this zone?
Give two advantages and two disadvantages for this
street pattern. (5 × 2 = 10)
8. West Acres is an example of an upper income residential
area. Give two reasons from the map to support this
statement. (2 × 2 = 4)
Study the orthophoto at the back of the study guide.
9. What land use is found at A, B, C and D? (4 × 2 = 8)
10. The residents of West Acres do not like travelling to the
centre of Nelspruit/Mbombela to do their shopping as it
has become so congested. Where would you suggest that
they build a new shopping mall? Explain why you have
chosen this site to build on. (3 × 2 = 6)
[70]
Answers to activity 3.5
1. Nelspruit/Mbombela is the capital of Mpumalanga province.33(2)
2. a) Analysis of the site of Nelspruit/Mbombela:
• Near water from the river33
• Arable land from the river valley33
• Possible building material from the surrounding hills33
• Possible fuel from the vegetation on the slopes33(8)
b) Discussion of the situation of Nelspruit/Mbombela:
i) Topography: It is on the valley floor so easy to establish3/
Gap city between the mountains3
ii) Gradient: The city is built on flat land for the large
buildings3/Residential areas are more on the slopes3
iii) River: Buildings on the inner bank away from possible
flooding3
iv) Transport: On the main road to Mozambique on N43/
Links to the west–east and north–south3/Part of
Maputo Corridor3 (any 3 facts) (6)
3. a)
Block C2 is a nucleated settlement pattern.33
The buildings are close to one another.33(4)
b) The settlement in block B3 has a linear shape.33 It lies along
the road/along a contour so that it is easy to build on the
same height above sea level/altitude.33(4)](https://image.slidesharecdn.com/mindtheseriesstudyguidegeographygrade12-230512090758-7aa84044/85/MIND-THE-SERIES-STUDY-GUIDE-GEOGRAPHY-GRADE-12-pdf-84-320.jpg)
![© Department of Basic Education 2014
66 CHAPTER 3 RURAL SETTLEMENT AND URBAN SETTLEMENT Mind the Gap CAPS Grade 12 Geography
Chapter
3
Study Tables 3.5
to 3.7 to learn about
the causes, effects and
solutions to these three
urban problems.
Answers to activity 3.5 (continued)
8. West Acres is an example of an upper income residential area.
Two reasons are evident on the map to support this statement:
• Away from the CBD33
• It has large blocks of land between the roads.33
• Street pattern plan is irregular33
• It is on the warmer, north-facing slope so land will be more
expensive.33
• Away from pollution and noise33 (any 2) (4)
Questions based on the orthophoto:
9. Land use found at A, B, C and D:
A = Transport (railway station)/Industrial33
B = Commercial/Business – CBD33
C = Residential33
D = Recreation/Showground33(8)
10. The best place for a shopping mall for the residents of West Acres
would be near E on the orthophoto. The reasons are as follows:
• The land is not being used for other purposes.33
• It is near a road so people living nearby can get there easily.33
• It is close to the suburb West Acres.33
• The land here is quite flat (as indicated by the contours that
are far apart).33 (any 3 reasons) (6)
[70]
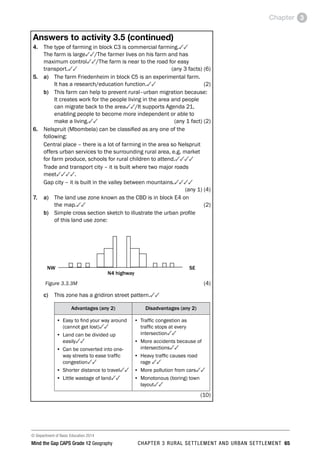
3.3.4 Urban settlement problems
As an urban area grows and more people move into the area, certain
problems are created and get worse as the city gets bigger. These problems
are often worse in the CBD.
In this section we focus on the following three urban problems:
• Congestion
• Urban decay
• Centralisation
Problem: Congestion (too many cars on the roads)
Causes Effect Solution
• Too many people
using own cars
• Not enough public
transport
• Old street planning
• Increased air
pollution
• More accidents
• More stress and
health problems; road
rage
• Improve public
transport
• Have lift schemes
• Encourage some
businesses to move
out of the CBD
• Synchronize traffic
lights
Table 3.5: Causes, effects and solutions to the urban problem of congestion](https://image.slidesharecdn.com/mindtheseriesstudyguidegeographygrade12-230512090758-7aa84044/85/MIND-THE-SERIES-STUDY-GUIDE-GEOGRAPHY-GRADE-12-pdf-86-320.jpg)
![© Department of Basic Education 2014
70 CHAPTER 3 RURAL SETTLEMENT AND URBAN SETTLEMENT Mind the Gap CAPS Grade 12 Geography
Chapter
3
Activity 3.6
Refer to Figure 3.3.5A below, which shows a settlement typical of the
South African urban landscape. It shows urban functions or services of a
low and a high order.
Figure 3.3.5A
1. a) What is a settlement? (1 × 2 = 2)
b) Is the settlement shown in Figure 3.3.5A a rural or an
urban settlement? (1 × 2 = 2)
c) Give one reason for your answer to question b) above.(1 × 2 = 2)
2. a)
Distinguish between a low-order function and a high-
order function. (2 × 2 = 4)
b) From Figure 3.3.5A, identify one low-order function and
one high-order function. (1 × 2 = 2)
c) Explain the meaning of the term sphere of influence
of a function or service. (1 × 2 = 2)
d) Will the hospital or the café have a larger sphere of
influence? (1 × 2 = 2)
e) Explain your answer to question d) above. (2 × 2 = 4)
3. a)
The bakery is an example of a light industry. What is
a light industry? (1 × 2 = 2)
b) Unlike a heavy industry, the bakery can be located
close to the hospital. Explain why this bakery does
not have to be located outside the city. (2 × 2 = 4)
c) Why is it important for the bakery to have a central
location? (2 × 2 = 4)
4. a)
With reference to Figure 3.3.5A, explain why many
people from the surrounding rural areas are attracted
to this settlement. (2 × 2 = 4)
b) Explain why it is important for the illustrated
settlement to slow down the movement of people
from rural areas to this settlement. (2 × 2 = 4)
[38]
Apply your
knowledge from the
whole settlement section to
complete activities
3.6 and 3.7.](https://image.slidesharecdn.com/mindtheseriesstudyguidegeographygrade12-230512090758-7aa84044/85/MIND-THE-SERIES-STUDY-GUIDE-GEOGRAPHY-GRADE-12-pdf-90-320.jpg)
![© Department of Basic Education 2014
72 CHAPTER 3 RURAL SETTLEMENT AND URBAN SETTLEMENT Mind the Gap CAPS Grade 12 Geography
Chapter
3
Answers to activity 3.6 (continued)
b) Slowing down the rural-urban migration must happen so
that it can:
–
– Avoid overcrowding 33
–
– Reduce traffic congestion 33
–
– Reduce pressure on resources 33
–
– Reduce the unemployment caused by too many people
coming to the city 33
–
– Reduce the problem of lower standards of living 33
–
– Reduce the problem of informal settlements being built 33
–
– Prevent a possible increase in crime 33
–
– Prevent urban decay 33
–
– Prevent the development of social problems 33 (any 2) (4)
[38]
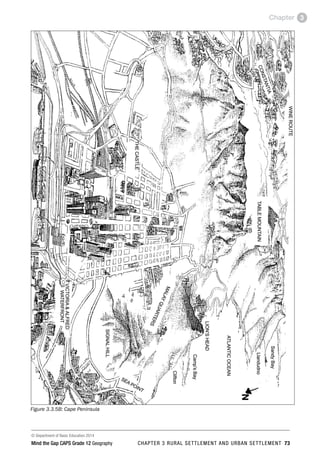
Activity 3.7
Refer to Figure 3.7 and read the following extract (Cape Peninsula) before
you answer the questions that follow.
The Cape Peninsula stretches from the Cape of Good Hope and Cape Point northwards
to Table Mountain and the city of Cape Town. It comprises, for the most part, strikingly
beautiful mountains, including the well-known Table Mountain which overlooks the bay
and city. Its western and eastern shorelines are graced by attractive residential and
resort centres that are a magnet for holiday-makers.
(Adapted from Traveller’s Guide to South Africa)
Question 1
Refer to the wine farms located in the area of Constantia. Wine
farm estates are examples of isolated farmsteads.
1.1 Define the term isolated farmstead. (1 × 2 = 2)
1.2 State two economic advantages of this settlement pattern.
(2 × 2 = 4)
1.3 Describe two social disadvantages of this settlement
pattern. (2 × 2 = 4)
1.4 Wine farms in South Africa form part of all three economic activities:
primary, secondary and tertiary activities. Explain this statement in a
short a paragraph (no more than 12 lines). (6 × 2 = 12)
[22]
Question 2
Study the city of Cape Town in the centre of Figure 3.7 to answer the
following questions.
2.1 Define the term site. (1 × 2 = 2)
2.2 What two factors were responsible for the site chosen for
the development of Cape Town? (2 × 2 = 4)
2.3 Why is Cape Town classified as a break-of-bulk point? (1 × 2 = 2)](https://image.slidesharecdn.com/mindtheseriesstudyguidegeographygrade12-230512090758-7aa84044/85/MIND-THE-SERIES-STUDY-GUIDE-GEOGRAPHY-GRADE-12-pdf-92-320.jpg)
![© Department of Basic Education 2014
74 CHAPTER 3 RURAL SETTLEMENT AND URBAN SETTLEMENT Mind the Gap CAPS Grade 12 Geography
Chapter
3
2.4 a) What do the letters CBD stand for? (1 × 2 = 2)
b) Identify the street pattern of the CBD of Cape Town. (1 × 2 = 2)
c) Provide one advantage and one disadvantage of this
street pattern. (2 × 2 = 4)
d) With reference to Figure 3.7, identify one characteristic
of the CBD’s profile. (1 × 2 = 2)
e) Explain why the CBD has the characteristic you
identified in question d). (2 × 2 = 4)
2.5 What evidence is there that the CBD of Cape Town is the
most accessible land use zone? (1 × 2 = 2)
[24]
Question 3
Refer to the residential areas of Sea Point and the Malay Quarters.
3.1 a) Classify the two areas as low- or high-income areas
respectively. (2 × 2 = 4)
b) Explain your classification of Sea Point in question a)
by referring to evidence from Figure 3.7. (2 × 2 = 4)
3.2 The open space around the Malay Quarter may attract
migrants from the rural areas.
a) What is likely to develop here as a result of this
migration? (1 × 2 = 2)
b) Explain the occurrence of this development. (2 × 2 = 4)
c) State two reasons for these migrants leaving the
rural areas. (2 × 2 = 4)
d) What problems are associated with this development?
(2 × 2 = 4)
e) You are part of a task team set up by the government to
provide suggestions on how to slow the movement of
people from the rural areas, as well as attract people
back to small towns. In a short paragraph (no more than
12 lines), discuss some of your suggestions. (6 × 2 = 12)
[34]
Question 4
4.1 Provide the correct term for the following phrases:
a) A settlement where only primary activities occur (1 × 2 = 2)
b) An urban settlement which consists of a main city
with surrounding dependent towns (1 × 2 = 2)
c) The increase in the number of people living in an urban
area (1 × 2 = 2)
d) A resource from the earth which cannot be
replenished. (1 × 2 = 2)
e) The economic sector which involves the accessing
and distribution of information. (1 × 2 = 2)](https://image.slidesharecdn.com/mindtheseriesstudyguidegeographygrade12-230512090758-7aa84044/85/MIND-THE-SERIES-STUDY-GUIDE-GEOGRAPHY-GRADE-12-pdf-94-320.jpg)
![© Department of Basic Education 2014
Mind the Gap CAPS Grade 12 Geography CHAPTER 3 RURAL SETTLEMENT AND URBAN SETTLEMENT 75
Chapter 3
4.2 Match the columns. Simply write the number of the term
in Column A next to the letter of the correct phrase from
Column B.
Column A Column B
a) Junction town
b) Zone of decay
c) Centrifugal forces
d) Intensive farming
e) Spatial development
initiatives
i) Plans to provide basic needs to all areas
ii) Farmland with a high carrying capacity
iii) Reasons why people leave a CBD or city
iv) Plans to improve the peripheral areas
v) An old area in the CBD
vi) A town formed where two rivers meet
vii)
An area around the CBD with mixed
functions
viii)
A town formed at a point where two major
transport routes meet
(5 × 2 = 10)
[20]
Answers to activity 3.7
Question 1
1.1 An individual farmstead on its own piece of land. 33(2)
1.2 All profit is your own 33/Make own decisions 33/
Make effective use of machinery 33/Less time wasted
travelling to work. 33 (any 2) (4)
1.3 Little social interaction 33/Less help in times of trouble 33/
No sharing of ideas. 33 (any 2) (4)
1.4 Primary activities refer to the extraction of raw material from
the Earth. The growing of grapes is a primary activity. 3333
Secondary activities refer to the manufacturing of raw material
into processed goods. Making wine from grapes is a secondary
activity. 3333
Tertiary activities refer to the provision of services and selling
of goods. Wine farms sell wine/have restaurants and wine
tasting which attracts tourists. 3333(12)
[22]
Question 2
2.1 A site is the exact piece of land a settlement is found on.33(2)
2.2 Available flat land 33/Natural harbour providing access to the
ocean33(4)
2.3 It has a harbour where the mode of transport changes, e.g from
land to sea. 33(2)
2.4 a) Central Business District33(2)
b) Gridiron street pattern33(2)
c) Advantage: Easy to find your way 33/Easy to extend 33/
Easy to subdivide33 (any 1)
Disadvantage: Causes traffic congestion 33/Monotonous
(boring) layout 33 (any 1) (4)](https://image.slidesharecdn.com/mindtheseriesstudyguidegeographygrade12-230512090758-7aa84044/85/MIND-THE-SERIES-STUDY-GUIDE-GEOGRAPHY-GRADE-12-pdf-95-320.jpg)
![© Department of Basic Education 2014
76 CHAPTER 3 RURAL SETTLEMENT AND URBAN SETTLEMENT Mind the Gap CAPS Grade 12 Geography
Chapter
3
Answers to activity 3.7 (continued)
d) Tall buildings/Skyscrapers33(2)
e) Land is in demand so price increases 33/Cheaper to
build upwards33 (any 1) (4)
2.5 All transport routes converge in the CBD. 33(2)
[24]
Question 3
3.1 a) Sea Point – high income 33; Malay Quarter – low income 33
(4)
b) Has sea view, which increases land value 33/On outskirts
city; residents can afford transport costs33 (any 1) (4)
3.2 a) Informal settlement (squatter settlement)33(2)
b) Migrants are uneducated so they cannot find a job33
They cannot afford rent or to buy a house33(4)
c) Family land not big enough to divide among children 33/
Traditional farming methods so low food output 33/
Inadequate services and facilities 33/Droughts and
floods have greater impact 33/Farm workers evicted 33/
Job losses due to increased mechanisation33 (any 2) (4)
d) High degree of unemployment 33/Social problems,
such as violence and crime, more common 33/
Increase in litter and pollution 33/Waterborne diseases
common 33/Increased spread of diseases33 (any 2) (4)
e) Need to speak to community and find out their needs 33/
Find out skills and talents in area 33/Need to set up industry
in area based on local skills or raw materials or products 33/
Improve farming methods of subsistence farmers 33/Possibly
change to commercial cash crops33/Small towns advertise
attractions in their town33/Find ways to attract tourists, for
example lodges, casinos, holiday resorts, etc. 33/ Develop
or market the town as a commuter or retirement town 33/
Petition government to maintain services and facilities 33
(any 6 facts; include points for both rural areas and towns) (12)
[34]
Question 4
4.1 a) Rural
b) Metropolis
c) Urban growth
d) Natural, non-renewable resource
e) Quaternary(10)
4.2 a) – viii)
b) – vii)
c) – iii)
d) – ii)
e) – iv) (10)
[20]
Keep going!](https://image.slidesharecdn.com/mindtheseriesstudyguidegeographygrade12-230512090758-7aa84044/85/MIND-THE-SERIES-STUDY-GUIDE-GEOGRAPHY-GRADE-12-pdf-96-320.jpg)
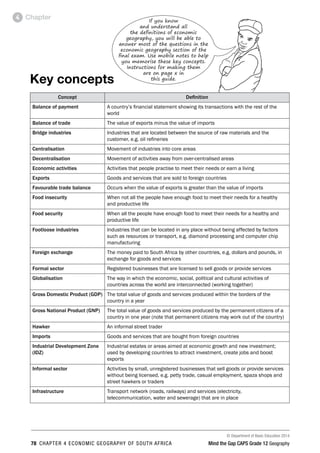
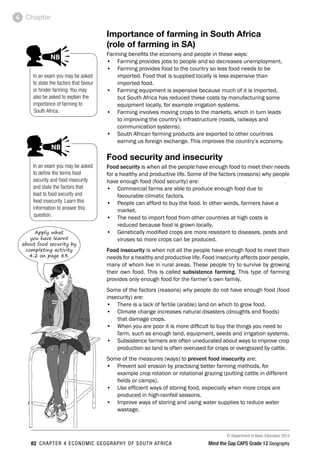
![© Department of Basic Education 2014
80 CHAPTER 4 ECONOMIC GEOGRAPHY OF SOUTH AFRICA Mind the Gap CAPS Grade 12 Geography
Chapter
4
Activity 4.1
Choose a term from Column B that matches a statement in Column A. Write
only the letter (A to F) next to the question number (1 to 5), for example
6 – G.
Column A Column B
1. Obtaining raw materials from the
earth
2. Total value of goods and services
produced by the permanent
citizens of a country in one year
3. Provision of services
4. Processing of raw materials
5. Value of all goods and services
produced in a country in one year
A. Gross domestic product
B. Tertiary activity
C. Gross national product
D. Primary activities
E. Economic activities
F. Secondary activities
[10]
Answers to activity 4.1
1 D (Primary activities) 33(2)
2 C (Gross National Product) 33(2)
3 B (Tertiary activities) 33(2)
4 F (Secondary activities) 33(2)
5 A (Gross Domestic Product) 33(2)
[10]
In the next section we focus on primary, secondary and tertiary economic
activities. These economic activities are important to the economy and
the country’s development, and are interdependent. Primary activities
stimulate secondary activities which, in turn, stimulate job creation in the
tertiary sector.
4.1 Primary economic
activities
Primary activities involve extracting (removing) raw materials from the
earth, for example farming, fishing, forestry and mining. We focus on
farming and mining as they are the two primary activities that contribute
the most to South Africa’s economy.](https://image.slidesharecdn.com/mindtheseriesstudyguidegeographygrade12-230512090758-7aa84044/85/MIND-THE-SERIES-STUDY-GUIDE-GEOGRAPHY-GRADE-12-pdf-100-320.jpg)
![© Department of Basic Education 2014
Mind the Gap CAPS Grade 12 Geography CHAPTER 4 ECONOMIC GEOGRAPHY OF SOUTH AFRICA 83
Chapter 4
Activity 4.2
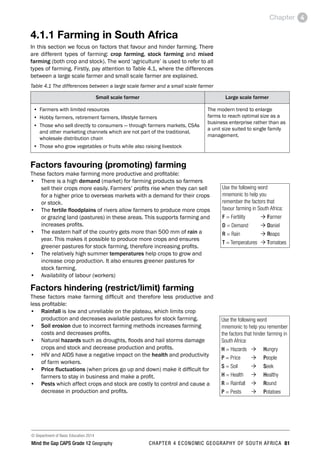
The cartoon in Figure 4.1.1 below shows how environmental problems can
affect food security.
Wake up, people! Many environmental problems threaten our food security...
Like overfishing...
And climate change...
We’ll all be
better off if we
limit our fishing
so that there will
be enough fish
for next year.
Unfortunately, they are not
going to like rising sea levels.
Each individual fisherman wants to
maximise his profit, but too much fishing
can destroy the fishery for everyone.
Out of the way, there’s
profit to be made!
I like cheap electricity! I like cheap fertilisers!
I like
cheap
petrol!
Figure 4.1.1: Factors contributing to food insecurity
1. How has the use of fossil fuels and fertilisers caused
climate change? (3 × 2 = 6)
2. How does climate change link to rising sea levels? (2 × 2 = 4)
3. How would rising sea levels affect food security? (1 × 2 = 2)
4. Explain your answer in question 3. (1 × 2 = 2)
5. Name another factor in the cartoon that would affect
food security. (1 × 2 = 2)
[16]
Answers to activity 4.2
1. Fossil fuels and fertilisers release greenhouse gases like
carbon dioxide and methane into the air. 33 These gases
trap heat in the atmosphere. 33 This increases the Earth’s
temperature, which leads to changes in Earth’s climate and
weather. 33(6)
2. The increase in the Earth’s temperature causes the polar
icecaps to melt. 33 This leads to increasing sea levels. 33(4)
3. It would decrease food security/cause food insecurity. 33(2)
4. Land would be flooded, so there is less land to use for
agriculture or food production. 33(2)
5. Overfishing33(2)
[16]](https://image.slidesharecdn.com/mindtheseriesstudyguidegeographygrade12-230512090758-7aa84044/85/MIND-THE-SERIES-STUDY-GUIDE-GEOGRAPHY-GRADE-12-pdf-103-320.jpg)
![© Department of Basic Education 2014
Mind the Gap CAPS Grade 12 Geography CHAPTER 4 ECONOMIC GEOGRAPHY OF SOUTH AFRICA 89
Chapter 4
Activity 4.3
Choose a term from the box that matches the descriptions that follow.
heavy industries; footloose industries; market-orientated industries; centralisation;
decentralisation; Durban–Pinetown; Gauteng/Pretoria–Witwatersrand–Vereeniging
1. Over-concentration of industries in a few core areas
2. The largest industrial core area in South Africa
3. Industries that can locate anywhere due to improved technology
4. Industries that must be close to the consumers
5. These industries are associated with high noise and air pollution
(5 × 2 = 10)
Answers to activity 4.3
1. Centralisation 33(2)
2. Gauteng/Pretoria–Witwatersrand–Vereeniging 33(2)
3. Footloose industries 33(2)
4. Market-orientated industries 33(2)
5. Heavy industries 33(2)
[10]
Strategies for industrial development
As part of the development plan for underdeveloped regions, the South
African Government (Department of Trade and industry in partnership with the
Department of Transport) introduced TWO development plans:
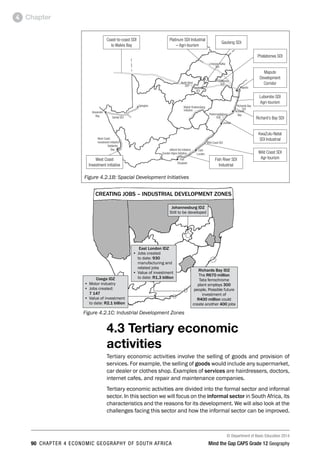
• Spatial Development Initiative (SDI)
• Industrial Development Zones (IDZ)
Spatial Development Initiative Industrial Development Zones
• Is a development corridor, that is,
development along a major transport
route, for example, a major highway.
• Connects major industrial or mining
areas.
• Government improves infrastructure
all along the development corridor to
stimulate development and access to
areas along the route.
• Small towns and activities such as
farming and tourism are developed
along the route.
• Usually close to harbours or airports
• Include already existing factories in
a town
• Government plans upgrade of
infrastructure and services to attract
further development
• IDZs are linked to each other or
other major cities by SDIs
Table 4.3
Apply what you
have learnt about
secondary industries
by completing
activity 4.3.](https://image.slidesharecdn.com/mindtheseriesstudyguidegeographygrade12-230512090758-7aa84044/85/MIND-THE-SERIES-STUDY-GUIDE-GEOGRAPHY-GRADE-12-pdf-109-320.jpg)
![© Department of Basic Education 2014
92 CHAPTER 4 ECONOMIC GEOGRAPHY OF SOUTH AFRICA Mind the Gap CAPS Grade 12 Geography
Chapter
4
• Local authorities can provide training to teach people the necessary
skills to develop their businesses.
4.4 Quaternary economic
activities
Quaternary economic activities deal with communication, technology and
research. Examples of quaternary activities are new product development,
medical research, customer surveys and market research, call centres,
facebook, Google and other information age businesses.
Activity 4.4
Choose a description from Column B that matches a term in Column A.
Write only the letter (A-L) next to the question number (1-10), e.g. 11.L
Column A Column B
1. Trade
2. Import
3. Decentralisation
4. Trading blocs
5. Industrial
Development
Zones
6. Informal sector
7. MEDCs
8. Multinational
corporation
9. LEDCs
10. Globalisation
A. Groups of countries that have common markets or
trade agreements
B. Industrial estates aimed at economic growth and
new investment
C. Buying and selling of goods and services
D. Movement of activities away from over- centralised
areas
E. Commodity brought into a country
F. Movement of industries into core areas
G. The way in which activities of countries across the
world are interconnected
H. Countries that are less developed in the world
I. The trade involving businesses not registered with
the government and occupying premises illegally
J. Company that has factories, offices or shops in
different countries
K. Countries that are more developed than others
L. Value added to raw materials
(10 × 2 = 20)
Answers to activity 4.4
1. C 33
2. E 33
3. D 33
4. A 33
5. B 33
6. I 33
7. K 33
8. J 33
9. H 33
10. G 33 (10 × 2 = 20)
[20]](https://image.slidesharecdn.com/mindtheseriesstudyguidegeographygrade12-230512090758-7aa84044/85/MIND-THE-SERIES-STUDY-GUIDE-GEOGRAPHY-GRADE-12-pdf-112-320.jpg)
![© Department of Basic Education 2014
Mind the Gap CAPS Grade 12 Geography CHAPTER 4 ECONOMIC GEOGRAPHY OF SOUTH AFRICA 95
Chapter 4
Activity 4.5
The following questions refer to the graph in Figure 4.5.1A on page 94.
1. What do the letters GDP stand for? (1 × 2 = 2)
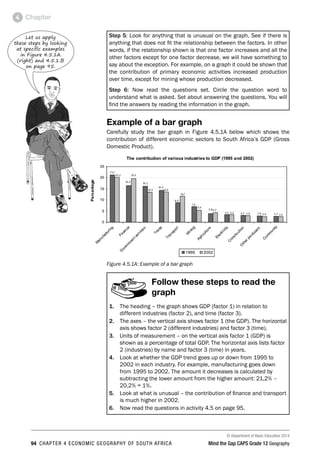
2. Which industry contributes the most to the GDP? (1 × 2 = 2)
3. To what economic activity does mining and agriculture
belong to? (1 × 2 = 2)
4. Mining and agriculture contribute less to the GDP than
manufacturing, which is a secondary activity. Explain the
reason for this observation. (2 × 2 = 4)
5. The contribution of transport to the GDP increased
from 1995 to 2002. Give a possible reason for this. (1 × 2 = 2)
[12]
Answers to activity 4.5
1. Gross domestic product. 33(2)
2. Manufacturing 33(2)
3. Primary 33(2)
4. Mining and agriculture produce raw materials which are sold for
less money than processed goods sold by manufacturing
industries. 33(2)
5. Increased government spending on infrastructure
development 33/ Increased use of public transport generating
more revenue for the state. More purchases and use of private
vehicles. 33(2)
[12]
Example of a pie chart
Carefully study the pie chart or pie graph below (Figure 4.5.1B) illustrating
the contribution of different provinces to the national GDP.
Western Cape 14.4%
North West 6.3%
Northern Cape 2.2%
Mpumalanga 6.8%
Limpopo 6.7%
Eastern Cape 8.1%
Free State 5.5%
Gauteng 33.3%
KwaZulu-Natal 16.7%
Figure 4.5.1: Contribution of different provinces to the national GDP](https://image.slidesharecdn.com/mindtheseriesstudyguidegeographygrade12-230512090758-7aa84044/85/MIND-THE-SERIES-STUDY-GUIDE-GEOGRAPHY-GRADE-12-pdf-115-320.jpg)
![© Department of Basic Education 2014
96 CHAPTER 4 ECONOMIC GEOGRAPHY OF SOUTH AFRICA Mind the Gap CAPS Grade 12 Geography
Chapter
4
Follow the steps to read
the graph
1. The heading – the graph shows GDP (factor 1) in relation to
different provinces (factor 2).
2. The sectors (pieces or slices) of the pie graph show factor 1 – the
contribution of each province to the GDP.
3. Units of measurement – the sectors of the pie graph show factor 1
(GDP) in percentage.
4. The relationship between the different factors – because a pie
chart compares parts of a whole, you need to note the different
sizes of the sectors. This tells you how much each province
contributes to the total GDP.
5. Look for anything that is unusual – for example, which is the
largest piece of the pie (Gauteng) and which is the smallest piece
of the pie (Northern Cape).
6. Now read the questions in activity 4.6.
Activity 4.6
The following questions refer to Figure 4.5.1B on page 95.
1. Rank the top three provinces in terms of their contribution
to the GDP from largest to smallest contribution. (1 × 2 = 2)
2. Give two reasons why the province ranked first in your
answer in question 1 holds that position. (2 × 2 = 4)
3. The following questions refer to the province which
contributes the least to the national GDP.
a) Name the province which contributes the least to the
national GDP. (1 × 2 = 2)
b) Name the ocean current that flows alongside this
province. (1 × 2 = 2)
c) What impact does this ocean current have on the
rainfall in this province? (1 × 2 = 2)
d) Explain how your answer in question c) affects the
province’s contribution to the GDP. (2 × 2 = 4)
[16]](https://image.slidesharecdn.com/mindtheseriesstudyguidegeographygrade12-230512090758-7aa84044/85/MIND-THE-SERIES-STUDY-GUIDE-GEOGRAPHY-GRADE-12-pdf-116-320.jpg)
![© Department of Basic Education 2014
Mind the Gap CAPS Grade 12 Geography CHAPTER 4 ECONOMIC GEOGRAPHY OF SOUTH AFRICA 97
Chapter 4
Answers to activity 4.6
1. Gauteng, KwaZulu-Natal, Western Cape 33(2)
2. Gauteng has the most industries 33/many tertiary activities 33/
a large population which creates large market 33/many
companies have main branches or headquarters there 33.
(any 2) (4)
3. a) Northern Cape 33(2)
b) Benguela 33(2)
c) Decreases rainfall 33(2)
d) Less rainfall lowers productivity on farms so less produce to
sell 33/Less rainfall causes poor water supply which limits
industrial development. 33(4)
[16]
4.5.2 Understanding tables
In this section we look at how to read and understand the information in a
table. Follow these steps when you read a table:
Steps to read a table
Step 1: Look at the heading for the table to see what is shown
Step 2: Look at the labels in the different columns
Step 3: Look at the relationship between what is compared
Step 4: Now read the questions
Carefully study Table 4.4 below and then follow the steps to read the table.
South Africa's mineral production and relative ranking in the world
Mineral
SA’s percentage of
world production
World position
Asbestos 6 4
Chromium 76 1
Coal 11 4
Diamonds 24 2
Iron 7 5
Manganese 78 1
Platinum group 79 1
Table 4.4](https://image.slidesharecdn.com/mindtheseriesstudyguidegeographygrade12-230512090758-7aa84044/85/MIND-THE-SERIES-STUDY-GUIDE-GEOGRAPHY-GRADE-12-pdf-117-320.jpg)
![© Department of Basic Education 2014
98 CHAPTER 4 ECONOMIC GEOGRAPHY OF SOUTH AFRICA Mind the Gap CAPS Grade 12 Geography
Chapter
4
Steps
1. The heading – the table shows which minerals (factor 1)
South Africa produces, how much we produce (factor 2), and
where we are ranked in the world of production (factor 3).
2. The first column lists factor 1 (minerals), the second column
shows factor 2 (percentage of world production), and the
third column shows factor 3 (the country’s ranking in world
production).
3. What mineral do we produce most of (Platinum) and where are
we ranked in the world for manganese (first)? For how many
minerals do we rank in first or second place? (three – chromium,
manganese and platinum group)
4. Now read the questions in activity 4.7.
Activity 4.7
The following questions refer to Table 4.4 on page 97.
1. What economic activity does the extraction of minerals
fall into? (1 × 2 = 2)
2. a)
South Africa is a major mineral producer in the world.
State three factors that favour mining in South Africa. (3 × 2 = 6)
b) State the two reasons why mining is important to
South Africa. (2 × 2 = 4)
3. What major mineral mined in South Africa is not listed in
table 4.4? (1 × 2 = 2)
4. The price for platinum increased dramatically, but has now
decreased again. What problem does this price fluctuation
cause for the platinum mines? (2 × 2 = 4)
[18]](https://image.slidesharecdn.com/mindtheseriesstudyguidegeographygrade12-230512090758-7aa84044/85/MIND-THE-SERIES-STUDY-GUIDE-GEOGRAPHY-GRADE-12-pdf-118-320.jpg)
![© Department of Basic Education 2014
Mind the Gap CAPS Grade 12 Geography CHAPTER 4 ECONOMIC GEOGRAPHY OF SOUTH AFRICA 99
Chapter 4
Answers to activity 4.7
1. Primary33(2)
2. a)
The country has many different minerals 33/It has lots of
local unskilled labour 33/It has access to many foreign
skilled miners 33/Many countries invested money in our
mines 33/The country has a well-developed infrastructure
(roads and railway lines, water and electricity). 33 (any 3) (6)
b) Mines provide employment to many South Africans 33/
Mines supply raw materials to factories 33/When mines
start up, new towns and transport networks develop 33/
Other economic activities, such as farming and trade,
increase to meet the needs of the new mining towns 33/
Harbours grow bigger 33/Export of mining products
increases the profits of the mines. (any 2) (4)
3. Gold33(2)
4. It will cause productivity to increase and decrease. 33
As productivity decreases, costs increase and profits fall. 33
It will cause the mine’s profits to increase and decrease. 33
As profits decrease, mine workers may lose their jobs. 33
(any 2 facts; or any other logical answer) (4)
[18]
Keep going!](https://image.slidesharecdn.com/mindtheseriesstudyguidegeographygrade12-230512090758-7aa84044/85/MIND-THE-SERIES-STUDY-GUIDE-GEOGRAPHY-GRADE-12-pdf-119-320.jpg)
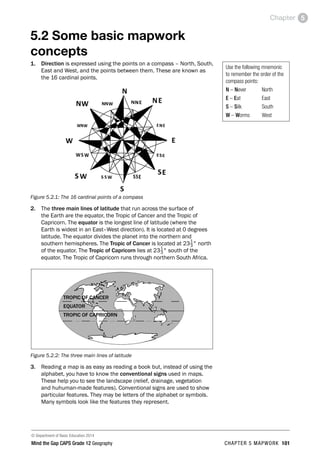
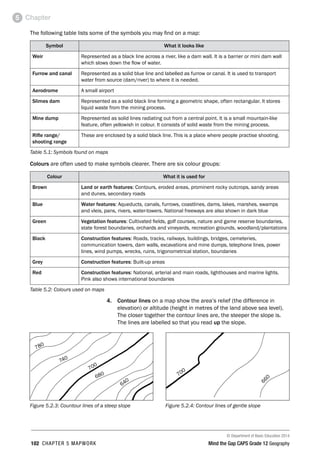
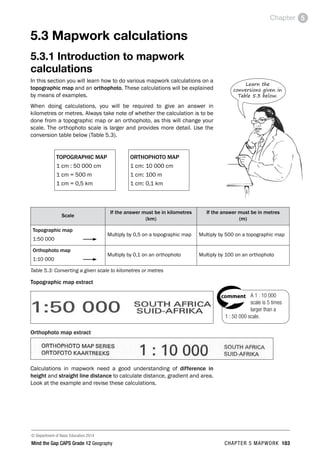
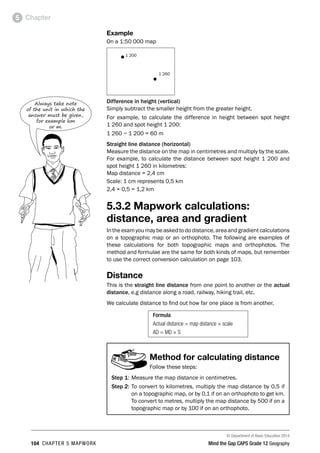
![© Department of Basic Education 2014
Mind the Gap CAPS Grade 12 Geography CHAPTER 5 MAPWORK 105
Chapter 5
If the exam
question asks for “the
distance along a road”
then you would measure
the line as if you were
walking on it.
ACTIVITIES boy
and girl-left and
right of page
Step by step comment
EG - worked examples
HINT!
e.g.
hint
activity
activity
comment
exams
Worked example 1 – straight line
distance
Calculate the distance from point A to point B.
Topographic map calculation:
A
1: 50 000
B
Map distance: 4,6 cm
Scale: 1 cm represents 0,5 km
Distance: 4,6 cm × 0,5 = 2,3 km
Orthophoto calculation:
A
1: 10 000
B
Map distance: 4,6 cm
Scale: 1 cm represents 0,1 km
Distance: 4,6 cm × 0,1 = 0,46 km
PAY SPECIAL ATTENTION
ACTIVITIES boy
and girl-left and
right of page
Step by step comment
EG - worked examples
HINT!
e.g.
NB NB
hint
activity
activity
comment
exams
Worked example 2 – actual distance
Calculate the distance along the road from point A to point B.
Topographic map calculation:
A
1: 50 000
B
Map distance: 3 cm
Scale: 1 cm represents 0,5 km
Distance: 3 cm × 0,5 = 1,5 km
Orthophoto calculation:
A
1: 10 000
B
Map distance: 3 cm
Scale: 1 cm represents 0,1 km
Distance: 3 cm × 0,1 = 0,3 km
Activity 5.1
Calculate the following distances which are shown on a topographic map.
•120
r 5
1. Calculate the distance from trig. station 5 to spot height 120
in metres. (3)
2. Calculate the distance along the powerline in kilometres. (3)
[6]](https://image.slidesharecdn.com/mindtheseriesstudyguidegeographygrade12-230512090758-7aa84044/85/MIND-THE-SERIES-STUDY-GUIDE-GEOGRAPHY-GRADE-12-pdf-125-320.jpg)
![© Department of Basic Education 2014
106 CHAPTER 5 MAPWORK Mind the Gap CAPS Grade 12 Geography
Chapter
5
Answers to activity 5.1
1. Distance = 4,4 cm3 × 5003 = 2 200 m3(3)
2. Distance = 6,8 cm 3× 0,53 = 3,4 km3 (3)
[6]
Activity 5.2
Calculate the following distances which are shown on an orthophoto.
■
P
1. Calculate the distance from the post office to the dipping tank in
metres.(3)
2. Calculate the distance along the track in kilometres. (3)
[6]
Answers to activity 5.2
1. Distance = 6,6 cm3 × 1003 = 660 m3(3)
2. Distance = 5,4 cm3 × 0,13 =0,54 km3(3)
[6]
Area
Area is the amount of surface a two-dimensional shape covers. (A two-
dimensional shape has length and breadth.)
We calculate area to find out how much land is covered (e.g. by a maize
field) or how much space we have to build on.
Formula for area
Area = Length × Breadth
A = L × B
Method for calculating area
Follow these steps:
Step 1: Measure the length in cm and convert to km or m.
Step 2: Measure the breadth in cm and convert to km or m.
Step 3: Apply the formula A = L × B.
Step 4:
Write the answer in kilometres squared (km²) or metres
squared (m²).](https://image.slidesharecdn.com/mindtheseriesstudyguidegeographygrade12-230512090758-7aa84044/85/MIND-THE-SERIES-STUDY-GUIDE-GEOGRAPHY-GRADE-12-pdf-126-320.jpg)
![© Department of Basic Education 2014
Mind the Gap CAPS Grade 12 Geography CHAPTER 5 MAPWORK 107
Chapter 5
ACTIVITIES boy
and girl-left and
right of page
Step by step comment
EG - worked examples
HINT!
e.g.
hint
activity
activity
comment
exams
Worked example
Topographic map calculation: Orthophoto calculation:
Length
4,4 cm
3,6 cm Breadth
1: 50 000
Answer in km²
A = L × B
L: 4,4 cm × 0,5 = 2,2 km
B: 3,6 cm × 0,5 = 1,8 km
A: 2,2 × 1,8 = 3,96 km²
Answer in m²
A = L × B
L: 4,4 cm × 500 = 2 200 m
B: 3,6 cm × 500 = 1 800 m
A: 2 200 × 1 800 = 39 600 m²
Length
4,4 cm
3,6 cm
Breadth
1: 10 000
Answer in km2
A = L × B
L: 4,4 cm × 0,1 = 0,44 km
B: 3,6 cm × 0,1 = 0,36 km
A: 0,44 × 0,36 = 0,1584 km²
Answer in m2
A = L × B
L: 4,4 cm × 100 = 440 m
B: 3,6 cm × 100 = 360 m
A: 440 × 360 = 158 400 m²
Activity 5.3
1. The block below is shown on a topographic map. Calculate the area
of the block in metres squared. (5)
2. The block below is shown on a topographic map. Calculate the area
of the block in kilometres squared. (5)
[10]
Always write
the formula A = L × B.
It’s an easy mark.](https://image.slidesharecdn.com/mindtheseriesstudyguidegeographygrade12-230512090758-7aa84044/85/MIND-THE-SERIES-STUDY-GUIDE-GEOGRAPHY-GRADE-12-pdf-127-320.jpg)
![© Department of Basic Education 2014
108 CHAPTER 5 MAPWORK Mind the Gap CAPS Grade 12 Geography
Chapter
5
Answers to activity 5.3
1. A = L × B3
L: 3,7 cm × 500 = 1 850 m3
B: 1,1 cm × 500 = 550 m3
A: 1 850 × 550 = 1 017 500 m²33(5)
2. A = L × B3
L: 4,4 cm × 0,5 = 2,2 km3
B: 2,3 cm × 0,5 = 1,15 km3
A: 2,2 × 1,15 = 2,53 km²33(5)
[10]
Activity 5.4
1. The block below is shown on an orthophoto. Calculate the area of the
block in metres squared. (5)
2. The block below is shown on an orthophoto. Calculate the area of the
block in kilometres squared. (5)
[10]
Answers to activity 5.4
1. A = L × B3
L: 4,4 cm × 100 = 440 m3
B: 1,1 cm × 100 = 110 m3
A: 440 × 110 = 48 400 m²33(5)
2. A = L × B3
L: 1,1 cm × 0,1 = 0,11 km3
B: 1,1 cm × 0,1 = 0,11 km3
A: 0,11 × 0,11 = 0,0121 km²33(5)
[10]](https://image.slidesharecdn.com/mindtheseriesstudyguidegeographygrade12-230512090758-7aa84044/85/MIND-THE-SERIES-STUDY-GUIDE-GEOGRAPHY-GRADE-12-pdf-128-320.jpg)
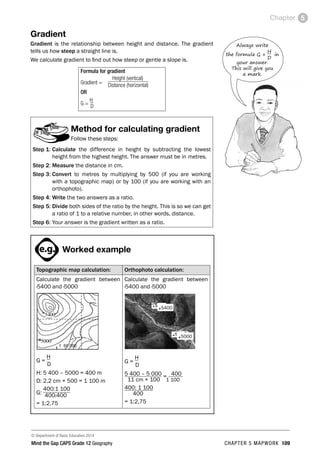
![© Department of Basic Education 2014
110 CHAPTER 5 MAPWORK Mind the Gap CAPS Grade 12 Geography
Chapter
5
Activity 5.5
Calculate the gradient from trig. station 8 to spot height 1120, which are
shown on a topographic map.
• 1120
r
8
980
[5]
Answer to activity 5.5
G =
H 3
D
H: 1 120 − 980 = 140 m3
D: 4,4 cm × 500 = 2 200 m3
G:
140 : 2 200 3
140 140
= 1:15,713
[5]
Activity 5.6
Calculate the gradient from trig. station 8 to spot height 213, which are
shown on an orthophoto. [5]
• 213
r
8
121
Note that 8 is
the number of the
trig. station. The
height is written below
the triangle, i.e. it
is 980.](https://image.slidesharecdn.com/mindtheseriesstudyguidegeographygrade12-230512090758-7aa84044/85/MIND-THE-SERIES-STUDY-GUIDE-GEOGRAPHY-GRADE-12-pdf-130-320.jpg)
![© Department of Basic Education 2014
Mind the Gap CAPS Grade 12 Geography CHAPTER 5 MAPWORK 111
Chapter 5
Answer to activity 5.6
G =
H 3
D
H: 213 − 121 = 92 m 3
D: 4,4 cm × 100 = 440 m3
G:
92 : 440 3
92 92
= 1:4,783
[5]
5.3.3 Mapwork calculations: True
bearing, magnetic declination,
magnetic bearing, position,
map sheet reference, vertical
exaggeration
Note that true bearing, magnetic declination, magnetic bearing and
position, and map sheet reference calculations can only be done on a
topographic map. Vertical exaggeration calculations can be done on both
a topographic map and an orthophoto.
True bearing
True bearing is the angle measured clockwise from true north (0°).
We calculate true bearing, magnetic declination and magnetic bearing
to help us determine in which direction we are going or to help us find
our way.
Method for measuring the true
bearing from A to B
Follow these steps:
Step 1: Draw a straight line joining A and B.
Step 2: Draw a north line through A (the point of measurement).
Step 3: Place the 0 of your protractor at the top of the north line.
Step 4:
Moving in a clockwise direction from 0, read off where the line
joining A and B touches the protractor.
The true bearing from A to
B is 138°. (In the exam, a
degree either way will be
accepted, i.e. the answer can
be 137° to 139°.)
PAY SPECIAL ATTENTION
EG - worked examples
HINT!
e.g.
NB
hint
activity
exams](https://image.slidesharecdn.com/mindtheseriesstudyguidegeographygrade12-230512090758-7aa84044/85/MIND-THE-SERIES-STUDY-GUIDE-GEOGRAPHY-GRADE-12-pdf-131-320.jpg)
![© Department of Basic Education 2014
112 CHAPTER 5 MAPWORK Mind the Gap CAPS Grade 12 Geography
Chapter
5
A
B
TN
Activity 5.7
•110
r
8
1. Calculate the true bearing from trig. station 8 to spot
height 110. (2)
2. Calculate the true bearing of trig. station 8 from spot
height 110. (2)
[4]
Answers to activity 5.7
1. 58° (57°– 59°)33(2)
2. 238° (237°– 239°) 33(2)
[4]
Magnetic declination
Magnetic declination is the angle between true north and magnetic north.
This angle is calculated when the map is drawn, but the position of magnetic
north changes, so the angle between true north and magnetic north (the
magnetic declination) will also change. You will need to calculate what the
magnetic declination is for the current year.
You will find the magnetic declination for the year the map was drawn
on the map. This information appears on a map on the left-hand side or
at the bottom of the map. You need this information to do the magnetic
declination calculation. Look at the following example:
Always remember
to move to the right
(clockwise).](https://image.slidesharecdn.com/mindtheseriesstudyguidegeographygrade12-230512090758-7aa84044/85/MIND-THE-SERIES-STUDY-GUIDE-GEOGRAPHY-GRADE-12-pdf-132-320.jpg)
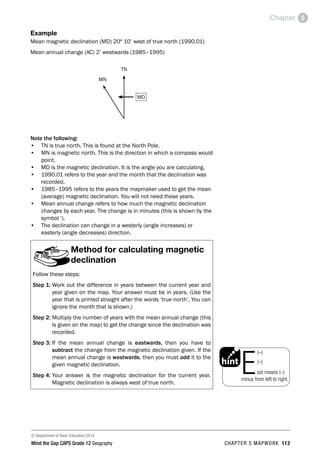
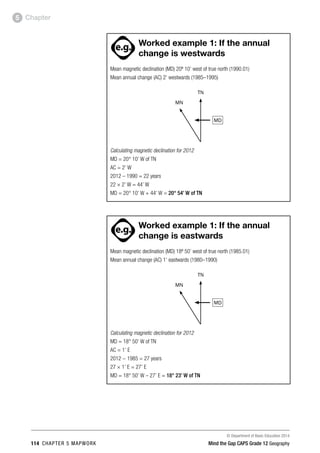
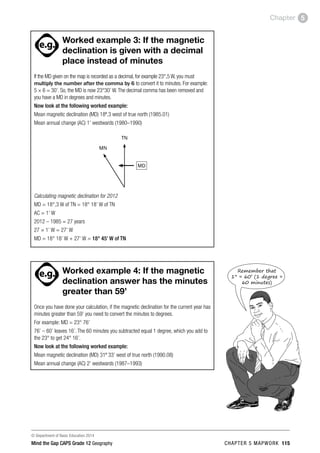
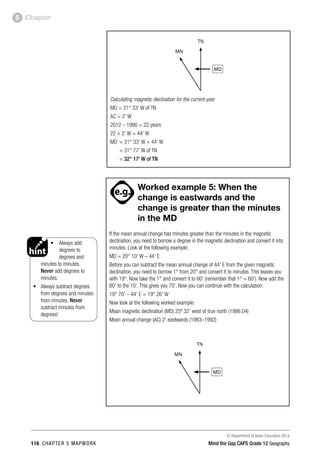
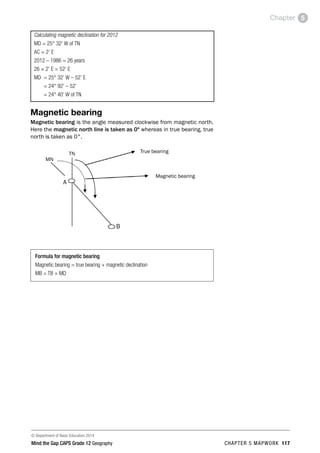
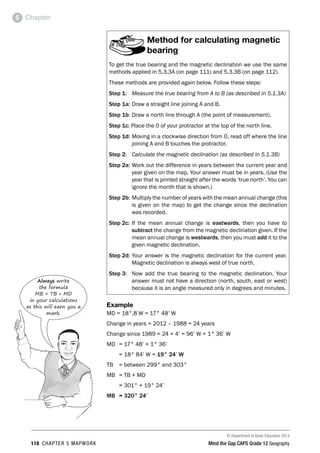
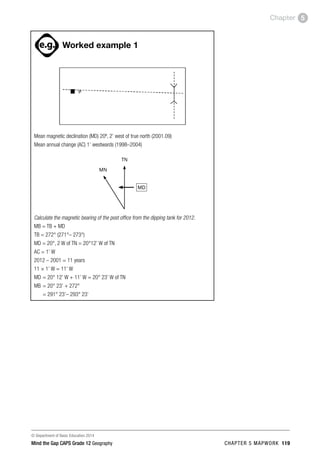
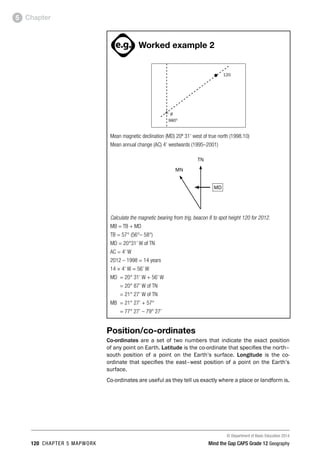
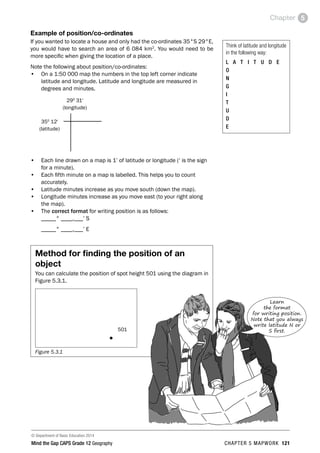
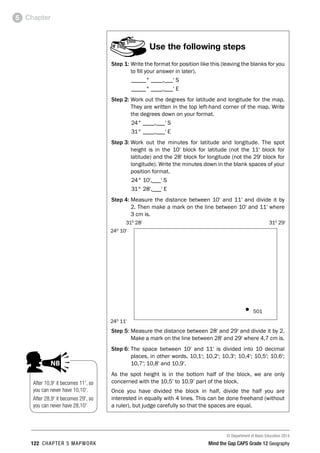
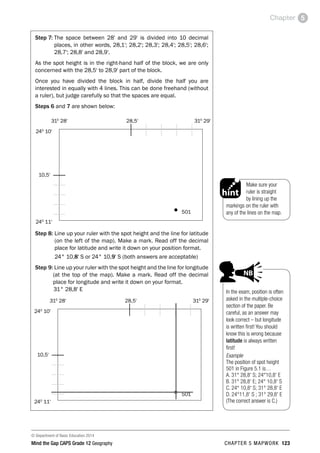
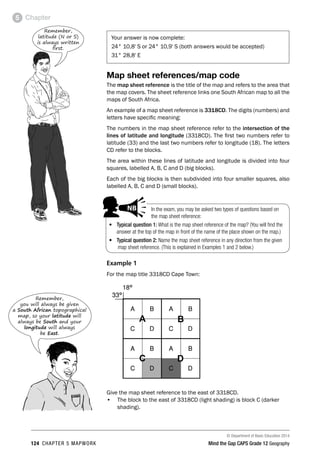
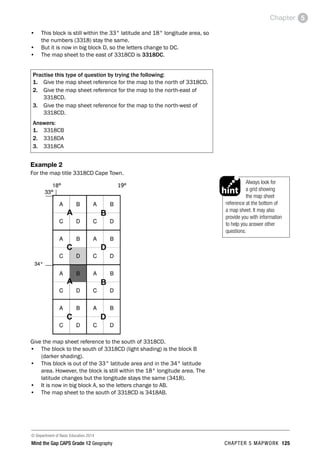
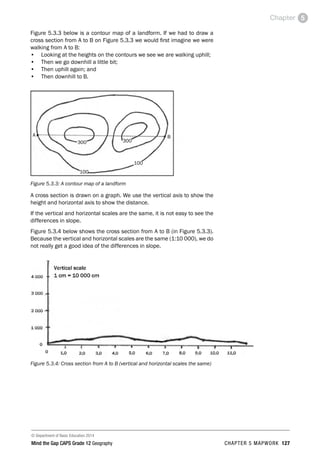
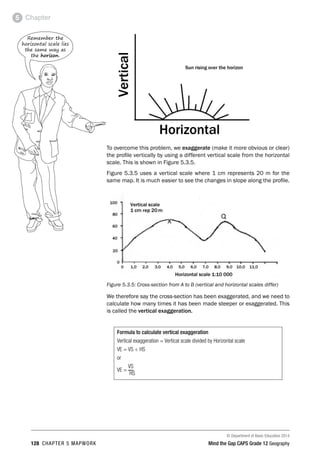
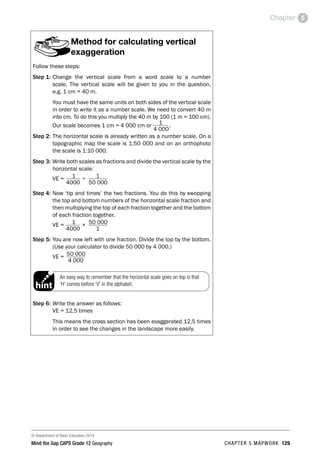
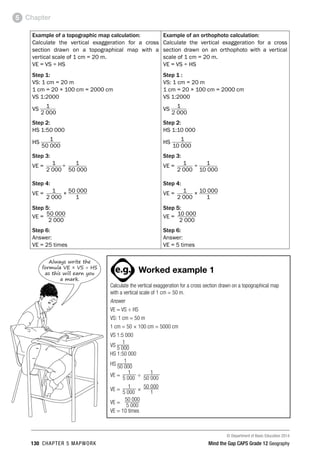
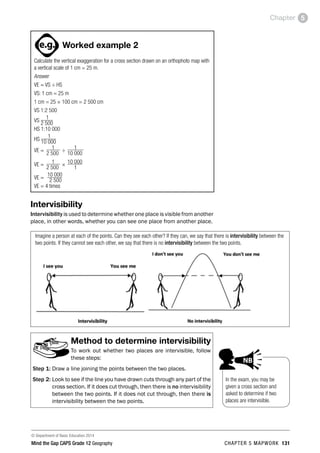
![© Department of Basic Education 2014
132 CHAPTER 5 MAPWORK Mind the Gap CAPS Grade 12 Geography
Chapter
5
Example 1
In Figure 5.3.6 below, is point Q intervisible from point P?
Vertical scale
1 cm = 20 m
Horizontal scale 1:10 000
Figure 5.3.6: Determining intervisibility between points P and Q
The answer is that there is no intervisibility between P and Q, as the
line cuts through the cross-section (goes through the mountain). This
means you cannot see point Q from point P, and you cannot see point P
from point Q.
Example 2
In Figure 5.3.7 below, is point X intervisible from point Q?
Vertical scale
1 cm = 20 m
Horizontal scale 1:10 000
Figure 5.3.7: Determining intervisibility between points X and Q
The answer is there is intervisibility between X and Q, as the line does not
cut through the cross-section. This means you can see point X from point
Q, and you can see point Q from point X.
Activity 5.8
Refer to the topographical map and orthophoto of Nelspruit at the back of
this study guide to answer the following questions:
1. Calculate the area covered by block B3 on the Nelspruit
topographical map in kilometres squared. (5)
2. Calculate the magnetic bearing for 2012 from trig. beacon
101 (C3) to spot height 676 (C4) on the topographical map.
Show all steps followed (calculations). Marks will be allocated
for calculations. (10)
3. Calculate the gradient between trig. beacon 101 in block C3
and spot height 676 in block C4. (5)
[20]
Check how
well you can do
mapwork calculations
by completing
activity 5.8.](https://image.slidesharecdn.com/mindtheseriesstudyguidegeographygrade12-230512090758-7aa84044/85/MIND-THE-SERIES-STUDY-GUIDE-GEOGRAPHY-GRADE-12-pdf-152-320.jpg)
![© Department of Basic Education 2014
Mind the Gap CAPS Grade 12 Geography CHAPTER 5 MAPWORK 133
Chapter 5
Answers to activity 5.8
1. Area = length × breadth3
= (3,7 cm × 0,5) km3 × (3,3 cm × 0,5) km3
= 1,85 km × 1,65 km3
= 3,05 km2
3(5)
2. Magnetic declination: 15°02' west of true north
Annual change: 03' E3
Number of years: 2012 – 1986 = 26 years3
26 × 3' = 78' E3 = 1° 18' E3
Magnetic declination: =15°02' W – 1°18' E3
= 14° 62' W – 1° 18' E3
= 13°44' W3
Magnetic bearing = True bearing + Magnetic declination3
= 102° + 13° 44' W3
= 115° 44'3(10)
3. Gradient = Height = H 3
Distance D
H = 754,4 – 676 = 78,4 m3
D = 5,6 cm × 500 = 2 800 m3
G = 78,4 : 2 800 3
78,4 78,4
G = 1:35,73(5)
[20]
5.4 Application of theory to
a topographic map and an
orthophoto
In this section we look at how the theory that you have learnt in previous
chapters can be applied to a topographic map or an orthophoto.
5.4.1 Climatology
In the exam, you may be asked questions such as:
1. Which slopes are the warmest?
Determine which slope faces north. North-facing slopes are the warmest.
PAY SPECIAL ATTENTION
EG - worked examples
HINT!
e.g.
NB NB
hint
exams
2. Which slopes are the coldest?
Determine which slope faces south. South-facing slopes are the coldest.
PAY SPECIAL ATTENTION
EG - worked examples
HINT!
e.g.
NB NB
hint](https://image.slidesharecdn.com/mindtheseriesstudyguidegeographygrade12-230512090758-7aa84044/85/MIND-THE-SERIES-STUDY-GUIDE-GEOGRAPHY-GRADE-12-pdf-153-320.jpg)
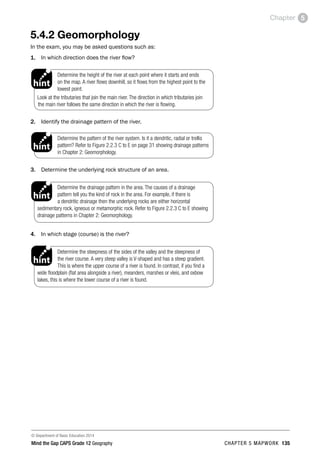
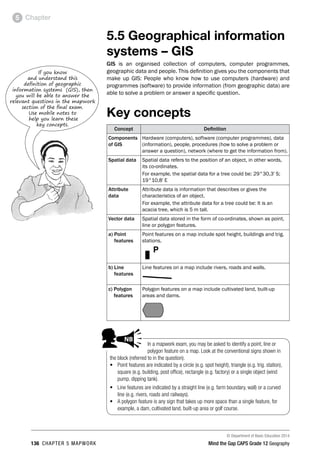
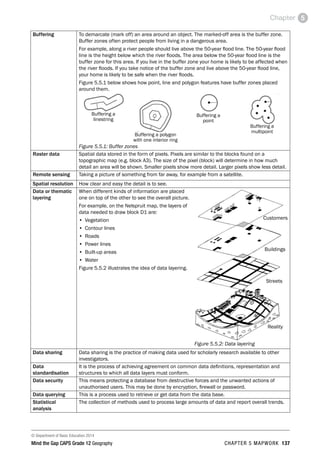
![© Department of Basic Education 2014
138 CHAPTER 5 MAPWORK Mind the Gap CAPS Grade 12 Geography
Chapter
5
Activity 5.9
Refer to the topographic map 2530BD Nelspruit and the orthophoto map
extract at the back of this study guide to answer the following questions.
1. Underline the correct term that matches the description below:
a) Data that refers to the actual position of an object is
vector/raster data. (1 × 2 = 2)
b) Data that is stored in pixels is vector/raster data. (1 × 2 = 2)
2. Refer to block B1 on the 2530BD Nelspruit topographic
map. Give an example from this block of the following:
a) Point feature (1 × 2 = 2)
b) Line feature (1 × 2 = 2)
c) Polygon feature (1 × 2 = 2)
3. List any four layers that were used to draw this
topographic map. (4 × 2 = 8)
[18]
Answers to activity 5.9
1. a) Data that refers to the actual position of an object is vector3/
raster data. (2)
b) Data that is stored in pixels is vector/raster3 data. (2)
2. a) Point feature: spot height3/farmstead3/tree3 (any 1) (2)
b) Line feature: contour3/power line3/track or hiking trail3/
road3/dam wall3/river (perennial or non- perennial)3/
furrow3 (any 1) (2)
c) Polygon feature: woodland3/cultivated land3/orchards3/
excavations3 (any 1) (2)
3. The following layers were used to draw the topographic map:
• Woodland – all the farming land and woodland areas33
• Height – the brown contour lines33
• Water – all the rivers and the perennial water and furrows33
• Transport – roads and track/hiking trail33(8)
[18]
Now that
you have studied the
concepts that relate
to GIS, you can do the
following activity.
You are
there, well
done!](https://image.slidesharecdn.com/mindtheseriesstudyguidegeographygrade12-230512090758-7aa84044/85/MIND-THE-SERIES-STUDY-GUIDE-GEOGRAPHY-GRADE-12-pdf-158-320.jpg)
![Appendix
© Department of Basic Education 2014
142 APPENDIX 1 Mind the Gap CAPS Grade 12 Geography
Geography/P1
5
DBE/2014
NSC
–
Grade
12
Exemplar
Copyright
reserved
Please
turn
over
1.6
Read
the
case
study
on
the
Umgeni
River
in
FIGURE
1.6.
1.6.1
Name
the
human
activity
that
is
polluting
the
Umgeni
River.
(1
x
1)
(1)
1.6.2
What
evidence
suggests
that
the
Umgeni
River
is
dirty?
(1
x
2)
(2)
1.6.3
State
the
negative
impact
of
the
dirty
water
on
the
quality
of
life
of
people
living
in
the
area.
(2
x
2)
(4)
1.6.4
Suggest
strategies
that
could
be
put
in
place
to
reduce
the
negative
impact
of
humans
on
the
Umgeni
River.
(4
x
2)
(8)
[75]
QUESTION
2
2.1
Refer
to
FIGURE
2.1
showing
two
pressure
cells
in
the
Southern
Hemisphere.
Indicate
whether
the
descriptions
below
refer
to
pressure
cell
A
or
B.
Write
only
the
answer
next
to
the
question
number
(2.1.1–2.1.8)
in
the
ANSWER
BOOK.
You
may
use
the
same
answer
more
than
once.
2.1.1
2.1.2
2.1.3
2.1.4
2.1.5
2.1.6
2.1.7
2.1.8
An
example
of
a
high-pressure
cell
Air
converges
into
the
pressure
cell
This
pressure
cell
dominates
the
land
in
winter
over
South
Africa
Air
diverges
from
this
cell
Associated
with
clear
skies
and
stable
weather
Also
known
as
a
cyclone
Associated
with
warm,
rising
air
Associated
with
the
Tropical
Pressure
Belt
(8
x
1)
(8)
2.2
Refer
to
FIGURE
2.2
showing
fluvial
landforms
and
answer
the
questions
that
follow.
2.2.1
Name
the
outer
bank
of
the
river
labelled
A.
(1
x
1)
(1)
2.2.2
Does
the
inner
bank
(B)
of
a
river
experience
more
EROSION
or
more
DEPOSITION?
(1
x
1)
(1)
2.2.3
Name
the
fluvial
feature
labelled
C.
(1
x
1)
(1)
2.2.4
What
is
feature
D
called
after
it
dries
up?
(1
x
1)
(1)
2.2.5
Name
the
stream
channel
pattern
labelled
E.
(1
x
1)
(1)
2.2.6
Is
feature
E
formed
by
EROSION
or
DEPOSITION?
(1
x
1)
(1)
2.2.7
Is
feature
C
generally
found
in
the
UPPER
or
LOWER
course
of
a
river?
(1
x
1)
(1)
Geography/P1
6
DBE/2014
NSC
–
Grade
12
Exemplar
Copyright
reserved
Please
turn
over
2.3
Study
the
synoptic
weather
map
in
FIGURE
2.3
and
answer
the
questions
that
follow.
2.3.1
Identify
the
THREE
pressure
systems
labelled
A,
B
and
C
respectively.
(3
x
1)
(3)
2.3.2
Explain
why
high-pressure
cell
A
limits
rainfall
over
the
interior
of
the
country
during
winter
months.
(2
x
2)
(4)
2.3.3
What
evidence
on
the
synoptic
weather
map
suggests
that
high-
pressure
cell
B
is
ridging?
(1
x
2)
(2)
2.3.4
Evaluate
the
negative
impact
of
the
cyclone
labelled
C
on
the
economy
of
South
Africa.
(4
x
2)
(8)
2.4
FIGURE
2.4
is
based
on
valley
climates.
2.4.1
Name
the
wind
labelled
A.
(1
x
1)
(1)
2.4.2
Explain
why
wind
A
occurs
at
night.
(2
x
2)
(4)
2.4.3
A
temperature
inversion
has
formed
at
B.
With
reference
to
FIGURE
2.4,
assess
the
impact
that
this
is
likely
to
have
on
the
health
of
people
living
in
the
valley.
(2
x
2)
(4)
2.4.4
Give
TWO
reasons
why
area
C
is
not
suitable
for
the
planting
of
all
types
of
crops.
(2
x
2)
(4)
2.5
FIGURE
2.5
illustrates
two
drainage
basins.
2.5.1
Define
the
term
drainage
basin.
(1
x
1)
(1)
2.5.2
Define
the
term
drainage
density.
(1
x
1)
(1)
2.5.3
Which
drainage
basin,
X
or
Y,
has
a
greater
drainage
density?
(1
x
2)
(2)
2.5.4
Give
ONE
reason
for
your
answer
to
QUESTION
2.5.3.
(1
x
2)
(2)
2.5.5
Discuss
TWO
factors
that
could
result
in
a
drainage
basin
having
a
high
drainage
density.
(2
x
2)
(4)
2.5.6
Explain
the
impact
of
urban
development
at
points
A,
B
and
C
on
the
drainage
density
of
drainage
basin
X.
(2
x
2)
(4)](https://image.slidesharecdn.com/mindtheseriesstudyguidegeographygrade12-230512090758-7aa84044/85/MIND-THE-SERIES-STUDY-GUIDE-GEOGRAPHY-GRADE-12-pdf-162-320.jpg)
![Appendix
© Department of Basic Education 2014
Mind the Gap CAPS Grade 12 Geography APPENDIX 1 143
Geography/P1
7
DBE/2014
NSC
–
Grade
12
Exemplar
Copyright
reserved
Please
turn
over
2.6
FIGURE
2.6
illustrates
river
capture.
2.6.1
Is
river
S
or
river
T
the
captor
stream?
(1
x
1)
(1)
2.6.2
Name
the
features
of
river
capture
that
developed
at
points
A,
B
and
C.
(3
x
1)
(3)
2.6.3
Give
TWO
possible
reasons
why
the
tributary
of
river
T
eroded
through
the
watershed.
(2
x
2)
(4)
2.6.4
Write
a
short
paragraph
in
which
you
explain
the
impact
of
river
capture
on
the
sustainability
of
the
river
as
an
ecosystem.
(4
x
2)
(8)
[75]
Geography/P1
8
DBE/2014
NSC
–
Grade
12
Exemplar
Copyright
reserved
Please
turn
over
SECTION
B:
RURAL
AND
URBAN
SETTLEMENTS
AND
ECONOMIC
GEOGRAPHY
OF
SOUTH
AFRICA
Answer
at
least
ONE
question
from
this
section.
If
you
answer
ONE
question
from
SECTION
B,
you
MUST
answer
TWO
questions
from
SECTION
A.
QUESTION
3
3.1
Refer
to
settlements
A
to
E
in
FIGURE
3.1.
Indicate
to
which
settlement
each
of
the
following
descriptions
refers.
Write
only
the
letter
(A–E)
next
to
the
question
number
(3.1.1–3.1.7)
in
the
ANSWER
BOOK.
You
may
use
the
same
answer
more
than
once.
3.1.1
3.1.2
3.1.3
3.1.4
3.1.5
3.1.6
3.1.7
Settlements
located
close
to
a
source
of
water
because
water
is
scarce
Farmsteads
that
are
dispersed/isolated
Farmsteads
that
follow
a
linear
shape
Farmsteads
that
have
a
roughly
circular
shape
An
isolated
settlement
most
likely
associated
with
subsistence
farming
Associated
with
large
commercial
farms
that
are
profit
driven
Farmsteads
associated
with
intensive
commercial
farming
(7
x
1)
(7)
3.2
Choose
a
term
from
COLUMN
B
that
matches
the
description
in
COLUMN
A.
Write
only
the
letter
(A–I)
next
to
the
question
number
(3.2.1–3.2.8)
in
the
ANSWER
BOOK.
You
may
use
each
answer
only
ONCE.
COLUMN
A
COLUMN
B
3.2.1
3.2.2
3.2.3
3.2.4
3.2.5
3.2.6
3.2.7
3.2.8
Goods
sold
within
South
Africa's
borders
The
extraction
of
raw
materials
from
nature
Linked
to
innovation,
research
and
development
Exchange
of
goods
and
services
Goods
sold
outside
South
Africa's
borders
Value
of
goods
and
services
produced
locally
Refers
to
services
such
as
roads
and
communication
networks
Provision
of
services
A
B
C
D
E
F
G
H
I
trade
secondary
sector
gross
domestic
product
infrastructure
primary
sector
export
market
tertiary
activities
home
market
quaternary
sector
(8
x
1)
(8)](https://image.slidesharecdn.com/mindtheseriesstudyguidegeographygrade12-230512090758-7aa84044/85/MIND-THE-SERIES-STUDY-GUIDE-GEOGRAPHY-GRADE-12-pdf-163-320.jpg)
![Appendix
© Department of Basic Education 2014
144 APPENDIX 1 Mind the Gap CAPS Grade 12 Geography
Geography/P1
9
DBE/2014
NSC
–
Grade
12
Exemplar
Copyright
reserved
Please
turn
over
3.3
FIGURE
3.3
shows
a
simple
urban
land-use
model.
3.3.1
Which
urban
land-use
model
does
FIGURE
3.3
show?
(1
x
1)
(1)
3.3.2
Identify
the
land-use
zone
at
A.
(1
x
1)
(1)
3.3.3
Discuss
TWO
factors
that
would
have
influenced
the
location
of
land-use
zone
A.
(2
x
2)
(4)
3.3.4
Describe
the
location
of
the
rural-urban
fringe.
(1
x
2)
(2)
3.3.5
Although
the
inner
city
area
is
dilapidated
(buildings
are
in
a
poor
state),
it
still
has
very
high
property
values.
Explain
why
the
dilapidation
does
not
impact
on
property
values.
(4
x
2)
(8)
3.4
Refer
to
the
case
study
in
FIGURE
3.4,
based
on
urbanisation
in
South
Africa.
3.4.1
Define
the
term
urbanisation.
(1
x
1)
(1)
3.4.2
What
proportion
of
South
Africans
lived
in
urban
areas
in
2011?
(1
x
1)
(1)
3.4.3
Give
TWO
possible
reasons
for
the
high
growth
rate
in
urbanisation
in
South
Africa
as
mentioned
in
the
case
study.
(2
x
2)
(4)
3.4.4
What
is
the
term
used
to
describe
the
decreasing
number
of
people
left
in
rural
areas?
(1
x
2)
(2)
3.4.5
Briefly
discuss
the
negative
aspects
of
urbanisation
for
cities
in
South
Africa.
(3
x
2)
(6)
3.5
Refer
to
FIGURE
3.5
showing
the
contribution
of
economic
activities
to
the
GDP.
3.5.1
Which
economic
activity
contributed
the
highest
percentage
to
the
GDP?
(1
x
1)
(1)
3.5.2
What
was
the
percentage
contribution
of
the
activity
mentioned
in
QUESTION
3.5.1
to
the
GDP?
(1
x
1)
(1)
3.5.3
Discuss
any
TWO
natural
factors
that
limit
agricultural
development
in
South
Africa.
(2
x
2)
(4)
3.5.4
Discuss
the
importance
of
agriculture
for
economic
development
in
South
Africa.
(2
x
2)
(4)
3.5.5
Incorrect
farming
methods
have
a
negative
impact
on
food
security
in
South
Africa.
Explain
this
statement.
(2
x
2)
(4)
Geography/P1
10
DBE/2014
NSC
–
Grade
12
Exemplar
Copyright
reserved
Please
turn
over
3.6
Read
the
extract
on
the
Maputo
Development
Corridor
in
FIGURE
3.6
and
answer
the
questions
that
follow.
3.6.1
What
does
the
abbreviation
SDI
stand
for?
(1
x
1)
(1)
3.6.2
Name
ONE
development
project
associated
with
the
Maputo
Development
Corridor.
(1
x
1)
(1)
3.6.3
How
does
the
Maputo
Development
Corridor
contribute
to
the
economy
of
South
Africa?
(1
x
2)
(2)
3.6.4
The
establishment
of
the
Maputo
Development
Corridor
will
address
the
problem
of
industrial
centralisation
in
Gauteng.
Explain
this
statement.
(2
x
2)
(4)
3.6.5
Outline
the
economic
advantages
for
communities
living
along
the
Maputo
Development
Corridor.
(4
x
2)
(8)
[75]
QUESTION
4
4.1
Refer
to
the
settlement
hierarchy
in
FIGURE
4.1
that
shows
the
classification
of
different
types
of
settlements.
Choose
the
correct
answer
from
those
given
in
brackets
in
the
statements
below.
Write
only
the
answer
next
to
the
question
number
(4.1.1–4.1.8)
in
the
ANSWER
BOOK.
4.1.1
4.1.2
4.1.3
4.1.4
4.1.5
4.1.6
4.1.7
4.1.8
The
isolated
farmhouse
is
(a
single/multiple)
building(s).
The
number
of
settlements
(increases/decreases)
as
you
move
up
the
settlement
hierarchy
from
the
isolated
farmstead
to
the
conurbation.
The
size
of
the
population
(increases/decreases)
as
you
move
down
the
settlement
hierarchy
from
a
conurbation
to
an
isolated
farmstead.
A
large
city
can
also
be
called
a
(megalopolis/metropolis).
The
settlement
hierarchy
in
FIGURE
4.1
is
a
South
African
example
of
a
settlement
hierarchy
as
the
(largest/smallest)
of
all
settlements
is
not
included.
The
only
example
of
a
conurbation
in
South
Africa
is
found
in
the
(PWV/Durban-Pinetown)
Industrial
Region.
The
relationship
between
the
size
of
the
population
and
the
number
of
settlements
is
(directly/indirectly)
proportional.
The
(hamlet/small
town)
is
an
example
of
a
rural
settlement.
(8
x
1)
(8)](https://image.slidesharecdn.com/mindtheseriesstudyguidegeographygrade12-230512090758-7aa84044/85/MIND-THE-SERIES-STUDY-GUIDE-GEOGRAPHY-GRADE-12-pdf-164-320.jpg)
![Appendix
© Department of Basic Education 2014
146 APPENDIX 1 Mind the Gap CAPS Grade 12 Geography
Geography/P1
13
DBE/2014
NSC
–
Grade
12
Exemplar
Copyright
reserved
4.5
Refer
to
FIGURE
4.5
on
informal
trade.
4.5.1
When
is
trade
considered
to
be
informal?
(1
x
1)
(1)
4.5.2
Give
ONE
point
of
evidence
from
FIGURE
4.5
that
it
represents
informal
trade.
(1
x
1)
(1)
4.5.3
State
TWO
negative
conditions
that
informal
traders
have
to
cope
with
on
a
daily
basis.
(2
x
2)
(4)
4.5.4
With
reference
to
FIGURE
4.5,
describe
how
local
authorities
can
improve
the
working
space
of
informal
traders.
(2
x
2)
(4)
4.5.5
Name
ONE
negative
implication
of
the
informal
sector
for
the
South
African
economy.
(1
x
2)
(2)
4.5.6
Despite
the
negative
implication
named
in
QUESTION
4.5.5,
the
South
African
government
and
local
authorities
tolerate
the
presence
of
informal
traders.
Explain
why
this
is
the
case.
(2
x
2)
(4)
4.6
Refer
to
FIGURE
4.6,
a
map
showing
the
Gauteng
(PWV)
Industrial
Region.
4.6.1
Refer
to
insert
A
and
select
the
letter
(B,
C,
D
or
G)
that
represents
the
Gauteng
(PWV)
Industrial
Region.
(1
x
1)
(1)
4.6.2
Name
the
main
primary
activity
that
stimulated
the
growth
of
Gauteng
(PWV)
as
the
major
industrial
region
in
South
Africa.
(1
x
1)
(1)
4.6.3
Discuss
THREE
problems
that
developed
as
a
result
of
an
over-
concentration
of
industries
in
the
Gauteng
(PWV)
Industrial
Region.
(2
x
2)
(4)
4.6.4
Despite
the
problems
associated
with
industrial
development
in
the
Gauteng
(PWV)
Industrial
Region,
industrial
development
in
this
region
is
important
for
economic
development
in
South
Africa
as
a
whole.
Discuss
this
statement.
(4
x
2)
(8)
[75]
TOTAL:
225](https://image.slidesharecdn.com/mindtheseriesstudyguidegeographygrade12-230512090758-7aa84044/85/MIND-THE-SERIES-STUDY-GUIDE-GEOGRAPHY-GRADE-12-pdf-166-320.jpg)
![Appendix
© Department of Basic Education 2014
Mind the Gap CAPS Grade 12 Geography APPENDIX 1 147
Geography/P1
2
DBE/2014
NSC
–
Grade
12
Exemplar
–
Annexure
Copyright
reserved
Please
turn
over
FIGURE
1.2:
DRAINAGE
PATTERNS
[Source:
www.tulane.edu]
FIGURE
1.3:
TROPICAL
CYCLONE
TROPICAL
CYCLONE
HARUNA
Tropical
cyclone
Haruna
developed
in
the
Mozambique
Channel
on
18
February
2013.
It
reached
a
peak
wind
speed
of
150
km
per
hour.
It
weakened
significantly
when
it
reached
land,
where
a
previous
system
had
already
flooded
the
land.
When
Haruna
arrived,
7
402
houses
were
destroyed,
rice
and
maize
crops
were
damaged,
26
people
were
killed,
127
injured
and
there
was
an
outbreak
of
diseases
after
the
tropical
cyclone
dissipated.
It
dissipated
on
24
February
2013.
[Source:
South
African
Weather
Service]
A
Dendritic
Radial
Rectangular](https://image.slidesharecdn.com/mindtheseriesstudyguidegeographygrade12-230512090758-7aa84044/85/MIND-THE-SERIES-STUDY-GUIDE-GEOGRAPHY-GRADE-12-pdf-167-320.jpg)
![Appendix
© Department of Basic Education 2014
148 APPENDIX 1 Mind the Gap CAPS Grade 12 Geography
Geography/P1
3
DBE/2014
NSC
–
Grade
12
Exemplar
–
Annexure
Copyright
reserved
Please
turn
over
FIGURE
1.4:
URBAN
MICROCLIMATE
[Source:
www.healthyurbanhabitat.com.au]
FIGURE
1.5:
RIVER
SYSTEM
[Source:
www.stevekluge.com]
source
distributaries
A
high
ridges
streams
B
C
mouth
Rural-urban
fringe
Rural-urban
fringe
Industries
CBD
Geography/P1
4
DBE/2014
NSC
–
Grade
12
Exemplar
–
Annexure
Copyright
reserved
Please
turn
over
FIGURE
1.6:
RIVER
MANAGEMENT
UMGENI
RIVER
'ONE
OF
DIRTIEST'
IN
SA
7
June
2013
By
Tony
Carnie
Durban
–
The
Umgeni
River
is
one
of
the
dirtiest
rivers
in
the
country,
with
recent
studies
showing
proof
of
cholera,
shigella,
salmonella
and
other
harmful
viruses
and
bacteria
at
every
sampling
point
between
the
Inanda
Dam
and
Blue
Lagoon
in
Durban.
The
release
of
the
study
comes
after
the
city's
health
unit
has
raised
the
alarm
over
a
suspected
outbreak
of
diarrhoea
in
Durban
after
two
children
died
and
more
than
150
people
were
hospitalised
in
the
past
three
months.
Though
they
do
not
pinpoint
the
exact
pollution
sources,
the
researchers
suggest
that
the
most
likely
sources
of
the
viruses
and
bacteria
in
the
Umgeni
are
inadequate
municipal
sewage
treatment
and
run-off
from
informal
houses
close
to
the
river.
'No
wastewater
treatment
is
provided
and
raw
sewage
enters
the
rivers
and
streams
directly.
Because
of
a
lack
of
infrastructure
in
some
settlements,
the
residents
are
often
forced
to
inhabit
river
banks
…
People
living
in
these
areas
often
utilise
the
contaminated
surface
water
for
crop
irrigation,
recreation
and
domestic
and
personal
use
such
as
for
washing,
drinking
water
and
cooking
without
prior
treatment.'
The
230
km
Umgeni
River
had
been
chosen
for
the
study
because
it
is
the
primary
source
of
water
for
more
than
3,5
million
people
in
an
area
which
generates
almost
65
per
cent
of
the
provincial
gross
domestic
product.
[Source:
Mercury]
FIGURE
2.1:
PRESSURE
CELLS
[Source:
www.northwestpassage.blogspot.com]](https://image.slidesharecdn.com/mindtheseriesstudyguidegeographygrade12-230512090758-7aa84044/85/MIND-THE-SERIES-STUDY-GUIDE-GEOGRAPHY-GRADE-12-pdf-168-320.jpg)
![Appendix
© Department of Basic Education 2014
Mind the Gap CAPS Grade 12 Geography APPENDIX 1 149
Geography/P1
5
DBE/2014
NSC
–
Grade
12
Exemplar
–
Annexure
Copyright
reserved
Please
turn
over
FIGURE
2.2:
FLUVIAL
LANDFORMS
[Source:
www.easymapwork.blogspot.com]
FIGURE
2.3:
SYNOPTIC
WEATHER
MAP
[Source:
South
African
Weather
Service]](https://image.slidesharecdn.com/mindtheseriesstudyguidegeographygrade12-230512090758-7aa84044/85/MIND-THE-SERIES-STUDY-GUIDE-GEOGRAPHY-GRADE-12-pdf-169-320.jpg)
![Appendix
© Department of Basic Education 2014
150 APPENDIX 1 Mind the Gap CAPS Grade 12 Geography
Geography/P1
7
DBE/2014
NSC
–
Grade
12
Exemplar
–
Annexure
Copyright
reserved
Please
turn
over
FIGURE
2.6:
RIVER
CAPTURE
[Source:
www.wikipedia.org]
FIGURE
3.1:
RURAL
SETTLEMENTS
flood
plain
river
City
–
4
km
water
source
road
farmstead
farm
boundary
A
B
C
S
T
Hard
rock
Soft
rock
Geography/P1
8
DBE/2014
NSC
–
Grade
12
Exemplar
–
Annexure
Copyright
reserved
Please
turn
over
FIGURE
3.3:
URBAN
LAND-USE
ZONES
[Source:
GCSE
Geography
Examination]
FIGURE
3.4:
URBANISATION
SOUTH
AFRICA
GOES
WITH
THE
URBANISATION
FLOW
Two-thirds
of
people
in
South
Africa
now
live
in
urban
areas
as
a
result
of
growing
urbanisation
over
the
last
few
decades.
The
proportion
of
people
living
in
urban
areas
increased
from
52%
in
1990
to
62%
in
2011.
The
share
of
those
living
in
rural
areas
dropped
from
48%
to
38%
over
the
same
period.
South
Africa's
long-term
urbanisation
trend
is
partly
the
result
of
freer
movement
of
people
after
apartheid.
Higher
economic
growth
in
urban
areas
has
also
drawn
people
to
cities
in
search
of
employment,
including
immigrants
from
outside
the
country.
[Source:
www.sairr.org.za/media/media-releases/Urbanisation%2520-%252022_Jan_2013.pdf]
rural-urban
fringe
suburbs
inner
city
A](https://image.slidesharecdn.com/mindtheseriesstudyguidegeographygrade12-230512090758-7aa84044/85/MIND-THE-SERIES-STUDY-GUIDE-GEOGRAPHY-GRADE-12-pdf-170-320.jpg)
![Appendix
© Department of Basic Education 2014
Mind the Gap CAPS Grade 12 Geography APPENDIX 1 151
Geography/P1
9
DBE/2014
NSC
–
Grade
12
Exemplar
–
Annexure
Copyright
reserved
Please
turn
over
FIGURE
3.5:
CONTRIBUTION
OF
ECONOMIC
ACTIVITIES
TO
THE
GDP
[Source:
www.internetmatters.co.za/images/contrib.png]
FIGURE
3.6:
THE
MAPUTO
DEVELOPMENT
CORRIDOR
THE
MAPUTO
DEVELOPMENT
CORRIDOR
SDI
The
Maputo
Development
Corridor
runs
from
Witbank
in
Mpumalanga,
through
Nelspruit,
to
the
capital
of
Mozambique,
Maputo.
The
transport
route
offers
the
shortest
link
from
Gauteng,
the
industrial
heart
of
South
Africa,
to
an
export
harbour.
One
hundred
and
thirty
investment
opportunities
have
been
identified
for
infrastructure
provision
and
for
agriculture,
mining,
energy,
chemicals
and
manufacturing.
The
main
infrastructure
projects
are
the
N4
Maputo
Corridor
toll
road,
costing
R1,5
billion,
the
upgrading
of
the
railway
line
from
Ressano
Garcia
to
Maputo,
the
upgrading
of
the
Maputo
port
(including
the
dredging
of
the
harbour
to
make
it
deeper)
and
the
upgrading
of
telecommunication.
CONTRIBUTION
TO
GDP
59
120
565
357
78
260
63,9
0
100
200
300
400
500
600
7
6
5
4
3
2
1
2,1%
8,7%
2,6%
12%
19%
4%
2%
KEY:
1.
Agriculture
2.
Mining
and
quarrying
3.
Electricity,
gas
and
water
4.
Manufacturing
5.
Finance
6.
Construction
7.
Internet
Geography/P1
10
DBE/2014
NSC
–
Grade
12
Exemplar
–
Annexure
Copyright
reserved
Please
turn
over
FIGURE
4.1:
SETTLEMENT
HIERARCHY
FIGURE
4.3:
INFORMAL
SETTLEMENTS
In
2005,
an
estimated
934
million
people
lived
in
informal
settlements
in
developing
countries.
This
number
is
projected
to
increase
to
1,5
billion
by
2020,
and
to
2
billion
by
2031.
[Source:
Human
settlements
programme:
UN]
Fewest
Number
of
settlements
Most
Conurbation
Large
city
City
Town
Small
town
Village
Hamlet
Isolated
farmstead
Huge
Size
of
population
Tiny](https://image.slidesharecdn.com/mindtheseriesstudyguidegeographygrade12-230512090758-7aa84044/85/MIND-THE-SERIES-STUDY-GUIDE-GEOGRAPHY-GRADE-12-pdf-171-320.jpg)
![Appendix
© Department of Basic Education 2014
Mind the Gap CAPS Grade 12 Geography APPENDIX 1 153
Geography/P1
2
DBE/2014
NSC
–
Grade
12
Exemplar
–
Memorandum
Copyright
reserved
Please
turn
over
SECTION
A
QUESTION
1
1.1
1.1.1
1.1.2
1.1.3
1.1.4
1.1.5
1.1.6
1.1.7
24
°C
(1)
East
North-East
(1)
10
knots
(1)
Overcast
skies
(1)
Rain
(1)
21°
C
(1)
High
(1)
(7
x
1)
(7)
1.2
1.2.1
1.2.2
1.2.3
1.2.4
1.2.5
1.2.6
1.2.7
1.2.8
Dendritic
(1)
Rectangular
(1)
Rectangular
(1)
Dendritic
(1)
Radial
(1)
Dendritic
(1)
Radial
(1)
Rectangular
(1)
(8
x
1)
(8)
1.3
1.3.1
The
eye
(of
the
storm)
(1)
(1
x
1)
(1)
1.3.2
Clockwise
(1)
(1
x
1)
(1)
1.3.3
7
days
(18
to
24
February
2013)
(1)
(1
x
1)
(1)
1.3.4
Eight
(2)
(1
x
2)
(2)
1.3.5
Increased
friction
from
moving
over
land
caused
it
to
lose
momentum
(2)
Cut
off
from
water
which
is
its
source
of
energy
(2)
Condensation
and
the
release
of
latent
heat
is
reduced
(2)
[Any
ONE]
(1
x
2)
(2)
1.3.6
Mozambique
is
a
poorer
(less
developed)
country
and
has
fewer
resources
to
effectively
deal
with
a
tropical
cyclone
(2)
Their
early
warning
systems
are
not
as
effective
as
in
developed
countries
(2)
Lack
of
media
coverage
to
warn
people,
e.g.
TV,
radio
and
the
Internet
(2)
Many
people
are
not
aware
of
dangers
associated
with
a
tropical
cyclone
(2)
Mozambique's
disaster
management
policies
and
techniques
are
not
as
sophisticated
as
those
of
developed
countries
(2)
Mozambicans
often
build
their
houses
from
less
weather
resistant
materials
(2)
Collapsing
of
poorly
built
houses
cause
more
damage
and
loss
of
lives
(2)
Many
people
don't
know
what
to
do
when
a
tropical
cyclone
hits
(2)
Many
do
not
evacuate
or
leave
their
villages
and
homes
in
time
(2)](https://image.slidesharecdn.com/mindtheseriesstudyguidegeographygrade12-230512090758-7aa84044/85/MIND-THE-SERIES-STUDY-GUIDE-GEOGRAPHY-GRADE-12-pdf-173-320.jpg)
![Appendix
© Department of Basic Education 2014
154 APPENDIX 1 Mind the Gap CAPS Grade 12 Geography
Geography/P1
3
DBE/2014
NSC
–
Grade
12
Exemplar
–
Memorandum
Copyright
reserved
Please
turn
over
People
are
too
poor
to
stock
up
on
necessities
for
an
emergency
(2)
Lack
of
emergency
evacuation
services
(2)
Poorly
developed
infrastructure
makes
it
difficult
for
emergency
services
to
reach
people
(2)
Poorly
equipped
health
services
cannot
provide
medication
to
prevent
outbreak
of
diseases
(2)
[Any
FOUR.
Accept
other
reasonable
answers]
(4
x
2)
(8)
1.4
1.4.1
Highest
–
CBD
(1)
Lowest
–
Rural-urban
fringe
(1)
(2
x
1)
(2)
1.4.2
An
urban
area
with
higher
temperatures
surrounded
by
lower
temperatures
of
the
rural
areas
(1)
[Concept]
(1
x
1)
(1)
1.4.3
As
a
result
of
convection,
the
urban
heat
island
extends
vertically
during
day
time
dispersing
pollution
particles
to
the
upper
troposphere
(2)
At
night
time,
the
cooler
atmosphere
subside
pushing
pollution
particles
downward,
resulting
in
a
concentration
closer
to
the
Earth's
surface
(2)
The
heat
island
during
the
day
has
a
greater
vertical
dimension
while
the
pollution
dome
at
night
is
compressed
over
the
city
(2)
The
heat
island
is
well-developed
during
the
day
and
the
pollution
dome
is
well
developed
at
night
time
(2)
[CONCEPT
–
Any
ONE]
(1
x
2)
(2)
1.4.4
Pollution
domes
are
caused
when
a
temperature
inversion
forms,
which
traps
air
pollutants
(dust
and
soot)
over
the
urban
area
(2)
(1
x
2)
(2)
1.4.5
More
artificial
surfaces
(like
glass
and
dark
paving)
absorb
more
heat
(2)
Buildings
increase
surface
area
which
can
absorb
heat
(2)
High
density
of
buildings
traps
heat
in
city
(2)
Fewer
plants
to
assist
with
cooling
processes
(evapotranspiration)
in
city
(2)
The
presence
of
industries
emitting
greenhouse
gases
will
contribute
to
higher
temperatures
in
the
cities
(2)
[Any
TWO.
Accept
other
reasons
visible
in
diagram]
(2
x
2)
(4)
1.4.6
Plant
more
trees
and
have
more
vegetated
areas/green
belts
(2)
Rooftop
gardens
(2)
Develop
water
bodies
(like
fountains/ponds)
in
urban
areas
to
decrease
the
air
temperatures
through
higher
levels
of
evaporation
and
transpiration
(2)
Use
light
building
material
to
reflect
more
heat
rather
than
absorb
heat
(2)
Control
number
of
vehicles
entering
the
city
(2)
Geography/P1
4
DBE/2014
NSC
–
Grade
12
Exemplar
–
Memorandum
Copyright
reserved
Please
turn
over
Restrict
industrial
activities
to
daytime
when
less
pollutants/heat
will
be
trapped
(2)
Build
chimneys/stacks
that
release
pollutants
above
inversion
layer
(2)
Filters
in
chimneys
to
trap
pollutants
(2)
Decentralisation
of
industries
(2)
[Any
TWO.
Accept
other
sustainable
measures]
(2
x
2)
(4)
1.5
1.5.1
An
interfluve
(1)
(1
x
1)
(1)
1.5.2
Separates
water
between
two
streams
in
the
same
drainage
basin
(2)
(1
x
2)
(2)
1.5.3
High
rainfall
leads
to
a
higher
stream
discharge/Low
rainfall
leads
to
a
lower
stream
discharge
(2)
Saturated
soil
leads
to
a
higher
stream
discharge/Unsaturated
soil
leads
to
a
lower
stream
discharge
(2)
Low
permeability
leads
to
a
higher
stream
discharge/High
permeability
leads
to
a
lower
stream
discharge
(2)
Sparse
vegetation
leads
to
a
higher
stream
discharge/Dense
vegetation
leads
to
a
lower
stream
discharge
(2)
Steep
slope
leads
to
a
higher
stream
discharge/Gradual
slope
leads
to
a
lower
stream
discharge
(2)
[Any
TWO]
(2
x
2)
(4)
1.5.4
River
flows
over
level
ground
close
to
coastline
(2)
River
loses
energy
and
slows
down
(2)
Heavier
material
of
the
bed
load
is
dumped,
causing
sediments
to
build
up
on
the
sea
floor
(2)
Main
stream
splits
into
small
distributaries
as
it
flows
through
deposited
material
(2)
[Any
TWO]
(2
x
2)
(4)
1.5.5
The
soils
are
rich
in
nutrients/fertile
(2)
A
water
source
is
close
by/river
provides
water
(2)
Land
is
flat/gentle
gradient
(2)
[Any
TWO]
(2
x
2)
(4)
1.6
1.6.1
Inadequate
municipal
sewage
treatment
(1)
(1
x
1)
(1)
1.6.2
Studies
show
the
presence
of
harmful
viruses
in
river
(2)
(1
x
2)
(2)
1.6.3
An
outbreak
of
diarrhoea
in
Durban
(2)
Two
children
died
(2)
People
are
hospitalised
(2)
It
could
cause
an
outbreak
in
cholera
(2)
People
cannot
go
to
work
(2)
Loss
of
income
(2)
People
cannot
afford
high
cost
of
health
care
(2)
[Any
TWO]
(2
x
2)
(4)](https://image.slidesharecdn.com/mindtheseriesstudyguidegeographygrade12-230512090758-7aa84044/85/MIND-THE-SERIES-STUDY-GUIDE-GEOGRAPHY-GRADE-12-pdf-174-320.jpg)
![Appendix
© Department of Basic Education 2014
Mind the Gap CAPS Grade 12 Geography APPENDIX 1 155
Geography/P1
5
DBE/2014
NSC
–
Grade
12
Exemplar
–
Memorandum
Copyright
reserved
Please
turn
over
1.6.4
Stricter
control
and
enforcement
of
legislation
which
monitors
effluents
from
factories
(2)
More
hefty
fines
to
punish
polluters
(2)
Improved
waste
treatment
facilities
(2)
Have
a
buffer
so
that
people
cannot
live
close
to
rivers
(2)
Provide
running
water
in
or
close
to
homes
(2)
Regular
testing
of
water
quality
(2)
Increased
awareness
of
and
education
on
the
problems
which
people
cause
by
living
so
close
to
rivers
(2)
[Any
FOUR.
Accept
other
reasonable
solutions]
(4
x
2)
(8)
[75]
QUESTION
2
2.1
2.1.1
2.1.2
2.1.3
2.1.4
2.1.5
2.1.6
2.1.7
2.1.8
B
(1)
A
(1)
B
(1)
B
(1)
B
(1)
A
(1)
A
(1)
A
(1)
(8
x
1)
(8)
2.2
2.2.1
2.2.2
2.2.3
2.2.4
2.2.5
2.2.6
2.2.7
Cutback/Undercut
bluff
(1)
Deposition
(1)
Meander
(1)
Meander
scar
(1)
Braided
stream
(1)
Deposition
(1)
Lower
course
(1)
(7
x
1)
(7)
2.3
2.3.1
A
Kalahari/Continental
High-pressure
Cell
(1)
B
South
Atlantic/St
Helena
High-pressure
Cell
(1)
C
Mid-latitude
cyclone
(1)
(3
x
1)
(3)
2.3.2
Consists
of
cold
descending
air
that
forms
an
inversion
layer
lower
than
the
Escarpment
(2)
Prevents
moist
air
from
moving
into
the
interior
from
the
ocean
(2)
Stable
weather
conditions,
therefore
no
cloud
formation
(2)
[Any
TWO]
(2
x
2)
(4)
2.3.3
Isobars
elongate
away
from
the
high-pressure
cell
(2)
(1
x
2)
(2)
2.3.4
Damage
to
property
which
has
to
be
repaired
(2)
Higher
food
prices
because
crops
are
damaged/destroyed
(2)
Damage
to
infrastructure
makes
it
difficult
to
transport
farm
produce
(2)
Food
has
to
be
imported
at
a
higher
rate
(2)
Water
pipes
and
electricity
poles
have
to
be
replaced
(2)
(8)
Geography/P1
6
DBE/2014
NSC
–
Grade
12
Exemplar
–
Memorandum
Copyright
reserved
Please
turn
over
Impact
on
subsistence
farmers
is
greater
and
they
may
not
be
able
to
recover
(2)
Snow
associated
with
the
cold
front
causes
the
death
of
livestock
(2)
Poor
weather
conditions
increase
accident
risk
(2)
Costly
to
provide
emergency
food/water/shelter
supplies
(2)
[Any
FOUR.
Accept
any
other
reasonable
answers]
(4
x
2)
2.4
2.4.1
Katabatic/downslope/mountain
wind
(1)
(1
x
1)
(1)
2.4.2
Upper
slopes
cool
down
rapidly
(2)
Air
cools
down
rapidly
and
becomes
heavy
and
dense
(2)
Air
moves
down
the
slope
(2)
[Any
TWO.
Accept
any
other
reasonable
answer]
(2
x
2)
(4)
2.4.3
Polluted
air
trapped
below
the
inversion
(2)
Causes
respiratory
diseases
such
as
asthma
(2)
Poisonous
gases
that
pollute
the
air
cause
skin
irritations
(2)
Eye
irritation
which
affects
the
comfort
of
people
(2)
[Any
TWO.
Accept
any
other
reasonable
answer]
(2
x
2)
(4)
2.4.4
Night
temperatures
are
very
low
and
falls
below
freezing
point
(2)
Frost
develops
(frost
pocket)
and
not
all
crops
are
frost
resistant
(2)
(2
x
2)
(4)
2.5
2.5.1
The
total
area
drained
by
a
river
and
its
tributaries
(1)
[CONCEPT]
(1
x
1)
(1)
2.5.2
Total
length
of
all
the
streams
in
relation
to
the
size
of
the
drainage
basin
it
drains
(1)
[CONCEPT]
(1
x
1)
(1)
2.5.3
X
(2)
(1
x
2)
(2)
2.5.4
Many
streams
to
cover
the
greater
part
of
the
drainage
basin
(2)
[CONCEPT]
(1
x
2)
(2)
2.5.5
An
increase
in
precipitation
will
increase
the
number
of
streams
(2)
Saturated
soil
increases
run-off,
forming
more
streams
(2)
Low
permeability
results
in
run-off
and
the
development
of
streams
(2)
Sparse
vegetation
increases
run-off
and
more
streams
form
(2)
Steep
gradients
increase
run-off
and
more
streams
develop
(2)
[Any
TWO]
(2
x
2)
(4)
2.5.6
Drainage
density
will
increase
(2)
More
artificial
surfaces
and
storm
water
drainage
increase
run-off
outside
urban
developments
(2)
More
small
streams
develop
(2)
[Any
TWO]
(2
x
2)
(4)](https://image.slidesharecdn.com/mindtheseriesstudyguidegeographygrade12-230512090758-7aa84044/85/MIND-THE-SERIES-STUDY-GUIDE-GEOGRAPHY-GRADE-12-pdf-175-320.jpg)
![Appendix
© Department of Basic Education 2014
156 APPENDIX 1 Mind the Gap CAPS Grade 12 Geography
Geography/P1
7
DBE/2014
NSC
–
Grade
12
Exemplar
–
Memorandum
Copyright
reserved
Please
turn
over
2.6
2.6.1
T
(1)
(1
x
1)
(1)
2.6.2
A
elbow
of
capture
(1)
B
dry
gap/wind
gap/river
gravels
(1)
C
misfit
stream
(1)
(3
x
1)
(3)
2.6.3
Stream
flows
down
steeper
gradient
(2)
Higher
precipitation
promoting
greater
run-off
and
more
erosive
power
(2)
Soft
bedrock
through
which
it
is
flowing
(2)
The
presence
of
faults
and
joints
(2)
[Any
TWO]
(2
x
2)
(4)
2.6.4
Increased
volume
of
water
in
the
captor
stream
(2)
Downward
erosion
increases
(2)
Increase
in
stream
load
changes
ecosystem
of
river
(2)
Volume
of
water
decreases
in
the
misfit
stream
(2)
The
carrying
capacity
of
the
misfit
stream
is
reduced,
affecting
plant
and
animal
life
(2)
Ecosystems
are
disrupted
and
change
(2)
Sustainability
of
captor
stream
is
maintained
(2)
Sustainability
of
misfit
stream
is
reduced
(2)
[Any
FOUR.
Accept
other
reasonable
answers]
(4
x
2)
(8)
[75]
Geography/P1
8
DBE/2014
NSC
–
Grade
12
Exemplar
–
Memorandum
Copyright
reserved
Please
turn
over
SECTION
B
QUESTION
3
3.1
3.1.1
3.1.2
3.1.3
3.1.4
3.1.5
3.1.6
3.1.7
C
(1)
A/E
(1)
B
(1)
C
(1)
E
(1)
A
(1)
B
(1)
(7
x
1)
(7)
3.2
3.2.1
3.2.2
3.2.3
3.2.4
3.2.5
3.2.6
3.2.7
3.2.8
H
(1)
E
(1)
I
(1)
A
(1)
F
(1)
C
(1)
D
(1)
G
(1)
(8
x
1)
(8)
3.1
3.3.1
Burgess/Concentric
Zone
Model
(1)
(1
x
1)
(1)
3.3.2
CBD
(1)
(1
x
1)
(1)
3.3.3
Land-use
zone
A
is
the
most
accessible
part
of
the
city
(2)
Functional
prestige
attracts
services
(2)
Functional
convenience
attracts
services
(2)
Large
sphere
of
influence
of
land-use
zone
A
(2)
[Any
TWO.
Accept
other
reasonable
answers]
(2
x
2)
(4)
3.3.4
Located
on
the
outskirts
of
the
city/urban
area
(2)
(1
x
2)
(2)
3.3.5
This
is
the
zone
into
which
the
CBD
will
expand
(2)
This
land-use
zone
is
therefore
in
demand
(2)
Competition
to
purchase
the
land
is
high
(2)
This
zone
is
where
urban
renewal
projects
will
take
place
(2)
New
owners
will
demolish
the
buildings
(2)
No
need
for
current
owners
to
renovate/fix
buildings
(2)
[Any
FOUR.
Accept
other
reasonable
answers]
(4
x
2)
(8)
3.4
3.4.1
The
process
whereby
the
percentage
of
people
living
in
an
urban
area
increases
(1)
[CONCEPT]
(1
x
1)
(1)
3.4.2
62%
(1)
(1
x
1)
(1)](https://image.slidesharecdn.com/mindtheseriesstudyguidegeographygrade12-230512090758-7aa84044/85/MIND-THE-SERIES-STUDY-GUIDE-GEOGRAPHY-GRADE-12-pdf-176-320.jpg)
![Appendix
© Department of Basic Education 2014
Mind the Gap CAPS Grade 12 Geography APPENDIX 1 157
Geography/P1
9
DBE/2014
NSC
–
Grade
12
Exemplar
–
Memorandum
Copyright
reserved
Please
turn
over
3.4.3
In
post-apartheid
South
Africa
people
are
allowed
to
move
freely
in
all
urban
areas
(2)
Higher
economic
growth
in
urban
areas
creates
opportunities
for
employment
(2)
Immigrants
from
outside
the
country
(2)
[Any
TWO]
(2
x
2)
(4)
3.4.4
Rural
depopulation
(2)
(1
x
2)
(2)
3.4.5
Higher
rates
of
urban
growth
means
pressure
on
existing
services
(2)
Higher
rates
of
land
pollution
due
to
increase
in
waste
disposal
(2)
Increase
in
the
number
of
informal
settlements
and
population
growth
in
informal
settlements
(2)
More
unemployed
people
are
forced
to
become
economically
active
in
the
informal
economic
sector
(2)
Crime
rates
increase
(2)
Infrastructure
e.g.
roads
can
no
longer
cope
with
demands
(2)
Increasing
pollution
(air,
water,
noise)
Litter
increases
(2)
[Any
THREE.
Accept
other
reasonable
answers]
(3
x
2)
(6)
3.5
3.5.1
Finance
(1)
(1
x
1)
(1)
3.5.2
19%
(1)
(1
x
1)
(1)
3.5.3
Climate:
Most
of
South
Africa
is
drought
prone
and
rainfall
is
unreliable
(2)
Soil:
There
is
limited
arable
land
available
for
agriculture
(2)
Due
to
climatic
conditions
there
is
a
higher
rate
of
soil
erosion
(2)
Climate
change:
As
weather
conditions
become
hotter
and
drier
there
is
a
higher
rate
of
crop
loss
(2)
Climate
hazards:
Hailstorms
can
destroy
crops
(2)
Lightning
sets
crops/grazing
fields
alight
(2)
Floods
cause
destruction
of
plants
and
animals
(2
Diseases:
Foot
and
mouth
disease
causes
the
loss
of
livestock
(2)
Avian
flu
has
impacted
on
the
poultry
industry
(2)
[Any
TWO.
Accept
other
natural/physical
causes]
(2
x
2)
(4)
3.5.4
An
important
source
of
employment
in
the
primary
economic
sector
(2)
Promotes
development
of
secondary
activities
(2)
Food
exports
provide
foreign
capital
(2)
Promotes
development
of
towns/markets
(2)
Promotes
development
of
infrastructure
(2)
[Any
TWO.
Accept
other
reasonable
answers]
(2
x
2)
(4)
Geography/P1
10
DBE/2014
NSC
–
Grade
12
Exemplar
–
Memorandum
Copyright
reserved
Please
turn
over
3.5.5
Incorrect
farming
results
in
soil
erosion
(2)
Soil
becomes
infertile
(2)
Loss
of
water
due
to
incorrect
farming
methods
(2)
Irrigation
decreases
(2)
Yields
decrease
(2)
Not
enough
food
to
feed
growing
population
(2)
[Any
TWO.
Accept
other
reasonable
answers]
(2
x
2)
(4)
3.6
3.6.1
Spatial
Development
Initiative
(1)
(1
x
1)
(1)
3.6.2
N4
toll
road
(1)
Upgrading
of
railway
line
from
Ressano
Garcia
to
Maputo
(1)
Upgrading
of
Maputo
port
(1)
Upgrading
of
telecommunication
(1)
[Any
ONE]
(1
x
1)
(1)
3.6.3
Good
transport
network
to
transport
raw
material
and/or
finished
goods
(1)
Well-developed
harbours
to
export
goods
(1)
Good
transport
network
to
transport
workers
to
their
places
of
work
(2)
Generate
employment
opportunities
(2)
Promotes
international
trade
(2)
Promotes
domestic
trade
(2)
Well-developed
harbours
to
export
and/or
import
goods
(2)
[Any
ONE]
(1
x
2)
(2)
3.6.4
Industrial
development
promoted
along
the
SDI
(2)
Industries
move
out
of
PWV/Gauteng
to
peripheral
areas
along
the
corridor
(2)
Establishment
of
more
industries
in
PWV/Gauteng
slowed
down
(2)
[Any
TWO]
(2
x
2)
(4)
3.6.5
Establishment
of
industrial
growth
nodes
along
the
corridor
(2)
Employment
opportunities
created
(2)
Improved
infrastructure
attracts
tourists
(2)
Income
provided
by
selling
arts
and
crafts
(2)
Improve
standards
of
living
(2)
Improved
accessibility
to
services
(2)
Greater
accessibility
to
employment
opportunities
(2)
[Any
FOUR
points
or
TWO
explained
in
detail.
Accept
any
other
reasonable
answers]
(4
x
2)
(8)
[75]](https://image.slidesharecdn.com/mindtheseriesstudyguidegeographygrade12-230512090758-7aa84044/85/MIND-THE-SERIES-STUDY-GUIDE-GEOGRAPHY-GRADE-12-pdf-177-320.jpg)
![Appendix
© Department of Basic Education 2014
158 APPENDIX 1 Mind the Gap CAPS Grade 12 Geography
Geography/P1
11
DBE/2014
NSC
–
Grade
12
Exemplar
–
Memorandum
Copyright
reserved
Please
turn
over
QUESTION
4
4.1
4.1.1
4.1.2
4.1.3
4.1.4
4.1.5
4.1.6
4.1.7
4.1.8
single
(1)
decreases
(1)
decreases
(1)
metropolis
(1)
largest
(1)
PWV
(1)
indirectly
(1)
hamlet
(1)
(8
x
1)
(8)
4.2
4.2.1
4.2.2
4.2.3
4.2.4
4.2.5
4.2.6
4.2.7
C
(1)
C
(1)
A
(1)
B
(1)
C
(1)
B
(1)
C
(1)
(7
x
1)
(7)
4.3
4.3.1
Squatter
camps/Bustees/Favelas
(1)
[Any
ONE.
Accept
other
alternate
names]
(1
x
1)
(1)
4.3.2
Increasing
trend
(1)
(1
x
1)
(1)
4.3.3
People
migrate
from
rural
areas
to
urban
areas
in
search
of
employment
(2)
Not
enough
housing
and
people
build
shacks
to
live
in
(2)
[Any
ONE]
(1
x
2)
(2)
4.3.4
Poor
infrastructure/examples
(2)
Poor
service
delivery/examples
(2)
Inadequate
housing
(2)
Lack
of
medical/educational
services
(2)
Overcrowding
(2)
Lack
of
open
spaces
(2)
High
crime
rate
(2)
High
levels
of
pollution
(2)
Social
problems
(2)
[Any
TWO.
Accept
other]
(2
x
2)
(4)
4.3.5
More
low-cost
housing
needs
to
be
built
to
accommodate
people
without
homes
(2)
Improve
facilities
and
services
in
rural
areas
to
stem
the
movement
of
people
to
urban
areas
(2)
To
provide
more
job
opportunities
in
outlying
areas
(2)
To
have
stricter
laws
concerning
the
occupation
of
vacant
land
(2)
To
relocate
existing
people
living
in
informal
settlements
(2)
To
subsidise
people
to
build
proper
homes
(2)
Use
of
the
site
and
service
scheme
where
people
are
given
plots
of
land
and
encouraged
to
use
their
own
skills
to
build
homes
(2)
[Any
FOUR.
Accept
other
reasonable
answers]
(4
x
2)
(8)
Geography/P1
12
DBE/2014
NSC
–
Grade
12
Exemplar
–
Memorandum
Copyright
reserved
Please
turn
over
4.4
4.4.1
Ensuring
that
people
are
treated
fairly
and
that
all
their
socials
needs
are
provided
for
(1)
[CONCEPT]
(1
x
1)
(1)
4.4.2
Being
denied
access
to
a
home
(1)
(1
x
1)
(1)
4.4.3
It
shows
that
although
we
are
living
in
a
democratic
country
some
things
have
not
changed
(2)
(1
x
2)
(2)
4.4.4
Land
tenure
reform
(2)
(1
x
2)
(2)
4.4.5
No
access
to
piped
water
(2)
No
electricity
(2)
No
access
to
basic
services
such
as
clinics,
schools,
proper
infrastructure
(2)
Insufficient
job
opportunities,
underpaid
(2)
[Any
TWO.
Accept
other
reasonable
answers]
(2
x
2)
(4)
4.4.6
The
willing
buyer/seller
principle
takes
time
to
settle
(2)
It
takes
time
to
mediate
disputes
and
resolve
issues
(2)
Huge
costs
are
involved
(2)
Political
interference
(2)
Distrust
in
government's
reasoning
(2)
Eviction
of
farm
workers
despite
the
new
land
tenure
laws
(2)
Lack
of
support
from
government
(2)
Disagreement
between
government
and
traditional
leaders
about
the
extent
of
land
to
be
restored
(2)
People
having
no
interest
in
farming
or
agricultural
knowledge
and
therefore
not
utilising
the
redistributed
land
(2)
[Any
TWO.
Accept
other
reasonable
answers]
(2
x
2)
(4)
4.5
4.5.1
When
there
is
no
formal
structure
governing
the
trade,
e.g.
no
taxes
are
paid,
traders
are
not
registered
etc.
(1)
Trade
that
is
relaxed,
casual,
flexible,
without
rules
or
regulations
(1)
[CONCEPT]
(1
x
1)
(1)
4.5.2
No
formal
structure
from
which
the
business
is
operated/selling
goods
on
the
pavement
(1)
(1
x
1)
(1)
4.5.3
No
shelter
(2)
No
storage
facilities
(2)
No
ablution
facilities/toilets
(2)
Exposed
to
weather
elements
(2)
Unhygienic
working
conditions
(2)
Abuse
by
local
authorities/police
[Any
TWO.
Accept
other
reasonable
answers]
(2
x
2)
(4)
4.5.4
Provide
shelter
(2)
Provide
storage
facilities
(2)
Provide
toilets
(2)
Provide
water
(2)
[Any
TWO.
Must
give
answer
from
sketch]
(2
x
2)
(4)](https://image.slidesharecdn.com/mindtheseriesstudyguidegeographygrade12-230512090758-7aa84044/85/MIND-THE-SERIES-STUDY-GUIDE-GEOGRAPHY-GRADE-12-pdf-178-320.jpg)
![Appendix
© Department of Basic Education 2014
Mind the Gap CAPS Grade 12 Geography APPENDIX 1 159
Geography/P1
13
DBE/2014
NSC
–
Grade
12
Exemplar
–
Memorandum
Copyright
reserved
4.5.5
No
taxes
paid
(2)
No
income
for
country
(2)
GDP
cannot
be
correctly
determined
(2)
Costly
to
provide
proper
facilities
for
informal
traders
(2)
[Any
ONE.
Accept
other
reasonable
answers]
(1
x
2)
(2)
4.5.6
The
informal
sector
has
absorbed
a
lot
of
unemployed
people
(2)
People
learn
entrepreneurial
skills
that
are
transferable
to
the
formal
business
sector
(2)
The
informal
sector
boosts
the
local
fruit
and
vegetable
markets
as
they
stock
from
these
centres,
e.g.
Johannesburg
and
Tshwane
Fresh
Produce
Markets
(2)
The
poor
people
involved
in
this
sector
use
it
as
a
means
of
survival
rather
than
resorting
to
criminal
activities
(2)
[Any
TWO.
Accept
other
reasonable
answers]
(2
x
2)
(4)
4.6
4.6.1
G
(1)
(1
x
1)
(1)
4.6.2
Mining
(1)
(1
x
1)
(1)
4.6.3
Higher
rate
of
influx
of
population
due
to
employment
opportunities
(2)
Contaminated
ground
water
has
led
to
AMD
(acid
mine
drainage)
(2)
More
air/noise
pollution
(2)
The
limited
provision
of
water
results
in
lower
production
rates
(2)
Pressure
on
resources
such
as
coal
for
energy
(2)
Development
of
informal
settlements
(2)
Increase
in
crime
and
other
social
problems
(2)
Strain
on
ageing
infrastructure
(2)
Gauteng
becomes
strategically
vulnerable
(2)
[Any
TWO.
Accept
other
reasonable
answers]
(2
x
2)
(4)
4.6.4
Provide
employment
(2)
Finished
products
exported
(2)
Provides
government
with
income
(2)
Improves
South
Africa's
balance
of
trade
(2)
Attracts
foreign
investments
(2)
Build
trade
relationships
(2)
Taxes
paid
by
industries
provide
income
to
government
(2)
Development
of
infrastructure
which
improves
export
ability
(2)
Development
of
urban
settlements/markets
(2)
The
upgrading
of
OR
Tambo
International
Airport
in
this
industrial
hub
has
made
the
airport
to
be
a
gateway
to
Africa
and
the
rest
of
the
world,
thereby
facilitating
economic
growth
(2)
[Any
FOUR.
Accept
other
reasonable
answers]
(4
x
2)
(8)
[75]
TOTAL:
225](https://image.slidesharecdn.com/mindtheseriesstudyguidegeographygrade12-230512090758-7aa84044/85/MIND-THE-SERIES-STUDY-GUIDE-GEOGRAPHY-GRADE-12-pdf-179-320.jpg)
![Appendix
© Department of Basic Education 2014
162 APPENDIX 1 Mind the Gap CAPS Grade 12 Geography
Geography/P2
5
DBE/2014
NSC
–
Grade
12
Exemplar
Copyright
reserved
Please
turn
over
1.11
The
slope
formed
between
5
and
6
on
the
orthophoto
map
is
a/an
…
slope.
A
B
C
D
concave
terraced
convex
even
1.12
The
natural
feature
marked
5–6
on
the
orthophoto
map
is
a
…
A
B
C
D
saddle.
hill.
ridge.
valley.
1.13
The
index
number
of
the
map
sheet
northeast
of
Humansdorp
is
…
A
B
C
D
3424BB.
3324DC.
3424DD.
3325CC.
1.14
The
grid
reference/coordinates/position
of
trigonometrical
station
140
in
block
B3
is
…
A
B
C
D
34°01'20''S
24°47'44''E/34°01,3S
24°47,7E.
34°02'40''S
24°48'16''E/34°02,7S
24°48,3E.
34°01'20''E
24°47'44''S/34°01,3E
24°47,7S.
34°02'40''E
24°48'16''S/34°02,7E
24°48,3S.
1.15
The
city/town
located
68
km
from
the
mapped
area
is
…
A
B
C
D
Clarkson.
Port
Elizabeth.
Hankey.
Plettenberg
Bay.
(15
x
1)
[15]
Geography/P2
6
DBE/2014
NSC
–
Grade
12
Exemplar
Copyright
reserved
Please
turn
over
QUESTION
2:
MAP
CALCULATIONS
AND
TECHNIQUES
2.1
Calculate
the
straight-line
distance,
in
kilometres,
between
trigonometrical
station
294
in
block
F1
and
trigonometrical
station
94
in
block
E1.
Show
ALL
calculations.
(3
x
1)
(3)
2.2
Determine
the
present
magnetic
bearing
of
trigonometrical
station
290
in
block
F8
from
trigonometrical
station
292
in
block
D9.
n
declinatio
magnetic
present
bearing
true
bearing
magnetic
Present
:
Formula
+
=
(6
x
1)
(6)](https://image.slidesharecdn.com/mindtheseriesstudyguidegeographygrade12-230512090758-7aa84044/85/MIND-THE-SERIES-STUDY-GUIDE-GEOGRAPHY-GRADE-12-pdf-182-320.jpg)
![Appendix
© Department of Basic Education 2014
Mind the Gap CAPS Grade 12 Geography APPENDIX 1 163
Geography/P2
7
DBE/2014
NSC
–
Grade
12
Exemplar
Copyright
reserved
Please
turn
over
2.3
Calculate
the
average
gradient
between
trigonometrical
station
290
in
block
F8
and
trigonometrical
station
292
in
block
D9.
Show
ALL
calculations.
equivalent
horisontal
interval
vertical
Gradient
:
Formula
=
(6
x
1)
(6)
2.4
Refer
to
the
cross-section
from
spot
height
24
in
block
F7
to
trigonometrical
station
number
290
in
block
F8
below
and
answer
the
questions
that
follow.
2.4.1
If
you
stand
at
A,
will
you
be
able
to
see
a
person
at
B?
(1
x
1)
(1)
2.4.2
Give
ONE
reason
for
your
answer
to
QUESTION
2.4.1.
(1
x
1)
(1)
∙24
B
A
∆290
Vertical
scale:
1
cm
represents
20
m
Geography/P2
8
DBE/2014
NSC
–
Grade
12
Exemplar
Copyright
reserved
Please
turn
over
2.4.3
Calculate
the
vertical
exaggeration
of
the
cross-section.
Show
ALL
calculations.
scale
horisontal
scale
vertical
on
exaggerati
tical
Ver
:
Formula
=
(3
x
1)
(3)
[20]](https://image.slidesharecdn.com/mindtheseriesstudyguidegeographygrade12-230512090758-7aa84044/85/MIND-THE-SERIES-STUDY-GUIDE-GEOGRAPHY-GRADE-12-pdf-183-320.jpg)
![Appendix
© Department of Basic Education 2014
164 APPENDIX 1 Mind the Gap CAPS Grade 12 Geography
Geography/P2
9
DBE/2014
NSC
–
Grade
12
Exemplar
Copyright
reserved
Please
turn
over
QUESTION
3:
APPLICATION
AND
INTERPRETATION
3.1
Refer
to
points
3
and
4
on
the
orthophoto
map.
3.1.1
Name
the
landform
that
is
found
between
points
3
and
4
on
the
orthophoto
map.
(1
x
1)
(1)
3.1.2
Name
the
type
of
wind
that
will
occur
at
this
landform
during
the
night.
(1
x
2)
(2)
3.1.3
Draw
a
simple,
labelled
free-hand
cross-section
to
show
the
wind
identified
in
QUESTION
3.1.2.
(1
x
2)
(2)
3.2
In
which
stage
of
development
is
Krom
River
in
block
I5?
Give
a
reason
for
your
answer.
Stage:
Reason:
(1
+
2)
(3)
3.3
Give
a
possible
explanation
why
so
many
marshes
developed
in
the
mapped
area.
(1
x
2)
(2)
Geography/P2
10
DBE/2014
NSC
–
Grade
12
Exemplar
Copyright
reserved
Please
turn
over
3.4
Study
the
table
below
showing
the
average
annual
midday
temperatures
for
areas
5
and
11
on
the
orthophoto
map
and
answer
the
question
that
follows.
Area
11
Area
5
24,5
°C
19
°C
Area
11
has
a
higher
average
temperature
than
area
5.
Give
ONE
possible
reason
for
this
difference
in
temperature.
(1
x
2)
(2)
3.5
Find
residential
area
12
on
the
orthophoto
map.
Also
refer
to
the
topographical
map.
Is
residential
area
12
a
high-
or
low-income
residential
area?
Give
a
reason
for
your
answer.
Income
area:
Reason:
(1
+
2)
(3)
3.6
State
whether
zone
10
on
the
orthophoto
map
is
a
light
or
heavy
industrial
area.
Give
a
reason
for
your
answer.
Type
of
industrial
area:
Reason:
(1
+
2)
(3)
3.7
Jeffreys
Bay
has
a
roughly
linear
shape.
Explain
why
this
is
the
case.
(2
x
2)
(4)
3.8
Refer
to
FIGURE
1
on
page
3.
Is
FIGURE
1
a
political
or
thematic
map?
Give
a
reason
for
your
answer.
Type
of
map:
Reason:
(1
+
2)
(3)
[25]](https://image.slidesharecdn.com/mindtheseriesstudyguidegeographygrade12-230512090758-7aa84044/85/MIND-THE-SERIES-STUDY-GUIDE-GEOGRAPHY-GRADE-12-pdf-184-320.jpg)
![Appendix
© Department of Basic Education 2014
Mind the Gap CAPS Grade 12 Geography APPENDIX 1 165
Geography/P2
11
DBE/2014
NSC
–
Grade
12
Exemplar
Copyright
reserved
Please
turn
over
QUESTION
4:
GEOGRAPHICAL
INFORMATION
SYSTEMS
(GIS)
4.1
Refer
to
the
images
below
illustrating
spatial
resolution
and
answer
the
questions
that
follow.
4.1.1
Define
the
term
spatial
resolution.
(1
x
1)
(1)
4.1.2
Which
image,
A
or
B,
has
a
better
spatial
resolution?
Give
a
reason
for
your
answer.
Image:
Reason:
(1
+
2)
(3)
4.2
Buffering
plays
an
important
role
in
flood
prevention
at
Kleinriviermond
(Klein
River
mouth)
in
block
I6.
4.2.1
Define
the
term
buffering.
(1
x
1)
(1)
A
B
Geography/P2
12
DBE/2014
NSC
–
Grade
12
Exemplar
Copyright
reserved
4.2.2
You
want
to
build
a
holiday
resort
near
Kromriviermond
(Krom
River
mouth),
but
you
are
concerned
about
the
Krom
River
flooding.
Explain
how
you
could
use
buffering
to
assist
you
with
this
problem.
(1
x
2)
(2)
4.3
Refer
to
block
E7
on
the
topographical
map.
4.3.1
Identify
the
following
in
block
E7:
(a)
A
point
feature:
(1
x
1)
(1)
(b)
A
line
feature:
(1
x
1)
(1)
(c)
An
area/polygon
feature:
(1
x
1)
(1)
4.4
You
are
asked
to
do
a
paper
GIS
to
determine
the
accessibility
of
Humansdorp.
Name
the
main
data
layer
you
would
use
in
your
investigation
and
give
a
reason
for
your
answer.
Main
layer:
Reason:
(1
+
2)
(3)
4.5
Explain
why
data
manipulation
is
important
in
a
GIS.
(1
x
2)
(2)
[15]
TOTAL:
75](https://image.slidesharecdn.com/mindtheseriesstudyguidegeographygrade12-230512090758-7aa84044/85/MIND-THE-SERIES-STUDY-GUIDE-GEOGRAPHY-GRADE-12-pdf-185-320.jpg)

![Appendix
© Department of Basic Education 2014
Mind the Gap CAPS Grade 12 Geography APPENDIX 1 169
Geography/P2
5
DBE/2014
NSC
–
Grade
12
Exemplar
–
Memorandum
Copyright
reserved
Please
turn
over
1.11
The
slope
formed
between
5
and
6
on
the
orthophoto
map
is
a/an
…
slope.
A
B
C
D
concave
terraced
convex
even
A
1.12
The
natural
feature
marked
5–6
on
the
orthophoto
map
is
a
…
A
B
C
D
saddle.
hill.
ridge.
valley.
C
1.13
The
index
number
of
the
map
sheet
northeast
of
Humansdorp
is
…
A
B
C
D
3424BB.
3324DC.
3424DD.
3325CC.
D
1.14
The
grid
reference/coordinates/position
of
trigonometrical
station
140
in
block
B3
is
…
A
B
C
D
34°01'20''S
24°47'44''E/34°01,3S
24°47,7E.
34°02'40''S
24°48'16''E/34°02,7S
24°48,3E.
34°01'20''E
24°47'44''S/34°01,3E
24°47,7S.
34°02'40''E
24°48'16''S/34°02,7E
24°48,3S.
A
1.15
The
city/town
located
68
km
from
the
mapped
area
is
…
A
B
C
D
Clarkson.
Port
Elizabeth.
Hankey.
Plettenberg
Bay.
B
(15
x
1)
[15]
Geography/P2
6
DBE/2014
NSC
–
Grade
12
Exemplar
–
Memorandum
Copyright
reserved
Please
turn
over
QUESTION
2:
MAP
CALCULATIONS
AND
TECHNIQUES
2.1
Calculate
the
straight-line
distance,
in
kilometres,
between
trigonometrical
station
294
in
block
F1
and
trigonometrical
station
94
in
block
E1.
Show
ALL
calculations.
Actual
Distance
=
Map
Distance
x
Map
Scale
=
4,8
cm
x
0,5
km
=
2,4
km
Range
[2,3
km
to
2,5
km]
(3
x
1)
(3)
2.2
Determine
the
present
magnetic
bearing
of
trigonometrical
station
290
in
block
F8
from
trigonometrical
station
292
in
block
D9.
n
declinatio
magnetic
present
bearing
true
bearing
magnetic
Present
:
Formula
+
=
True
bearing
=
203
°
(201
o
–
205
°
)
Difference
in
years
=
2014
–
2001
=
13
years
Mean
annual
change
=
9'W
Total
change
=
13
x
9'W
=
117'W
=
1
°
57'W
Magnetic
declination
in
2014
=
25
o
29'W
+1
°
57'W
=
26
o
86'W
=
27
o
26'W
Magnetic
bearing
=
203
°
+
27
o
26'
=
230
o
26'
Range
[228
o
26'
to
232
o
26']
(6
x
1)
(6)](https://image.slidesharecdn.com/mindtheseriesstudyguidegeographygrade12-230512090758-7aa84044/85/MIND-THE-SERIES-STUDY-GUIDE-GEOGRAPHY-GRADE-12-pdf-189-320.jpg)
![Appendix
© Department of Basic Education 2014
170 APPENDIX 1 Mind the Gap CAPS Grade 12 Geography
Geography/P2
7
DBE/2014
NSC
–
Grade
12
Exemplar
–
Memorandum
Copyright
reserved
Please
turn
over
2.3
Calculate
the
average
gradient
between
trigonometrical
station
290
in
block
F8
and
trigonometrical
station
292
in
block
D9.
Show
ALL
calculations.
equivalent
horisontal
interval
vertical
Gradient
:
Formula
=
VI
=
47,3
m
–
26,5
m
VI
=
47,3
m
–
26,5
m
=
20,8
m
=
20,8
m
HE
=
5,9
cm
x
500
m
OR
HE
=
5,9
cm
x
10
000
cm
100
100
=
2
950
m
=
2
950
m
Gradient
=
20,8_
Gradient
=
20,8
2
950
2
950
=
1
_
=
_
1__
141,8
141,8
=
1:141,8
=
1:141,8
Range
[1:139
to
1:144,2]
(6
x
1)
(6)
2.4
Refer
to
the
cross-section
from
spot
height
24
in
block
F7
to
trigonometrical
station
number
290
in
block
F8
below
and
answer
the
questions
that
follow.
2.4.1
If
you
stand
at
A,
will
you
be
able
to
see
a
person
at
B?
Yes
(1
x
1)
(1)
2.4.2
Give
ONE
reason
for
your
answer
to
QUESTION
2.4.1.
No
obstructions/high
lying
areas
between
the
two
points.
[Concept]
(1
x
1)
(1)
∙24
B
A
∆290
Vertical
scale:
1
cm
represents
20
m
Geography/P2
8
DBE/2014
NSC
–
Grade
12
Exemplar
–
Memorandum
Copyright
reserved
Please
turn
over
2.4.3
Calculate
the
vertical
exaggeration
of
the
cross-section.
Show
ALL
calculations.
scale
horisontal
scale
vertical
on
exaggerati
tical
Ver
:
Formula
=
Vertical
Exaggeration
=
Vertical
Scale
Horizontal
Scale
=
1:2
000
1:50
000
=
1__
x
50
000
2
000
1
=
25
1
=
25
times
(3
x
1)
(3)
[20]](https://image.slidesharecdn.com/mindtheseriesstudyguidegeographygrade12-230512090758-7aa84044/85/MIND-THE-SERIES-STUDY-GUIDE-GEOGRAPHY-GRADE-12-pdf-190-320.jpg)
![Appendix
© Department of Basic Education 2014
Mind the Gap CAPS Grade 12 Geography APPENDIX 1 171
Geography/P2
9
DBE/2014
NSC
–
Grade
12
Exemplar
–
Memorandum
Copyright
reserved
Please
turn
over
QUESTION
3:
APPLICATION
AND
INTERPRETATION
3.1
Refer
to
points
3
and
4
on
the
orthophoto
map.
3.1.1
Name
the
landform
that
is
found
between
points
3
and
4
on
the
orthophoto
map.
(River)
valley
(1
x
1)
(1)
3.1.2
Name
the
type
of
wind
that
will
occur
at
this
landform
during
the
night.
Katabatic/downslope/mountain
breeze
(1
x
2)
(2)
3.1.3
Draw
a
simple,
labelled
free-hand
cross-section
to
show
the
wind
identified
in
QUESTION
3.1.2.
(1
x
2)
(2)
3.2
In
which
stage
of
development
is
Krom
River
in
block
I5?
Give
a
reason
for
your
answer.
Stage:
Plain
stage/old
age
stage/lower
course
Reason:
There
are
braided
streams
Wide
flood
plain
It
is
next
to
the
ocean
[Any
ONE]
(1
+
2)
(3)
3.3
Give
a
possible
explanation
why
so
many
marshes
developed
in
the
mapped
area.
Area
flat/gentle
slope
Water
does
not
drain
away
easily
Soil
is
saturated/waterlogged
[Any
ONE.
Accept
other
suitable
explanation]
(1
x
2)
(2)
Katabatic
Wind
Geography/P2
10
DBE/2014
NSC
–
Grade
12
Exemplar
–
Memorandum
Copyright
reserved
Please
turn
over
3.4
Study
the
table
below
showing
the
average
annual
midday
temperatures
for
areas
5
and
11
on
the
orthophoto
map
and
answer
the
question
that
follows.
Area
11
Area
5
24,5
°C
19
°C
Area
11
has
a
higher
average
temperature
than
area
5.
Give
ONE
possible
reason
for
this
difference
in
temperature.
Area
11
is
an
urban
area
and
area
5
is
a
rural
area
Area
11
is
made
up
of
artificial
surfaces
(concrete,
steel,
tar)
and
area
5
of
vegetation
Natural
processes
e.g.
evapotranspiration
occurs
at
5,
but
are
limited
at
11
More
pollution
at
11
to
trap
heat
than
at
5
More
artificial
heating
at
11
than
at
5
[Any
ONE-
Accept
other
answers
related
to
urban
heat
islands]
(1
x
2)
(2)
3.5
Find
residential
zone
12
on
the
orthophoto
map.
Also
refer
to
the
topographical
map.
Is
residential
area
12
a
high-
or
low-income
residential
area?
Give
a
reason
for
your
answer.
Income
area:
Low-income
residential
area
Reason:
It
has
small
plots
It
has
high
density
housing
[Any
ONE.
Accept
other
suitable
reasons]
(1
+
2)
(3)
3.6
State
whether
zone
10
on
the
orthophoto
map
is
a
light
or
heavy
industrial
area.
Give
a
reason
for
your
answer.
Type
of
industrial
area:
Heavy
industry
Reason:
It
is
found
on
the
outskirts
of
town
Flat
land
Space
for
expansion
[Any
ONE.
Accept
other
suitable
reasons]
(1
+
2)
(3)
3.7
Jeffreys
Bay
has
a
roughly
linear
shape.
Explain
why
this
is
the
case.
Follows
the
shape
of
the
coastline
Suburbs
develop
as
close
as
possible
to
the
coastline
Residents
prefer
a
sea
view
Settlement
wants
to
take
advantage
of
the
cooling
effect
of
the
sea
breeze
[Any
TWO]
(2
x
2)
(4)
3.8
Refer
to
FIGURE
1
on
page
3.
Is
FIGURE
1
a
political
or
thematic
map?
Give
a
reason
for
your
answer.
Type
of
map:
Thematic
map
Reason:
Focuses
on
a
specific
theme
and
that
is
population
density
[Concept]
(1
+
2)
(3)
[25]](https://image.slidesharecdn.com/mindtheseriesstudyguidegeographygrade12-230512090758-7aa84044/85/MIND-THE-SERIES-STUDY-GUIDE-GEOGRAPHY-GRADE-12-pdf-191-320.jpg)
![Appendix
© Department of Basic Education 2014
172 APPENDIX 1 Mind the Gap CAPS Grade 12 Geography
Geography/P2
11
DBE/2014
NSC
–
Grade
12
Exemplar
–
Memorandum
Copyright
reserved
Please
turn
over
QUESTION
4:
GEOGRAPHICAL
INFORMATION
SYSTEMS
(GIS)
4.1
Refer
to
the
images
below
illustrating
spatial
resolution
and
answer
the
questions
that
follow.
4.1.1
Define
the
term
spatial
resolution.
It
describes
the
amount
of
detail
shown
by
a
map
or
image
[Concept]
(1
x
1)
(1)
4.1.2
Which
image,
A
or
B,
has
a
better
spatial
resolution?
Give
a
reason
for
your
answer.
Image:
B
Reason:
It
has
smaller
and
more
pixels
It
has
more
detail
[Any
ONE
reason]
(1
+
2)
(3)
4.2
Buffering
plays
an
important
role
in
flood
prevention
at
Kleinriviermond
(Klein
River
mouth)
in
block
I6.
4.2.1
Define
the
term
buffering.
A
line
used
to
demarcate
an
area
around
a
spatial
feature
[Concept]
(1
x
1)
(1)
A
B
Geography/P2
12
DBE/2014
NSC
–
Grade
12
Exemplar
–
Memorandum
Copyright
reserved
4.2.2
You
want
to
build
a
holiday
resort
near
Kromriviermond
(Krom
River
mouth),
but
you
are
concerned
about
the
Krom
River
flooding.
Explain
how
you
could
use
buffering
to
assist
you
with
this
problem.
One
could
use
buffering
to
demarcate
the
area
around
the
river
where
flooding
could
occur
and
build
outside
this
area
(1
x
2)
(2)
4.3
Refer
to
block
E7
on
the
topographical
map.
4.3.1
Identify
the
following
in
block
E7:
(a)
A
point
feature:
Reservoir
Windmill
[Any
ONE]
(1
x
1)
(1)
(b)
A
line
feature:
Secondary
road
Other
road
River/stream
Dam
wall
Contour
line
[Any
ONE]
(1
x
1)
(1)
(c)
An
area/polygon
feature:
Dam
Perennial
water
Non-perennial
water
[Any
ONE]
(1
x
1)
(1)
4.4
You
are
asked
to
do
a
paper
GIS
to
determine
the
accessibility
of
Humansdorp.
Name
the
main
data
layer
you
would
use
in
your
investigation
and
give
a
reason
for
your
answer.
Main
layer:
Transport/roads
Reason:
Accessibility
determined
by
transport
infrastructure
as
transport
networks
are
needed
to
reach
Humansdorp
[Concept]
(1
+
2)
(3)
4.5
Explain
why
data
manipulation
is
important
in
a
GIS.
Data
manipulation
involves
getting
the
different
data
sources
into
a
format
that
can
be
integrated
When
all
the
data
layers
are
in
similar
data
files
the
data
can
be
integrated
(put
together)
Statistical
information
must
be
manipulated
into
such
a
file
format
that
it
can
be
used
in
the
GIS
software
and
linked
to
specific
spatial
features
Errors
in
the
database
can
be
eliminated
during
manipulation
[Any
ONE.
Concept]
(1
x
2)
(2)
TOTAL:
75](https://image.slidesharecdn.com/mindtheseriesstudyguidegeographygrade12-230512090758-7aa84044/85/MIND-THE-SERIES-STUDY-GUIDE-GEOGRAPHY-GRADE-12-pdf-192-320.jpg)

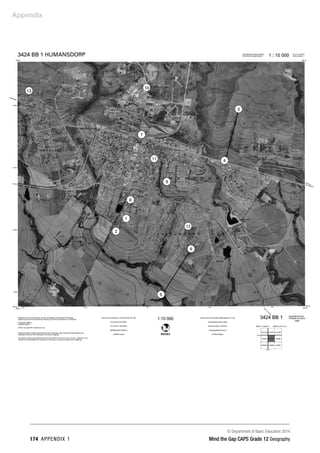
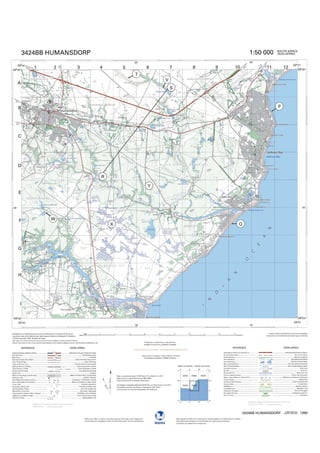


![Water Cycle[1] Power Point](https://cdn.slidesharecdn.com/ss_thumbnails/watercycle1power-point-1216950873012568-9-thumbnail.jpg?width=640&height=640&fit=bounds)