Download as PDF, PPTX
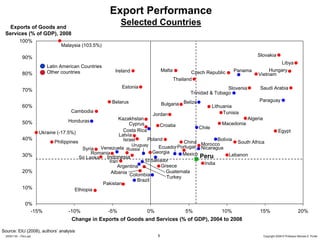
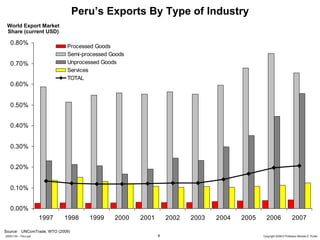
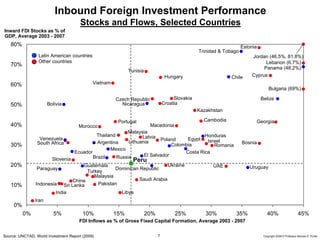
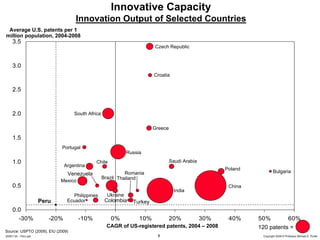
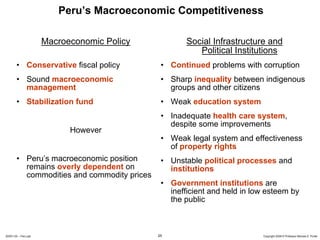
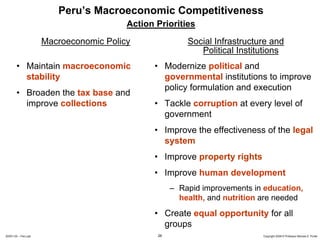
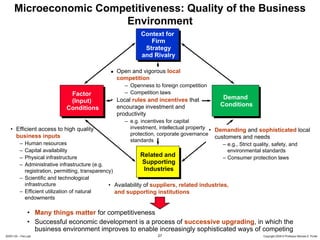
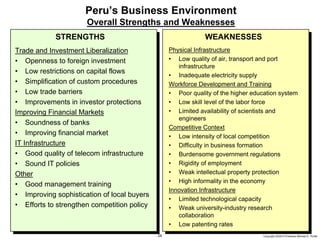
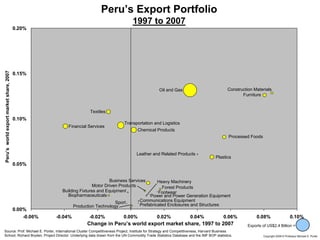
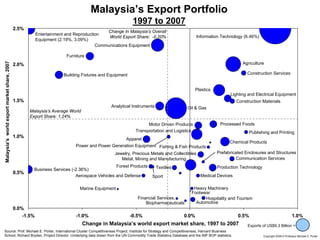
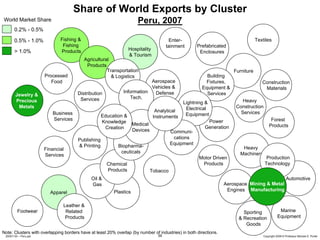
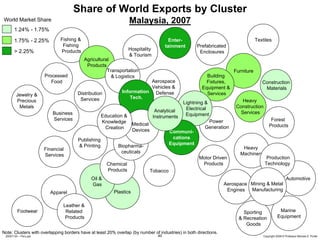

Professor Michael E. Porter's presentation outlines Peru's economic landscape and highlights the country's low competitiveness despite recent growth. It emphasizes the need for substantial improvements in productivity, innovation, and social infrastructure to boost economic diversification and reduce poverty. Key strategies include enhancing macroeconomic stability, addressing corruption, and improving education and health systems to create a more productive economy.