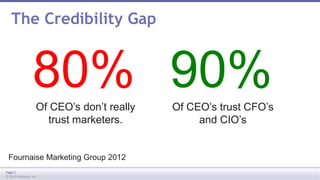
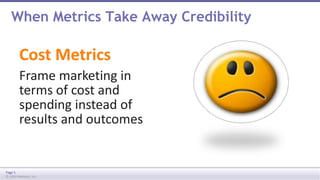
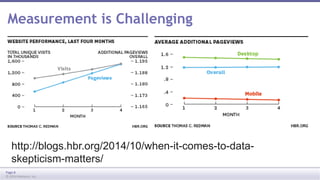
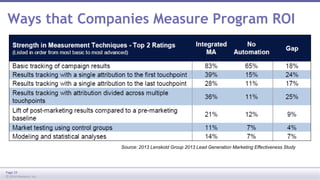
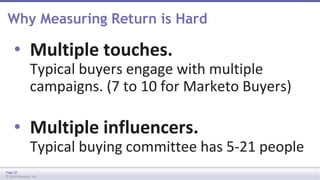
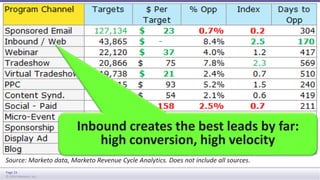
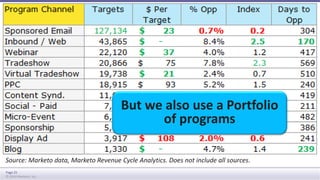
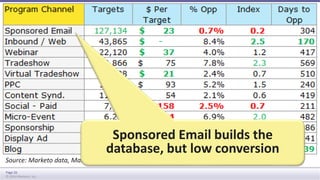
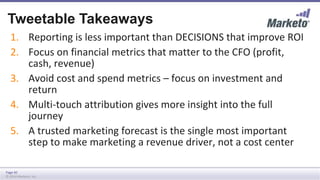
© 2014 Marketo, Inc. Marketo Proprietary and Confidential 
© 2014 Marketo, Inc. 
Metrics and Analytics 
How to Harness the Power of Data to Build 
Marketing Credibility
Topics 
• Building Marketing 
Credibility 
• The Right Metrics 
Page 2 
© 2014 Marketo, Inc. 
• Revenue Metrics 
• Marketing Program 
Performance
The Credibility Gap 
80% 
Of CEO’s don’t really 
Fournaise Marketing Group 2012 
Page 3 
© 2014 Marketo, Inc. 
trust marketers. 
90% 
Of CEO’s trust CFO’s 
and CIO’s
When Metrics Take Away Credibility 
Vanity Metrics 
Sound good and impress people, 
but don’t measure impact on 
revenue or profitability 
Page 4 
© 2014 Marketo, Inc.
When Metrics Take Away Credibility 
Cost Metrics 
Frame marketing in 
terms of cost and 
spending instead of 
results and outcomes 
Page 5 
© 2014 Marketo, Inc.
Metrics That Give Marketing Power 
“Speak the Language of Business” 
Journey Metrics 
and Forecasts 
Aggregate impact on 
company revenue; 
pipeline performance; 
predictive forecasts 
Page 6 
© 2014 Marketo, Inc.
Metrics That Give Marketing Power 
“Speak the Language of Business” 
Program 
Performance 
Incremental revenue 
contribution and ROI of 
individual marketing 
programs 
Page 7 
© 2014 Marketo, Inc.
Measurement is Challenging 
http://blogs.hbr.org/2014/10/when-it-comes-to-data-skepticism- 
Page 8 
© 2014 Marketo, Inc. 
matters/
Journey Metrics 
© 2014 Marketo, Inc. Marketo Proprietary and Confidential
Page 10 
© 2014 Marketo, Inc. 
Name 
Awareness 
Friend 
Engaged 
Target 
TOFU MOFU 
Opportunity Customer 
Lead 
Sales 
Lead 
Nurturing 
Database 
BOFU
Page 11 
© 2014 Marketo, Inc. 
Awareness 
Web Visitor 
In-person 
Appointment 
Converted 
Engaged 
Nurturing 
Database
Journey Modeler 
Screenshot: Marketo Revenue Cycle Analytics 
Page 12 
© 2014 Marketo, Inc.
Journey Modeler 
Screenshot: 
Marketo Revenue 
Cycle Analytics 
Page 13 
© 2014 Marketo, Inc.
Screenshot: Marketo Revenue Cycle Analytics 
Page 14 
© 2014 Marketo, Inc.
Page 15 
© 2014 Marketo, Inc.
Revenue Cycle Modeler 
Screenshot: Marketo Revenue Cycle Analytics 
Page 16 
© 2014 Marketo, Inc. 
# # # # # $ $
Program Performance 
© 2014 Marketo, Inc. Marketo Proprietary and Confidential
Page 18 
© 2014 Marketo, Inc.
Ways that Companies Measure Program ROI 
Page 19 
© 2014 Marketo, Inc. 
Source: 2013 Lenskold Group 2013 Lead Generation Marketing Effectiveness Study
Why Measuring Return is Hard 
• Multiple touches. 
Typical buyers engage with multiple 
campaigns. (7 to 10 for Marketo Buyers) 
• Multiple influencers. 
Typical buying committee has 5-21 people 
Page 20 
© 2014 Marketo, Inc.
Page 21 
© 2014 Marketo, Inc. 
First Touch
Source: Marketo data, Marketo Revenue Cycle Analytics. Does not include all sources. 
Page 22 
© 2014 Marketo, Inc.
Source: Marketo data, Marketo Revenue Cycle Analytics. Does not include all sources. 
Page 23 
© 2014 Marketo, Inc.
Source: Marketo data, Marketo Revenue Cycle Analytics. Does not include all sources. 
Page 24 
© 2014 Marketo, Inc. 
Inbound creates the best leads by far: 
high conversion, high velocity
Source: Marketo data, Marketo Revenue Cycle Analytics. Does not include all sources. 
Page 25 
© 2014 Marketo, Inc. 
But we also use a Portfolio 
of programs
Source: Marketo data, Marketo Revenue Cycle Analytics. Does not include all sources. 
Page 26 
© 2014 Marketo, Inc. 
Sponsored Email builds the 
database, but low conversion
Source: Marketo data, Marketo Revenue Cycle Analytics. Does not include all sources. 
Page 27 
© 2014 Marketo, Inc. 
Webinar, tradeshow, PPC, and virtual 
tradeshow are top paid TOFU
Source: Marketo data, Marketo Revenue Cycle Analytics. Does not include all sources. 
Page 28 
© 2014 Marketo, Inc. 
Paid Social & Display Ad drive 
brand and amplify inbound as well
Source: Marketo data, Marketo Revenue Cycle Analytics. Does not include all sources. 
Page 29 
© 2014 Marketo, Inc. 
Average days to 
Opportunity: 327
Page 30 
© 2014 Marketo, Inc. 
Multi-Touch
Track All Touches Across People 
Screenshot: Marketo Revenue Cycle Analytics 
Page 31 
© 2014 Marketo, Inc.
Track All Touches Across People 
Screenshot: Marketo Revenue Cycle Analytics 
Page 32 
© 2014 Marketo, Inc.
Example: Multi-Touch Attribution 
A deal worth $100,000 recently closed. 
Three people were involved in the deal: 
• Person A attended Seminar A and Trade Show B 
• Person B attended Trade Show B 
• Person C was sent Direct Mail C 
Page 33 
© 2014 Marketo, Inc. 
$100,000 Revenue 
$25,000 $25,000 $25,000 $25,000 
Seminar A 
$25,000 
Tradeshow B 
$50,000 
Direct Mail C 
$25,000
Page 34 
© 2014 Marketo, Inc. 
Screenshot: 
Marketo 
Revenue Cycle 
Analytics
Page 35 
© 2014 Marketo, Inc.
Source: Marketo Revenue Cycle Analytics, Apr 2014 
* Percentage of all programs in channel that achieve MT Ratio > 5 
Page 36 
© 2014 Marketo, Inc.
Source: Marketo Revenue Cycle Analytics, Apr 2014 
* Percentage of all programs in channel that achieve MT Ratio > 5 
Page 37 
© 2014 Marketo, Inc. 
Inbound + Nurture = 58% of (MT) Pipeline 
Paid Programs = 42% of (MT) Pipeline
Source: Marketo Revenue Cycle Analytics, Apr 2014 
* Percentage of all programs in channel that achieve MT Ratio > 5 
Page 38 
© 2014 Marketo, Inc. 
(MT) Ratio = Pipeline / 
Investment 
>10 is Great and <5 is Fail 
Sponsored Email = 12.8, Tradeshow = 10.6, 
PPC = 13.0, Webinars = 25.4, Field Events = 
6.6, Content Syndication 7.7
Source: Marketo Revenue Cycle Analytics, Apr 2014 
* Percentage of all programs in channel that achieve MT Ratio > 5 
Page 39 
© 2014 Marketo, Inc. 
% Programs with MT Ratio > 5 
e.g. Tradeshow has good average 
but 49% programs “fail”
Tweetable Takeaways 
1. Reporting is less important than DECISIONS that improve ROI 
2. Focus on financial metrics that matter to the CFO (profit, 
cash, revenue) 
3. Avoid cost and spend metrics – focus on investment and 
return 
4. Multi-touch attribution gives more insight into the full 
journey 
5. A trusted marketing forecast is the single most important 
step to make marketing a revenue driver, not a cost center 
Page 40 
© 2014 Marketo, Inc.

Metrics and Analytics: How to Harness the Power of Data to Build Marketing Credibility - Michael Berger

  • 1.
    © 2014 Marketo,Inc. Marketo Proprietary and Confidential © 2014 Marketo, Inc. Metrics and Analytics How to Harness the Power of Data to Build Marketing Credibility
  • 2.
    Topics • BuildingMarketing Credibility • The Right Metrics Page 2 © 2014 Marketo, Inc. • Revenue Metrics • Marketing Program Performance
  • 3.
    The Credibility Gap 80% Of CEO’s don’t really Fournaise Marketing Group 2012 Page 3 © 2014 Marketo, Inc. trust marketers. 90% Of CEO’s trust CFO’s and CIO’s
  • 4.
    When Metrics TakeAway Credibility Vanity Metrics Sound good and impress people, but don’t measure impact on revenue or profitability Page 4 © 2014 Marketo, Inc.
  • 5.
    When Metrics TakeAway Credibility Cost Metrics Frame marketing in terms of cost and spending instead of results and outcomes Page 5 © 2014 Marketo, Inc.
  • 6.
    Metrics That GiveMarketing Power “Speak the Language of Business” Journey Metrics and Forecasts Aggregate impact on company revenue; pipeline performance; predictive forecasts Page 6 © 2014 Marketo, Inc.
  • 7.
    Metrics That GiveMarketing Power “Speak the Language of Business” Program Performance Incremental revenue contribution and ROI of individual marketing programs Page 7 © 2014 Marketo, Inc.
  • 8.
    Measurement is Challenging http://blogs.hbr.org/2014/10/when-it-comes-to-data-skepticism- Page 8 © 2014 Marketo, Inc. matters/
  • 9.
    Journey Metrics ©2014 Marketo, Inc. Marketo Proprietary and Confidential
  • 10.
    Page 10 ©2014 Marketo, Inc. Name Awareness Friend Engaged Target TOFU MOFU Opportunity Customer Lead Sales Lead Nurturing Database BOFU
  • 11.
    Page 11 ©2014 Marketo, Inc. Awareness Web Visitor In-person Appointment Converted Engaged Nurturing Database
  • 12.
    Journey Modeler Screenshot:Marketo Revenue Cycle Analytics Page 12 © 2014 Marketo, Inc.
  • 13.
    Journey Modeler Screenshot: Marketo Revenue Cycle Analytics Page 13 © 2014 Marketo, Inc.
  • 14.
    Screenshot: Marketo RevenueCycle Analytics Page 14 © 2014 Marketo, Inc.
  • 15.
    Page 15 ©2014 Marketo, Inc.
  • 16.
    Revenue Cycle Modeler Screenshot: Marketo Revenue Cycle Analytics Page 16 © 2014 Marketo, Inc. # # # # # $ $
  • 17.
    Program Performance ©2014 Marketo, Inc. Marketo Proprietary and Confidential
  • 18.
    Page 18 ©2014 Marketo, Inc.
  • 19.
    Ways that CompaniesMeasure Program ROI Page 19 © 2014 Marketo, Inc. Source: 2013 Lenskold Group 2013 Lead Generation Marketing Effectiveness Study
  • 20.
    Why Measuring Returnis Hard • Multiple touches. Typical buyers engage with multiple campaigns. (7 to 10 for Marketo Buyers) • Multiple influencers. Typical buying committee has 5-21 people Page 20 © 2014 Marketo, Inc.
  • 21.
    Page 21 ©2014 Marketo, Inc. First Touch
  • 22.
    Source: Marketo data,Marketo Revenue Cycle Analytics. Does not include all sources. Page 22 © 2014 Marketo, Inc.
  • 23.
    Source: Marketo data,Marketo Revenue Cycle Analytics. Does not include all sources. Page 23 © 2014 Marketo, Inc.
  • 24.
    Source: Marketo data,Marketo Revenue Cycle Analytics. Does not include all sources. Page 24 © 2014 Marketo, Inc. Inbound creates the best leads by far: high conversion, high velocity
  • 25.
    Source: Marketo data,Marketo Revenue Cycle Analytics. Does not include all sources. Page 25 © 2014 Marketo, Inc. But we also use a Portfolio of programs
  • 26.
    Source: Marketo data,Marketo Revenue Cycle Analytics. Does not include all sources. Page 26 © 2014 Marketo, Inc. Sponsored Email builds the database, but low conversion
  • 27.
    Source: Marketo data,Marketo Revenue Cycle Analytics. Does not include all sources. Page 27 © 2014 Marketo, Inc. Webinar, tradeshow, PPC, and virtual tradeshow are top paid TOFU
  • 28.
    Source: Marketo data,Marketo Revenue Cycle Analytics. Does not include all sources. Page 28 © 2014 Marketo, Inc. Paid Social & Display Ad drive brand and amplify inbound as well
  • 29.
    Source: Marketo data,Marketo Revenue Cycle Analytics. Does not include all sources. Page 29 © 2014 Marketo, Inc. Average days to Opportunity: 327
  • 30.
    Page 30 ©2014 Marketo, Inc. Multi-Touch
  • 31.
    Track All TouchesAcross People Screenshot: Marketo Revenue Cycle Analytics Page 31 © 2014 Marketo, Inc.
  • 32.
    Track All TouchesAcross People Screenshot: Marketo Revenue Cycle Analytics Page 32 © 2014 Marketo, Inc.
  • 33.
    Example: Multi-Touch Attribution A deal worth $100,000 recently closed. Three people were involved in the deal: • Person A attended Seminar A and Trade Show B • Person B attended Trade Show B • Person C was sent Direct Mail C Page 33 © 2014 Marketo, Inc. $100,000 Revenue $25,000 $25,000 $25,000 $25,000 Seminar A $25,000 Tradeshow B $50,000 Direct Mail C $25,000
  • 34.
    Page 34 ©2014 Marketo, Inc. Screenshot: Marketo Revenue Cycle Analytics
  • 35.
    Page 35 ©2014 Marketo, Inc.
  • 36.
    Source: Marketo RevenueCycle Analytics, Apr 2014 * Percentage of all programs in channel that achieve MT Ratio > 5 Page 36 © 2014 Marketo, Inc.
  • 37.
    Source: Marketo RevenueCycle Analytics, Apr 2014 * Percentage of all programs in channel that achieve MT Ratio > 5 Page 37 © 2014 Marketo, Inc. Inbound + Nurture = 58% of (MT) Pipeline Paid Programs = 42% of (MT) Pipeline
  • 38.
    Source: Marketo RevenueCycle Analytics, Apr 2014 * Percentage of all programs in channel that achieve MT Ratio > 5 Page 38 © 2014 Marketo, Inc. (MT) Ratio = Pipeline / Investment >10 is Great and <5 is Fail Sponsored Email = 12.8, Tradeshow = 10.6, PPC = 13.0, Webinars = 25.4, Field Events = 6.6, Content Syndication 7.7
  • 39.
    Source: Marketo RevenueCycle Analytics, Apr 2014 * Percentage of all programs in channel that achieve MT Ratio > 5 Page 39 © 2014 Marketo, Inc. % Programs with MT Ratio > 5 e.g. Tradeshow has good average but 49% programs “fail”
  • 40.
    Tweetable Takeaways 1.Reporting is less important than DECISIONS that improve ROI 2. Focus on financial metrics that matter to the CFO (profit, cash, revenue) 3. Avoid cost and spend metrics – focus on investment and return 4. Multi-touch attribution gives more insight into the full journey 5. A trusted marketing forecast is the single most important step to make marketing a revenue driver, not a cost center Page 40 © 2014 Marketo, Inc.

Editor's Notes

  • #2 ©2006 Marketo, Inc. CONFIDENTIAL
  • #3 Over the next 40 minutes or so, my goal is to show you how to earn your own seat at the revenue table. I’ll also illustrate all these points using many of Marketo’s the actual metrics Topics:
  • #4 To begin, do you know what profits a 10% increase in your marketing budget would generate? According to the Lenskold Group’, the most common answer to this question is “I Don’t Know.” Forty-four percent of marketers have no idea what a budget increase could do for their companies. If you fit into this 44%, you’ll experience difficulty protecting your budget and will likely find yourself asking the question the other way around: “What will happen now that my budget has been decreased by 10%?” You can’t expect your organization to place value on something you’re unable to quantify. But when you do use the right metrics and processes, there is nothing more powerful to help marketing earn it’s rightful seat at the revenue table. That’s why the Definitive Guide delivers the strategies and methodologies you’ll need to measure and improve ROI. So let’s dive in.
  • #5 To begin, what are the WRONG metrics? Vanity metrics Too often, marketers rely on “feel good” measurements to justify their marketing spend. Instead of pursuing metrics that measure business outcomes and improve marketing performance and profitability, they opt for metrics that sound good and impress people. Some common examples include press release impressions, Facebook “Likes”, and names gathered at tradeshows. True story – 38K twitter followers. Value? 400 people attended Revenue Rockstar…. OK… better is 400 people attended, X customers, y prospects. Based on this, we expect to create $1.1M ppipeline and influence / accelerate $YY more. Measuring Activity, not Results = Focusing on quantity, not quality Marketing activity is easy to see and measure (costs going out the door), but Marketing results are hard to measure. In contrast, Sales activity is hard to measure, but Sales results (revenue coming in) are easy to measure. Is it any wonder, then, that Sales tends to get the credit for revenue, but Marketing is perceived as a cost center? Results convince finance and senior management that Marketing delivers quantifiable value. Activity metrics are likely to produce questions from the CFO and other financially-oriented executives; they are no defense against efforts to prune your budget in difficult times.
  • #6 Cost metrics The worst kinds of metrics to use are “cost metrics” because they frame Marketing as cost center. If you only talk about cost and budgets, then no doubt others will associate your activities with cost. As an example, let’s take a marketer who improved cost per lead by $10. Based on these great results, he went to the CEO to ask for budget. Did the marketer get his budget? No. The CEO decided the reduced lead cost meant marketing could deliver the same results with fewer dollars – and so she cut the marketing budget and used the extra funds to hire new sales people. What went wrong here? The marketer performed well, but he made the mistake of not connecting his marketing results to bottom-line metrics that mattered to the CEO. By framing his results in terms of costs, he perpetuated the perception that marketing is a cost center. Within this context, it’s only natural that the CEO would reduce costs and reallocate the extra budget to a “revenue generating” department such as sales.
  • #11 With this change, marketing has the opportunity to seize the day and take a much larger share of revenue – since Marketing is responsible for that 70%. Requires Marketing to think as rigorously about their process as Sales typically thinks about their. Here’s Marketo’s…. Let me explain.
  • #13 Model Note Success Path and Detours; Inventory and SLAs
  • #14 Model Note Success Path and Detours; Inventory and SLAs
  • #15 We get this report, which is like Google Analytics for revenue. For each of those stages I can see how many people are in there, and what is the flow from stage to stage, as well as the velocity at which people are moving between them. Conversion rates and velocities. And I can see this over time so we can understand the trends, and even compare them to previous periods. Having this data at your fingertips is so powerful for a marketer, because it really lets us understand the dynamics of the revenue process.
  • #17 We know because we mapped the same pipeline we just saw in our product. This is the revenue cycle modeler in Marketo, and the stages across the green section represent the funnel stages we looked at before, so you see targets, leads and opportunities. Some stages are boxes because people can stay in those stages indefinitely, some are clocks, meaning there are SLA’s. Once this is setup and it begins tracking movement.
  • #19 Let’s talk about measuring what the CXO cares about.. While you may not be doing all this analysis now, you most likely will in their future. [Be sure to focus on this point a lot so you don’t lose them.] ROI: First investment – then revenue Measure ROI to find not just what works, but what works better Establish goals upfront Make sure programs are measureable Focus on decisions that improve ROI
  • #23 Explain
  • #24 We create a ton of content… go to marketo.com/resources
  • #32 Step 1: Important to track all touches
  • #33 Step 1: Important to track all touches
  • #37 Here we see what works for Marketo (over the last 12) 58% of pipeline from Inbound activities
  • #38 Here we see what works for Marketo (over the last 12) 58% of pipeline from Inbound activities
  • #39 Here we see what works for Marketo (over the last 12) 58% of pipeline from Inbound activities
  • #40 Here we see what works for Marketo (over the last 12) 58% of pipeline from Inbound activities