This document presents a study investigating patterns of genetic differentiation among populations of blackcaps (Sylvia atricapilla) with divergent migratory orientations in Europe. The study analyzed variation at microsatellite markers in over 500 blackcaps from 12 populations across Europe. The populations exhibited different migratory strategies, including southwest/southeast and northwest/southwest divides. The results found little genetic differentiation between southwest and southeast migrating populations, suggesting gene flow occurs across the large migratory divide region. In contrast, populations with northwest versus southwest migration in southern Germany showed significant but weak genetic differentiation, indicating a stronger isolating mechanism. Patterns of isolation-by-distance also differed between eastern and western blackcap populations. The genetic structure provides
![Contrasting Patterns of Genetic Differentiation among
Blackcaps (Sylvia atricapilla) with Divergent Migratory
Orientations in Europe
Raeann Mettler1*
, H. Martin Schaefer1
, Nikita Chernetsov2
, Wolfgang Fiedler3,4
, Keith A. Hobson5
, Mihaela
Ilieva6
, Elisabeth Imhof7
, Arild Johnsen8
, Swen C. Renner9,10
, Gregor Rolshausen11
, David Serrano12
,
Tomasz Wesołowski13
, Gernot Segelbacher7
1 Department of Evolutionary Biology and Animal Ecology, University of Freiburg, Freiburg, Germany, 2 Biological Station Rybachy, Zoological Institute,
Rybachy, Kaliningrad Region, Russia, 3 Max Planck Institute for Ornithology, Vogelwarte, Radolfzell, Germany, 4 University of Konstanz, Department of Biology,
Konstanz, Germany, 5 Environment Canada, Science and Technology Branch, Saskatoon, Saskatchewan, Canada, 6 Institute of Biodiversity and Ecosystem
Research, Bulgarian Academy of Sciences, Sofia, Bulgaria, 7 Wildlife Ecology and Management, University of Freiburg, Freiburg, Germany, 8 Natural History
Museum, University of Oslo, Oslo, Norway, 9 Institute of Experimental Ecology, Ulm University, Ulm, Germany, 10 Smithsonian Conservation Biology Institute,
Front Royal, United States of America, 11 Redpath Museum & Department of Biology, McGill University, Montreal, Quebec, Canada, 12 Department of
Conservation Biology, Estación Biológica de Doñana (EBD-CSIC), Sevilla, Spain, 13 Laboratory of Forest Biology, Wrocław University, Wrocław, Poland
Abstract
Migratory divides are thought to facilitate behavioral, ecological, and genetic divergence among populations with
different migratory routes. However, it is currently contentious how much genetic divergence is needed to maintain
distinct migratory behavior across migratory divides. Here we investigate patterns of neutral genetic differentiation
among Blackcap (Sylvia atricapilla) populations with different migratory strategies across Europe. We compare the
level of genetic divergence of populations migrating to southwestern (SW) or southeastern (SE) wintering areas with
birds wintering in the British Isles following a recently established northwesterly (NW) migration route. The migratory
divide between SW and SE wintering areas can be interpreted as a result of a re-colonization process after the last
glaciation. Thus we predicted greater levels of genetic differentiation among the SW/SE populations. However, a lack
of genetic differentiation was found between SW and SE populations, suggesting that interbreeding likely occurs
among Blackcaps with different migratory orientations across a large area; therefore the SW/SE migratory divide can
be seen as diffuse, broad band and is, at best, a weak isolating barrier. Conversely, weak, albeit significant genetic
differentiation was evident between NW and SW migrants breeding sympatrically in southern Germany, suggesting a
stronger isolating mechanism may be acting in this population. Populations located within/near the SW/SE contact
zone were the least genetically divergent from NW migrants, confirming NW migrants likely originated from within the
contact zone. Significant isolation-by-distance was found among eastern Blackcap populations (i.e. SE migrants), but
not among western populations (i.e. NW and SW migrants), revealing different patterns of genetic divergence among
Blackcap populations in Europe. We discuss possible explanations for the genetic structure of European Blackcaps
and how gene flow influences the persistence of divergent migratory behaviors.
Citation: Mettler R, Schaefer HM, Chernetsov N, Fiedler W, Hobson KA, et al. (2013) Contrasting Patterns of Genetic Differentiation among Blackcaps
(Sylvia atricapilla) with Divergent Migratory Orientations in Europe. PLoS ONE 8(11): e81365. doi:10.1371/journal.pone.0081365
Editor: Nicola Saino, University of Milan, Italy
Received July 5, 2013; Accepted October 11, 2013; Published November 21, 2013
Copyright: © 2013 Mettler et al. This is an open-access article distributed under the terms of the Creative Commons Attribution License, which permits
unrestricted use, distribution, and reproduction in any medium, provided the original author and source are credited.
Funding: This research was supported by a grant from the Deutsche Forschungsgemeinschaft to H. M. Schaefer (grant Scha 1008/6-1), an operating
grant from Environment Canada to K. A. Hobson, an internal grant from Wrocław University to T. Wesołowski (grant 1067/S/PBLas/2012), a project grant
from the Bulgarian Science Fund (grant DO02-277), and by the Deutsche Ornithologen-Gesellschaft. The funders had no role in study design, data
collection and analysis, decision to publish, or preparation of the manuscript.
Competing interests: The authors have declared that no competing interests exist.
* E-mail: raeann.mettler@gmail.com
Introduction
Patterns of geographic isolation during the Pleistocene in
temperate areas have allowed behavioral, ecological, and
genetic divergence among geographically isolated populations
in a range of taxa [1,2]. However, panmixia is often found
within highly mobile vertebrate populations, despite presumed
geographic barriers to dispersal and divergent migratory
pathways [3–5]. While geographic barriers are instrumental in
the formation of initial reproductive isolation, further isolating
barriers are needed for continued genetic divergence in the
PLOS ONE | www.plosone.org 1 November 2013 | Volume 8 | Issue 11 | e81365](https://image.slidesharecdn.com/cf6eb9e8-ea4c-4046-9bac-6e0428e49079-160505001609/85/Mettler_et_al_2013-1-320.jpg)
![face of gene flow, for example in the case of secondary contact
between previously isolated populations at contact zones [6].
Migratory divides represent the locations at which
populations maintain divergent migratory routes, often
originating during periods of allopatry, but can also evolve into
hybrid zones as a result of secondary contact and
interbreeding between populations [7]. If isolating barriers are
sufficiently strong to maintain some degree of reproductive
isolation between divergent populations, the level of genetic
divergence among populations with distinct migratory routes
may be high [8]. However, migratory divides are also known to
be leaky barriers to gene flow, despite divergent migratory
routes utilized by organisms, such as those found in migratory
butterflies [9] and birds [10,11]. Where interbreeding does
occur between different migrant types, it is hypothesized that
migratory divides can also represent hybrid zones maintained
by selection against hybrids as a form of reproductive isolation
[12–14]. While migratory behavior does not appear to be a
strong isolation barrier, it is among the best examples of a
mechanism promoting adaptive microevolution [15,16]. For
example, assortative mating based upon allochronic spring
arrival to the breeding grounds can facilitate adaptive
microevolution in passerines and promote genetic divergence
within sympatric breeding populations [17–20] .
The Blackcap (Sylvia atricapilla) is a common European
passerine and serves as a model species to study the evolution
of migratory behavior because it spans the full spectrum of
migratory distances (from sedentary to long-distance
migrations) and migratory orientations. Several migratory traits
have been shown to be under genetic control in Blackcaps,
including timing of migration, direction, and duration/length of
migration [21–24], while moderate-to-high heritabilities have
been found for some of these traits in both wild and
experimental populations [15,22]. In central Europe, Blackcaps
exhibit a southwest/southeast (SW/SE) migratory divide
resulting from the geographic isolation of potential glacial
refugia in the Iberian Peninsula and Balkan Peninsula during
the Pleistocene, followed by post-glacial expansion [21,25–27].
Weak but significant genetic structure in mitochondrial DNA
(mtDNA) has been found to occur between Blackcap
populations sampled on opposing sides of this divide [28].
As recently as during the latter half of the last century, a
portion of SW migrant Blackcaps shifted their autumn migration
route to the northwest (NW), overwintering on the British Isles.
It has been hypothesized by Helbig [27] that these NW
migrants originated from within the SW/SE contact zone.
Currently a novel northwest/southwest (NW/SW) migratory
polymorphism exists where these different migrants breed
sympatrically in southern Germany [29]. This change in
orientation has facilitated rapid morphological, behavioral, and
genetic divergence between migrants from different wintering
grounds and may promote assortative mating as an isolating
barrier in sympatry [17,18,20,30]. In this study, we investigate
genetic variation in 12 populations of wild Blackcaps using 14
polymorphic microsatellite loci. Sampling sites spanned both
the historical SW/SE migratory divide in central Europe and the
novel NW/SW migratory polymorphism present in southern
Germany (Figure 1). By simultaneously characterizing levels of
neutral genetic differentiation across the SW/SE migratory
divide as well as the NW/SW polymorphism, we investigated
two competing hypotheses: 1) if the migratory divide represents
an adequate isolating barrier, genetic divergence between SW
and SE migrants should be detectable (as found in [28]) and,
given the long history of this divide, would be larger than that
found at the novel NW/SW migratory polymorphism; 2) if the
migratory divide is an incomplete barrier to gene flow, levels of
genetic divergence should be lower across the SW/SE
migratory divide (as found in other European passerines,
[12,31]) compared to the novel NW/SW migratory
polymorphism experiencing rapid, adaptive divergence in
sympatry [17,18,20].
Methods
Ethics Statement
Samples from the Schwäbische Alb (Münsingen) and
Freiburg have been collected under field work and animal
experiment permits granted by the responsible state
environmental offices of Baden-Württemberg (RPT
Tierversuch-Nr. 1056 and 55-8853.17/0, respectively).
Samples collected in Kefermarkt, Austria were approved from
the district Freistadt permit Nr. N10-75-2010. Sampling in
Rybachy (Russia) was performed under the license from
Kaliningrad Regional Agency for Protection, Reproduction and
Use of Animal World and Forests. Trapping and sampling
permits in Spain were granted by the Consejería de Medio
Ambiente of the government of Andalucía and in Bulgaria
under permit N243/1.03.2010 from Bulgarian Ministry of
Environment and Waters.
Sample collection and allocation
Blood samples from 502 Blackcaps were collected at 12
sample sites across Europe from 2001 - 2011 (Figure 1 and
Table 1). Individuals captured in Sevilla, Spain (Sv) during the
non-breeding season (January) were determined to be
overwintering, short-distance migrants based on two lines of
evidence: 1) Sevilla birds had relatively short wings compared
to other breeding populations in central Europe, thus travelled
a shorter distance during migration, and 2) they were found to
be genetically differentiated (at microsatellite loci) from resident
Spanish Blackcaps identified in a previous study [20]. The
remaining 11 sites were sampled during the breeding season
(Table 1). While we assume most to be breeding individuals
(supported by our ringing data (data not shown)), we cannot
rule out that some spring migrants may have been caught as
well. All birds captured at a single sampling site were
considered as populations in the following analyses.
Stable isotope values from avian tissues can be used to
discriminate between possible wintering grounds of migratory
birds in Europe [32]. In particular, stable hydrogen isotope
values (δ2
H) in keratins (claws and feathers) vary by latitude in
Europe and have been previously used to distinguish which
individuals winter at either northern or southern latitudes
among sympatrically breeding Blackcaps in southern Germany
[17,18,20]. To distinguish among NW and SW migrants
breeding sympatrically in the Freiburg, Germany (Fr)
Genetic Differentiation among European Blackcaps
PLOS ONE | www.plosone.org 2 November 2013 | Volume 8 | Issue 11 | e81365](https://image.slidesharecdn.com/cf6eb9e8-ea4c-4046-9bac-6e0428e49079-160505001609/85/Mettler_et_al_2013-2-320.jpg)
![population in this study, approximately 2 mm of claw material
was collected from Blackcaps in the spring of 2011 and
analyzed for δ2
H at the Environment Canada stable isotope
facility in Saskatoon, Canada, using the comparative
equilibrium method [33]. Claw δ2
H from eight Blackcaps caught
in Sevilla, Spain (in Jan. 2011) for this study was used as a
southern reference to identify SW migrants (mean δ2
H: -51.6‰,
SD: 5.8). Due to the observed interannual variation in claw δ2
H
Figure 1. Sampling localities of Blackcaps captured in Europe. Population codes: Sv = Sevilla, ES; Ub = Uebersyren, LU; Fr =
Freiburg, DE; Wh = Wilhelmshaven, DE; Mn = Münsingen, DE; Os = Oslo, NO; Kf = Kefermarkt, AT; Vn = Vienna, AT; Ry =
Rybachy, RU; Bw = Białowieża Forest, PL; Km = Kalimok, BG. Individuals collected in Freiburg, Germany (Fr), indicated with the
open symbol, were divided into populations of NW and SW migrants by stable isotope δ2
H values in claws. The thick, grey band
represents approximate location of SW/SE migratory divide, centered at 13°E (according to[25,27,50]). Degrees East and North are
shown on the X and Y axes, respectively.
doi: 10.1371/journal.pone.0081365.g001
Genetic Differentiation among European Blackcaps
PLOS ONE | www.plosone.org 3 November 2013 | Volume 8 | Issue 11 | e81365](https://image.slidesharecdn.com/cf6eb9e8-ea4c-4046-9bac-6e0428e49079-160505001609/85/Mettler_et_al_2013-3-320.jpg)
![and the absence of Blackcap reference claws from the British
Isles during the 2010-2011 winter, δ2
H was analyzed from
overwintering Blackcaps and other species (Cyanistes
caeruleus, Parus major, Fringilla coelebs, Prunella modularis,
Carduelis spinus) captured in Britain, Ireland and Scotland
between 2002-2010 as part of this study (unpublished) and a
previous study of Bearhop et al. [17]. We used the Bearhop et
al. [17] estimate of overwintering C. caeruleus and P. major
(2002-2003) as a northern reference (mean δ2
H: -94.3, SD:
4.9) and best approximation of the wintering ground signature
of NW migrants in this study. Blackcaps caught in Freiburg in
the spring of 2011 were assigned to wintering grounds using a
75% probability criterion based on reference claw δ2
H ( Figure
S1), as previously described in Rolshausen et al. [20].
In addition to Freiburg, Blackcaps from three other collecting
sites were analyzed for variation in claw δ2
H (Ub, Kf, and Bw –
see Figure S1). The distributions of δ2
H were found to differ
significantly among these four populations (Kruskal-Wallis P <
0.05). Apart from the Freiburg population (see above), only one
individual caught in Uebersyren, LU was marginally
categorized (78.4% probability) with a NW claw δ2
H value
among the other populations tested; therefore, we found little
indication of NW migrants present at these three additional
locations during spring sampling. Due to the lack of longitudinal
spatial resolution in claw δ2
H for birds in Europe, Blackcap
populations (excluding Fr) were therefore categorized as SW or
SE migrants using the approximate location of the SW/SE
migratory divide in central Europe found in other studies
[26–28] and published ring recoveries for this species
[25,34–36] as classification criteria. The autumn migratory
direction of Blackcaps breeding on the southern coast of
Norway (Os) likely encompasses a broad front spanning SW –
SE orientations [36,37] and so, while we initially analyzed this
population as SW migrants, we also repeated the analyses by
considering this population as SE migrants.
PCR and genotyping
Genomic DNA was extracted from blood samples using
DNeasy Blood and Tissue kits (Qiagen) following
manufacturer’s protocol. A total of 14 microsatellite markers
were utilized (Table S1), comprising nine markers developed
for this study (Syla1, Syla2, Syla3, Syla12, Syla14, Syla15,
Syla18, Syla19, Syla20 [38]) and five markers previously
developed for this species (Syl1, Syl2, Syl6, Syl9, and Syl10
[39]). Microsatellite loci were amplified with polymerase chain
reaction (PCR) for all individuals in 20µl reactions including: 1x
Qiagen CoralLoad Concentrate, 1x Qiagen PCR Buffer
(containing KCl and (NH4)2SO4), 0.25 µM labeled forward
primer, 0.25 µM reverse primer, 200 µM of each dNTP, 1.25 U
Qiagen Top Taq DNA polymerase, and 1.0µl DNA template.
Mastercycler Gradient Thermocyclers (Eppendorf GmbH,
Hamburg Germany) were used to run PCR under the following
conditions: initial denaturing at 94 °C for 5 min, followed by 20
cycles of 94°C for 30 s, 60°C for 30 s (decreased by 0.5°C per
cycle), and 72°C for 45 s, followed by 15 cycles of 94°C for 30
s, 50°C for 30 s, and 72°C for 45 s with a final extension of
72°C for 3 min. Forward primers were labeled with FAM or
HEX florescent dyes (Applied Biosystems), PCR products were
genotyped on an ABI3130xl Genetic Analyzer (Applied
Biosystems), and genotypes were analyzed with PeakScanner
v1.0 software (Applied Biosystems). Raw genotype sizes were
rounded and binned according to repeat size using TANDEM
[40]. The mean number of effective alleles (AE) and observed
and expected heterozygosities (HO and HE) were estimated for
each population with GenAlEx v6.41[41]. Deviations from
Hardy Weinberg Equilibrium (HWE), genotypic linkage
disequilibrium (LD) between loci, and the frequency of null
alleles were estimated with Genepop v4.1.2 [42]. Estimated P-
values from HWE and LD tests were corrected for false
discovery rate using the Qvalue program [43].
Table 1. Sampling locations of Blackcaps and summary statistics of population genetics.
Code Population N Lat Long Sampling Period Year AE (SE) HO(SE) HE (SE) MigDir MigDist
Sv Sevilla, ES1 8 37.65 -5.58 25 Jan 2011 3.79 (0.40) 0.65 (0.06) 0.76 (0.02) SW short
Ub Uebersyren, LU 43 49.63 6.28 25 Mar – 2 Apr 2011 4.33 (0.50) 0.72 (0.03) 0.74 (0.03) SW intermed
FrNW Freiburg, DE 23 48.03 7.82 23 Mar – 19 Apr 2011 4.15 (0.47) 0.66 (0.05) 0.73 (0.03) NW intermed
FrSW Freiburg, DE 82 48.03 7.82 23 Mar – 19 Apr 2011 4.62 (0.54) 0.70 (0.02) 0.76 (0.02) SW intermed
Wh Wilhelmshaven, DE 24 53.52 8.12 Summer2 2007 4.17 (0.40) 0.60 (0.03) 0.75 (0.02) SW long
Mn Münsingen, DE 25 48.40 10.00 16 Jun – 13 Jul 2011 4.32 (0.56) 0.72 (0.03) 0.74 (0.03) SW intermed
Os Oslo, NO 25 59.84 10.86 4 May – 13 Jul 2001, 2004, 2008, 2010 4.11 (0.46) 0.68 (0.03) 0.73 (0.03) SW long
Kf Kefermarkt, AT 105 48.44 14.54 14 Apr – 2 May 2011 4.63 (0.50) 0.69 (0.03) 0.76 (0.02) SE intermed
Vn Vienna, AT 35 48.22 16.28 12 May – 21 May 2010 4.39 (0.50) 0.72 (0.02) 0.75 (0.03) SE intermed
Ry Rybachy, RU 51 55.15 20.85 20 Apr – 24 Apr 2011 4.32 (0.52) 0.66 (0.03) 0.74 (0.03) SE long
Bw Białowieża, PL 61 52.7 23.87 14 Apr – 6 May 2011 4.48 (0.45) .73 (0.03) 0.76 (0.02) SE long
Km Kalimok, BG 20 44.00 26.26 16 Apr – 7 Jun 2010, 2011 3.87 (0.38) 0.71 (0.04) 0.73 (0.03) SE long
N: sample size; Lat: decimal degree latitude; Long: decimal degree longitude; Sampling Period: dates samples collected; Year: year(s) samples collected; Ae: effective
number of alleles = 1 / (Sum pi^2), where Sum pi2 is the sum of the squared population allele frequencies; Ho: observed heterozygosity; He: unbiased expected
heterozygosity = (2N / (2N-1)) x expected heterozygosity; (SE): standard error; MigDir: autumn migratory direction; MigDist: migratory distance 1. population sampled during
the non-breeding season 2. precise sampling period information not available.
doi: 10.1371/journal.pone.0081365.t001
Genetic Differentiation among European Blackcaps
PLOS ONE | www.plosone.org 4 November 2013 | Volume 8 | Issue 11 | e81365](https://image.slidesharecdn.com/cf6eb9e8-ea4c-4046-9bac-6e0428e49079-160505001609/85/Mettler_et_al_2013-4-320.jpg)
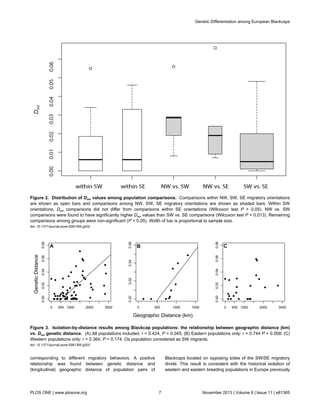
![Genetic structure
Pairwise genetic differentiation among Blackcap populations
was estimated with the fixation index Dest (the unbiased
estimator of D, [44]) using the R package “DEMEtics” [44,45];
complementary FST values estimated with Arlequin v3.5.1.3 [46]
were found to be highly correlated with Dest values (Kendall’s
tau = 0.637, P < 0.0001) and so, we report only Dest values
hereafter. Locus Syl10 has been shown to deviate from HWE
in a previous study [20]. We included this marker in our dataset
as it has been proven to be highly variable. However, we ran
Dest analyses including and excluding this marker for all
comparisons and found that Dest values were highly correlated
between analyses (Kendall’s tau = 0.842, P < 0.0001).
Wilcoxon Sum Rank tests were implemented to investigate the
independence of the distributions of Dest values within and
among migratory orientations; the Uebersyren NW migrant
identified via claw δ2
H was excluded from these analyzes.
Isolation-by-distance among Blackcap populations was
explored with Mantel tests using Isolation by Distance Web
Service v3.23 [47] to investigate the relationship between
geographic distance and genetic distance: Euclidean
geographic distance among all 12 populations was calculated
with the R package “fossil” [48], pairwise genetic distance
between populations was calculated as Dest /(1- Dest) following
Slatkin [49], and 10,000 randomizations were implemented.
Additional Mantel tests were run for only those populations
west of the SW/SE migratory divide and those populations east
of the divide to investigate differential effects of isolation-by-
distance on either side of the SW/SE divide.
The relationship between genetic distance and longitudinal
geographic distance was investigated between Blackcap
populations located on opposing sides of the SW/SE migratory
divide, which was approximated at 13°E (Figure 1); we
acknowledge that the contact zone between SW and SE
migrants is potentially a broad, diffuse zone where migrants
come into contact and here use this precise position as an
approximate zone center (consistent with Blackcap ring
recovery data [25–27,50]) for analytical purposes only. The
latitude of each population was set to zero and the Euclidean
(longitudinal) distance between populations was calculated with
the R package “fossil” [48]. Spearman-Rank correlations were
used to explore the relationship between genetic distance and
longitudinal geographic distance between populations. To
determine if the relationship between genetic distance and
geographic distance was significantly different from random,
measures of geographic distance were resampled 10,000x and
tested against pairwise genetic distances with Spearman rank
correlations. True rho values determined for genetic distance
vs. geographic distance were then compared to confidence
intervals constructed from random distributions to determine
significance of true values. Statistical analyses were conducted
with R statistical computing environment [51].
Genetic structure was further investigated from genotype
data using a MCMC model-based clustering method
implemented with STRUCTURE software v2.3.4 [52]. The most
likely number of genetic clusters (K) was assessed assuming
admixture and locprior of the individual populations and five
iterations were run per K (Burn-in: 100,000; Repetitions:
500,000).
Hierarchical structuring of genetic variance
Populations were grouped by autumn migratory orientation
(i.e. NW, SW, SE) and migratory distance (i.e. short-,
intermediate-, long-distance) inferred from ring-recoveries
(Table 1 and Figure 1; [25,35]). We investigated the effect of
hierarchical structuring on the partitioning of genetic
differentiation by categorizing individuals by migratory
orientation, migratory distance, and the population level (in
decreasing hierarchical order) using the R package “HierFstat”
[53]. Here, the population level was nested within the level of
migratory distance, and migratory distance was nested within
the migratory direction level (population/distance/direction); the
effect of each level was tested with 10,000 permutations to
determine the level of significance of this structuring. Hierarchy
A categorizes the Norwegian population (Os) with a SW
migratory direction, while Hierarchy B categorizes the same
population with a SE migratory direction. The Uebersyren NW
migrant identified via claw δ2
H was excluded from these
analyses.
Results
Genetic diversity
Observed multilocus population heterozygosities were high
and ranged from 0.60 - 0.73, with a mean observed
heterozygosity of 0.69 and mean number of effective alleles of
4.26 (Table 1). Only 18 of 168 total HWE tests indicated a
deficiency of heterozygotes (Q < 0.01), although patterns were
not consistent across populations (Table S1). The Syl10 locus
deviated from HWE at a high frequency (i.e. in nine
populations). In a global analysis including all populations, one
comparison was in linkage disequilibrium (Q < 0.05: Syl2/Syl6),
but found to be significant only in the Kefermarkt population
when populations were analyzed separately. Overall we thus
can assume independence between loci used in this study.
Allele frequencies at each population per locus are listed in
Table S2.
Genetic structure
All birds could be assigned to one single population as
STRUCTURE analysis identified the highest posterior
probability for the number of genetic clusters to be K=1 (Table
S3). Despite this lack of resolution in genetic structure,
significant neutral genetic differentiation was evident among
some population comparisons (Table 2). Most notably, genetic
differentiation was significant between sympatric NW and SW
migrants in Freiburg, with Dest = 0.029 (FST = 0.007). NW
migrants breeding in Freiburg were also found to be
significantly differentiated from allopatric populations in
Uebersyren, Kalimok, and Sevilla, while SW migrants in
Freiburg were undifferentiated from all allopatric populations.
Freiburg NW migrants were most genetically similar to
populations within/near the contact zone at the SW/SE
migratory divide (Table 2).
Genetic Differentiation among European Blackcaps
PLOS ONE | www.plosone.org 5 November 2013 | Volume 8 | Issue 11 | e81365](https://image.slidesharecdn.com/cf6eb9e8-ea4c-4046-9bac-6e0428e49079-160505001609/85/Mettler_et_al_2013-5-320.jpg)

![restricted to potential glacial refugia on the Iberian and Balkan
peninsulas, respectively [2,7,54]. Despite this observed
relationship between genetic and geographic distance, the only
SW/SE pairwise Dest comparison found to be significantly
differentiated was between Ub and Km (over 2000km apart).
Such results indicate a lack of neutral genetic divergence
between populations of SW and SE migrants and, in fact, many
populations within/near the approximated SW/SE contact zone
cannot be differentiated with our marker set. We suggest
therefore that the SW/SE migratory divide is an ineffective
barrier to neutral gene flow across this zone of contact.
Although isolation-by-distance appears to be maintained
among eastern populations, this pattern is not found among
western populations and is potentially confounded by the
occurrence of sympatrically-breeding populations of NW and
SW migrants (as observed in Freiburg, DE). Indeed, NW vs.
SW Dest comparisons were found to significantly differ from SW
vs. SE comparisons, confirming beliefs that different dynamics
of genetic divergence occur with the NW/SW migratory
polymorphism and across the SW/SE migratory divide. In
southern Germany (i.e. Freiburg), weak, albeit significant,
genetic differentiation was found between NW and SW
migrants breeding sympatrically, corroborating results of a
previous study by Rolshausen et al. [20], who suggest that only
low levels of genetic divergence may be needed to maintain
differences in migratory behavior.
The low nuclear genetic differentiation found across the
SW/SE migratory divide in the Blackcap is consistent with
similar patterns found across migratory divides in Eurasian
Reed Warblers (Acrocephalus scirpaceus) in central Europe
[31] and Willow Warblers (Phylloscopus trochilus) in
Scandinavia [12]. A lack of neutral genetic differentiation was
similarly found across the Red-billed Quelea (Quelea quelea)
migratory divide in Africa [10] and between populations of
Black-throated Blue Warblers (Setophaga caerulescens) with
different migratory routes in North America [55]. In addition,
complete introgression has recently occurred between
populations of Savi’s Warblers (Locustella luscinioides) in
Iberia despite Pleistocene divergence and long periods of
geographic isolation between populations [56]. Without
sufficient contemporary reproductive barriers it thus seems that
interbreeding often occurs across migratory divides, regardless
of historical geographic divergence between populations.
Potentially, NW migrant Blackcaps may also contribute to
breeding populations in other areas in central Europe (e.g. in
upper Austria, see 27,57 and Czech/Slovak Republics, see 35).
Our pairwise Dest comparisons suggest the FrNW population is
most genetically similar to the Kf population (i.e. the least
genetic distance was found among FrNW comparisons). This
would support the hypothesized origination of NW migrants
from within the SW/SE contact zone, first proposed by Helbig
[27] from observations of hand-raised Blackcaps from Linz, AU
(~25km SW of Kefermarkt) orienting SW-NW directions (mean
268°) during the autumn migratory period. Alternatively, since
our δ2
H assignment method did not indicate a presence of NW
migrants in the Kefermarkt population, this result may indicate
Figure 4. Relationship between geographic distance (km) and Dest genetic distance. Pairwise measurements estimated
between population pairs located on opposing sides of the SW/SE migratory divide revealed a positive relationship (rho = 0.467, P =
0.005). All 12 populations included with the Os population considered as a ‘western’ population.
doi: 10.1371/journal.pone.0081365.g004
Genetic Differentiation among European Blackcaps
PLOS ONE | www.plosone.org 8 November 2013 | Volume 8 | Issue 11 | e81365](https://image.slidesharecdn.com/cf6eb9e8-ea4c-4046-9bac-6e0428e49079-160505001609/85/Mettler_et_al_2013-8-320.jpg)
![that the location of the Blackcap migratory divide has shifted
eastward; the low genetic divergence found between FrNW vs.
Vn supports this hypothesis, potentially being driven by the
expansion of SW migrants into eastern European populations,
as proposed previously by Wesołowski [58].
Isolation-by-distance (IBD) was found to be non-significant
among the 11 breeding populations (after excluding Sevilla).
However, patterns of IBD differed on either side of the SW/SE
migratory divide: significant IBD was evident among eastern
populations (with greater levels pairwise genetic divergence),
but not among western populations (with lower levels of
pairwise genetic divergence); this result is consistent with the
genetic structure of Blackcap mtDNA by Pérez-Tris et al. [28],
who found no relationship between genetic and geographic
distance among western continental populations (although
results may be influenced by the different sets of populations
sampled in each study). The relationships between geographic
and genetic distance were similarly found to contrast among
populations of Eurasian Reed Warblers (Acrocephalus
scirpaceus) located on opposing sides of their migratory divide
in central Europe [31]. Such contradictory patterns
geographically spanning migratory divides may be indicative of
different ecological and/or evolutionary dynamics acting on
opposing sides of migratory divides in central Europe. Unlike
that found for eastern Blackcap populations, the lack of IBD
demonstrated among western Blackcap populations (i.e. both
SW and NW migrants) suggests a mechanism other than
geographic isolation may be promoting genetic divergence
among western Blackcap populations in the face of gene flow.
Mechanisms promoting / preventing genetic divergence
Our results provide little evidence that the historical migratory
divide in central Europe provides sufficient reproductive
isolation to influence mating preferences based on migratory
orientation in the Blackcap. Rather, it appears that
interbreeding between SW and SE migrants (and potentially
also NW migrants) results in high levels of gene flow across the
migratory divide where populations come into contact.
Asymmetrical gene flow across the SW/SE migratory divide
(i.e. SW migrant Blackcaps outcompeting SE migrants) has
been argued to be responsible for recent demographic
changes at Polish breeding grounds (e.g. advanced arrival time
and increased population size)[58]; interbreeding between
Blackcaps with different migratory strategies could therefore
potentially occur across an even larger area, resulting not in a
divide per se, but a gradual transition between migratory
orientations across central Europe. Our results indicate an
absence of NW migrants in the Białowieża population (from
isotope analysis), but cannot exclude the occurrence of SW
migrants occurring at this location. In fact, low levels of genetic
divergence are found between Białowieża Blackcaps and
several SW migrant populations (Ub, FrSW, Mn) as well as SE
migrant populations (Kf, Vn, Ry), suggesting Białowieża birds
are genetically similar to many other European population due
to introgression. Additionally, the distribution of claw δ2
H from
Białowieża birds is roughly consistent with the δ2
H distribution
of Freiburg SW migrants (although we are unable to distinguish
SW from SE migrants based solely on claw δ2
H). Our results,
together with those of Wesołowski [58], may provide evidence
for either an eastward shift in the geographic position of the
divide/contact zone (i.e. asymmetrical hybridization) or a
widening of the zone in both east and west directions (i.e.
symmetrical hybridization) [59,60]. While further studies are
needed to better characterize the dynamics of this zone,
movement of the SW/SE contact zone remains plausible for
Blackcaps.
Recent studies are now utilizing geolocators to record the
annual cycle of long-distance passerine migrants, including
migratory routes, durations, and strategies [61,62], as for
example in the Swainson’s Thrush (Catharus ustulatus) where
the existence of a migratory divide in North America has been
found [63]. At this narrow migratory divide, low frequencies of
Swainson’s Thrush hybrids may be suggestive of post-mating
isolation, while evidence for pre-mating isolation (e.g.
ecological selection and difference in arrival time) indicates an
important role for reinforcement in the maintenance of this
hybrid zone which spans a migratory divide [14,19]. Similarly,
in Blackcaps both pre- and post-mating isolating mechanisms
may likely influence genetic divergence among populations.
Crosses between SW and SE migrant Blackcaps produced
viable F1 hybrids with intermediate (southerly) orientations [64],
but wild-caught Blackcaps from the center of the contact zone
(Linz, AT) were found to orient SW-NW (mean 268°)
suggesting selection against S-SE orientations (and thus
selection against hybrid or SE x SE pairings) at this location
[27]. Still, 58% of Blackcaps ringed in the Czech Republic and
Slovakia were recovered at SE locations during the non-
breeding period [35]. Nevertheless, within the SW/SE contact
zone, female preference for males with SE orientations could
be responsible for eastward introgression of SW migrant
Blackcaps into eastern breeding populations (e.g. Poland) [58].
Rapid genetic divergence between sympatric NW and SW
migrant Blackcaps may be promoted by pre-mating isolation.
Temporal isolation in spring arrival to breeding grounds in
southern Germany has been documented between NW and
SW migrants [17,18,30] and presents also an effective isolating
mechanism among Swainson’s Thrushes breeding in North
America [19]. Such phenological changes can be further
affected by global climate change which is impacting the
phenology of migratory birds and influencing the advancement
of spring migration and arrival to the breeding grounds
[58,65,66]. It remains unclear however, if such temporal
divergence is locally adaptive in sympatry only, or if NW and
SW migrants reflect significant divergence also in allopatry.
We not only find evidence of significant genetic differentiation
between NW and SW migrant Blackcaps in sympatry, but NW
migrants were significantly differentiated from other populations
of SW migrants in western Europe. The observed divergence
between NW and SW migrants may be the consequence of a
founder effect resulting from a small number of genetically
distinct individuals initially establishing the NW migratory route.
Allopatric genetic differentiation demonstrated between FrNW
and SW migrants (i.e. Sv and Ub) may indicate that such
divergence is not locally adaptive, but that this polymorphism
has evolved repeatedly, independent of adaptive pressures on
the breeding ground. The behavioral, morphological, and
Genetic Differentiation among European Blackcaps
PLOS ONE | www.plosone.org 9 November 2013 | Volume 8 | Issue 11 | e81365](https://image.slidesharecdn.com/cf6eb9e8-ea4c-4046-9bac-6e0428e49079-160505001609/85/Mettler_et_al_2013-9-320.jpg)
![genetic traits observed to be diverging in the Blackcap may be
part of a ‘migratory syndrome’ or ‘migratory gene package’ in
this species whereby a suite of correlated traits that evolve
together are targeted by correlational selection [67–69].
Whether such syndromes are common and generalized among
migratory birds may be debatable [70], but provide an exciting
frontier to explore.
Although our Bayesian clustering and hierarchical analyses
failed to find significant genetic structure among populations
corresponding to the different migratory behaviors investigated,
significant (but weak) genetic structure in mtDNA was found
among eastern (including SE migrants) and western Blackcap
populations (including SW and NW migrants) in a previous
study (although only two eastern populations were considered)
[28]. Maternally-inherited mtDNA is less likely to introgress
across a contact zone than autosomal DNA [71], and reflects
only uni-parental gene flow which limits interpretation among
populations with highly dynamic migratory behaviors. Migratory
orientation may instead be controlled by very few genes
[22,24], and the possibility that one or few of microsatellite loci
used in our study are linked to functional loci cannot be ruled
out, though we did not find any evidence using outlier detection
methods (data not shown). Although microsatellites were found
to be undifferentiated across the Willow Warbler migratory
divide, two AFLPs were shown to exhibit clinal variation
corresponding to phenotypic differences [12]. Developing large
sets of genetic markers spanning the entire genome and
searching for informative markers associated with migratory
behavior will provide better resolution in the genetic variation
and structure of recently divergent populations, such as the
Blackcap [69]. Furthermore, combining molecular and stable
isotope markers (e.g. see 72) with data obtained from ring
recoveries and geolocators may greatly improve the spatial
resolution of species’ movements and thus provide a better
understanding of the ecology and evolution of migratory
divides.
Supporting Information
Figure S1. Stable isotope assignments. Claw δ2
H was used
to categorize Spring 2011 Blackcaps caught at four locales
(Ub, Fr, Kf, Bw) as inhabiting northern wintering grounds on
the British Isles (i.e. NW migrants) or southern wintering
grounds on Iberian or Balkan Peninsulas (i.e. SW or SE
migrants) based on reference claw δ2
H from British Isles and
Spain, respectively (see Methods). (A) Isotope assignment
results per population. Uebersyren, LU (Ub): NW = 1, SW = 42;
Freiburg, DE (Fr): NW = 23, SW = 176, Unassigned (?) = 10;
Kefermarkt, AT (Kf): South = 105; Białowieża, PL (Bw): South =
61. (B) Distribution of raw claw δ2
H isotopes from each
population, Ub = 61; Fr = 209; Kf = 105; Bw = 61. Claw δ2
H
from Ub, Kf, and Bw was found to significantly differ from Fr
δ2
H distribution (Wilcoxon Rank Sum Test P < 0.05), while only
Kf and Bw were found to significantly differ among remaining
comparisons. (C) δ2
H Distribution of N = 23 NW migrants and
N = 82 SW migrants selected from Freiburg, Fr population for
genetic analyses Width of bars are proportional to sample size.
(TIF)
Table S1. Characteristics of 14 microsatellite markers.
Accession No.: GenBank accession numbers; N alleles:
number of alleles per marker; Ho / He: Observed / Expected
Heterozygosities; HWE by pop: populations that were found to
deviate significantly for HWE; Null Allele Freq: mean frequency
of null alleles per marker.
(DOCX)
Table S2. Allele frequency comparison over populations.
(XLS)
Table S3. Summary of STRUCTURE results. #K: number of
clusters; Mean LnP(K): mean posterior probability of given K;
Stdev LnP(K): standard deviation of mean posterior probability
of given K.
(DOCX)
Table S4. F-statistics of hierarchical structuring of genetic
variance. Relationship between hierarchy levels are indicated
in rows with ‘/’ indicating ‘within’; Hierarchy A: 3 migratory
directions (NW, SW, SE) and 3 migratory distances (short-,
intermediate-, long-distance) with the Os population
characterized having SW migratory direction (dir); Hierarchy
B: 3 migratory directions (NW, SW, SE) and 3 migratory
distances (short-, intermediate-, long-distance) with the Os
population characterized having SE migratory direction (dir).
(DOCX)
Acknowledgements
The authors thank Heidi Kurz, Hans Winkler, Diego Santiago-
Alarcon, Michael W. Stracco, P. Rowiński, G. Hebda, and
several students at Universität Freiburg for field assistance. We
also thank Jan T. Lifjeld for providing samples and the staff at
Universität Freiburg Institute für Rechtsmedizin for technical
laboratory assistance. RM, HMS, and GS were funded through
a DFG grant (Scha 1008/6-1) and the DO-G has supported the
collection of samples in Poland.
Author Contributions
Conceived and designed the experiments: HMS GS RM.
Performed the experiments: RM GS. Analyzed the data: RM
GS. Contributed reagents/materials/analysis tools: RM KAH
NC MI EI AJ SCR DS GR TW WF. Wrote the manuscript: RM
GS HMS. Analyzed isotope samples: KAH.
Genetic Differentiation among European Blackcaps
PLOS ONE | www.plosone.org 10 November 2013 | Volume 8 | Issue 11 | e81365](https://image.slidesharecdn.com/cf6eb9e8-ea4c-4046-9bac-6e0428e49079-160505001609/85/Mettler_et_al_2013-10-320.jpg)


![66;road mortalities of amphibians hj 22(1)_pp_51-58_ms_11-55[1]](https://cdn.slidesharecdn.com/ss_thumbnails/66roadmortalitiesofamphibianshj221pp51-58ms11-551-151114213326-lva1-app6891-thumbnail.jpg?width=640&height=640&fit=bounds)


