SlideShare a Scribd company logo
1 of 1
Download to read offline
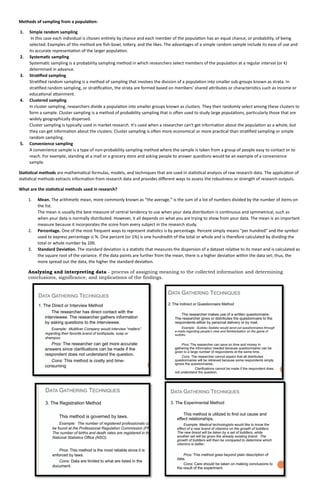
Methods of sampling from a population:
1. Simple random sampling
In this case each individual is chosen entirely by chance and each member of the population has an equal chance, or probability, of being
selected. Examples of this method are fish-bowl, lottery, and the likes. The advantages of a simple random sample include its ease of use and
its accurate representation of the larger population.
2. Systematic sampling
Systematic sampling is a probability sampling method in which researchers select members of the population at a regular interval (or k)
determined in advance.
3. Stratified sampling
Stratified random sampling is a method of sampling that involves the division of a population into smaller sub-groups known as strata. In
stratified random sampling, or stratification, the strata are formed based on members' shared attributes or characteristics such as income or
educational attainment.
4. Clustered sampling
In cluster sampling, researchers divide a population into smaller groups known as clusters. They then randomly select among these clusters to
form a sample. Cluster sampling is a method of probability sampling that is often used to study large populations, particularly those that are
widely geographically dispersed.
Cluster sampling is typically used in market research. It's used when a researcher can't get information about the population as a whole, but
they can get information about the clusters. Cluster sampling is often more economical or more practical than stratified sampling or simple
random sampling.
5. Convenience sampling
A convenience sample is a type of non-probability sampling method where the sample is taken from a group of people easy to contact or to
reach. For example, standing at a mall or a grocery store and asking people to answer questions would be an example of a convenience
sample.
Statistical methods are mathematical formulas, models, and techniques that are used in statistical analysis of raw research data. The application of
statistical methods extracts information from research data and provides different ways to assess the robustness or strength of research outputs.
What are the statistical methods used in research?
1. Mean. The arithmetic mean, more commonly known as “the average,” is the sum of a list of numbers divided by the number of items on
the list.
The mean is usually the best measure of central tendency to use when your data distribution is continuous and symmetrical, such as
when your data is normally distributed. However, it all depends on what you are trying to show from your data. The mean is an important
measure because it incorporates the score from every subject in the research study.
2. Percentage. One of the most frequent ways to represent statistics is by percentage. Percent simply means "per hundred" and the symbol
used to express percentage is %. One percent (or 1%) is one hundredth of the total or whole and is therefore calculated by dividing the
total or whole number by 100.
3. Standard Deviation. The standard deviation is a statistic that measures the dispersion of a dataset relative to its mean and is calculated as
the square root of the variance. If the data points are further from the mean, there is a higher deviation within the data set; thus, the
more spread out the data, the higher the standard deviation.
Analyzing and interpreting data - process of assigning meaning to the collected information and determining
conclusions, significance, and implications of the findings.

More Related Content

Similar to Methods of sampling from a population.pdf

methodology in research
  methodology in research  methodology in research
methodology in researchMisbah Iqbal
 
Sampling research method
Sampling research methodSampling research method
Sampling research methodM.S. SaHiR
 
Session 5_Sampling strategy_Intake Dr Emmanuel.pdf
Session 5_Sampling strategy_Intake Dr Emmanuel.pdfSession 5_Sampling strategy_Intake Dr Emmanuel.pdf
Session 5_Sampling strategy_Intake Dr Emmanuel.pdfmuhirwaSamuel
 
Sampling techniques and sample size calculations.pptx
Sampling techniques and sample size calculations.pptxSampling techniques and sample size calculations.pptx
Sampling techniques and sample size calculations.pptxDr Debasish Mohapatra
 
Week_9-Unit_7_Sampling_Techniques (1).pdf
Week_9-Unit_7_Sampling_Techniques (1).pdfWeek_9-Unit_7_Sampling_Techniques (1).pdf
Week_9-Unit_7_Sampling_Techniques (1).pdfdursunselim329
 
Unit 6 sampling techniques
Unit 6 sampling techniquesUnit 6 sampling techniques
Unit 6 sampling techniquesAsima shahzadi
 
Sampling Variability And The Precision Of A Sample by Dr Sindhu Almas copy.pptx
Sampling Variability And The Precision Of A Sample by Dr Sindhu Almas copy.pptxSampling Variability And The Precision Of A Sample by Dr Sindhu Almas copy.pptx
Sampling Variability And The Precision Of A Sample by Dr Sindhu Almas copy.pptxDrSindhuAlmas
 
BIOSTATISTICS.pptx sidhathab.pptx oral pathology
BIOSTATISTICS.pptx sidhathab.pptx oral pathologyBIOSTATISTICS.pptx sidhathab.pptx oral pathology
BIOSTATISTICS.pptx sidhathab.pptx oral pathologySidharthaBordoloi2
 
Sampling1[1]
Sampling1[1]Sampling1[1]
Sampling1[1]jilly17
 
RESEARCH-DESIGN on lichen diversity.pptx
RESEARCH-DESIGN on lichen diversity.pptxRESEARCH-DESIGN on lichen diversity.pptx
RESEARCH-DESIGN on lichen diversity.pptximmunedarksempai0
 
Sampling method son research methodology
Sampling method son research methodologySampling method son research methodology
Sampling method son research methodologyLevisMithamo
 
sampling
samplingsampling
samplingkamalu4
 
Sampling in Research
Sampling in ResearchSampling in Research
Sampling in ResearchEnzo Engada
 

Similar to Methods of sampling from a population.pdf (20)

methodology in research
  methodology in research  methodology in research
methodology in research
 
Sampling research method
Sampling research methodSampling research method
Sampling research method
 
Session 5_Sampling strategy_Intake Dr Emmanuel.pdf
Session 5_Sampling strategy_Intake Dr Emmanuel.pdfSession 5_Sampling strategy_Intake Dr Emmanuel.pdf
Session 5_Sampling strategy_Intake Dr Emmanuel.pdf
 
Sampling techniques and sample size calculations.pptx
Sampling techniques and sample size calculations.pptxSampling techniques and sample size calculations.pptx
Sampling techniques and sample size calculations.pptx
 
sampling methods
sampling methodssampling methods
sampling methods
 
Week_9-Unit_7_Sampling_Techniques (1).pdf
Week_9-Unit_7_Sampling_Techniques (1).pdfWeek_9-Unit_7_Sampling_Techniques (1).pdf
Week_9-Unit_7_Sampling_Techniques (1).pdf
 
Unit 6 sampling techniques
Unit 6 sampling techniquesUnit 6 sampling techniques
Unit 6 sampling techniques
 
Sampling Variability And The Precision Of A Sample by Dr Sindhu Almas copy.pptx
Sampling Variability And The Precision Of A Sample by Dr Sindhu Almas copy.pptxSampling Variability And The Precision Of A Sample by Dr Sindhu Almas copy.pptx
Sampling Variability And The Precision Of A Sample by Dr Sindhu Almas copy.pptx
 
BIOSTATISTICS.pptx sidhathab.pptx oral pathology
BIOSTATISTICS.pptx sidhathab.pptx oral pathologyBIOSTATISTICS.pptx sidhathab.pptx oral pathology
BIOSTATISTICS.pptx sidhathab.pptx oral pathology
 
Sampling
SamplingSampling
Sampling
 
Sampling1[1]
Sampling1[1]Sampling1[1]
Sampling1[1]
 
Sampling
Sampling Sampling
Sampling
 
Mm22
Mm22Mm22
Mm22
 
RESEARCH-DESIGN on lichen diversity.pptx
RESEARCH-DESIGN on lichen diversity.pptxRESEARCH-DESIGN on lichen diversity.pptx
RESEARCH-DESIGN on lichen diversity.pptx
 
Chapter5.ppt
Chapter5.pptChapter5.ppt
Chapter5.ppt
 
Sampling method son research methodology
Sampling method son research methodologySampling method son research methodology
Sampling method son research methodology
 
Chapter5.ppt
Chapter5.pptChapter5.ppt
Chapter5.ppt
 
sampling
samplingsampling
sampling
 
Chapter5
Chapter5Chapter5
Chapter5
 
Sampling in Research
Sampling in ResearchSampling in Research
Sampling in Research
 

Recently uploaded

Student login on Anyboli platform.helpin
Student login on Anyboli platform.helpinStudent login on Anyboli platform.helpin
Student login on Anyboli platform.helpinRaunakKeshri1
 
Mastering the Unannounced Regulatory Inspection
Mastering the Unannounced Regulatory InspectionMastering the Unannounced Regulatory Inspection
Mastering the Unannounced Regulatory InspectionSafetyChain Software
 
mini mental status format.docx
mini    mental       status     format.docxmini    mental       status     format.docx
mini mental status format.docxPoojaSen20
 
Privatization and Disinvestment - Meaning, Objectives, Advantages and Disadva...
Privatization and Disinvestment - Meaning, Objectives, Advantages and Disadva...Privatization and Disinvestment - Meaning, Objectives, Advantages and Disadva...
Privatization and Disinvestment - Meaning, Objectives, Advantages and Disadva...RKavithamani
 
A Critique of the Proposed National Education Policy Reform
A Critique of the Proposed National Education Policy ReformA Critique of the Proposed National Education Policy Reform
A Critique of the Proposed National Education Policy ReformChameera Dedduwage
 
microwave assisted reaction. General introduction
microwave assisted reaction. General introductionmicrowave assisted reaction. General introduction
microwave assisted reaction. General introductionMaksud Ahmed
 
Advanced Views - Calendar View in Odoo 17
Advanced Views - Calendar View in Odoo 17Advanced Views - Calendar View in Odoo 17
Advanced Views - Calendar View in Odoo 17Celine George
 
Sanyam Choudhary Chemistry practical.pdf
Sanyam Choudhary Chemistry practical.pdfSanyam Choudhary Chemistry practical.pdf
Sanyam Choudhary Chemistry practical.pdfsanyamsingh5019
 
Grant Readiness 101 TechSoup and Remy Consulting
Grant Readiness 101 TechSoup and Remy ConsultingGrant Readiness 101 TechSoup and Remy Consulting
Grant Readiness 101 TechSoup and Remy ConsultingTechSoup
 
Activity 01 - Artificial Culture (1).pdf
Activity 01 - Artificial Culture (1).pdfActivity 01 - Artificial Culture (1).pdf
Activity 01 - Artificial Culture (1).pdfciinovamais
 
Interactive Powerpoint_How to Master effective communication
Interactive Powerpoint_How to Master effective communicationInteractive Powerpoint_How to Master effective communication
Interactive Powerpoint_How to Master effective communicationnomboosow
 
Z Score,T Score, Percential Rank and Box Plot Graph
Z Score,T Score, Percential Rank and Box Plot GraphZ Score,T Score, Percential Rank and Box Plot Graph
Z Score,T Score, Percential Rank and Box Plot GraphThiyagu K
 
Kisan Call Centre - To harness potential of ICT in Agriculture by answer farm...
Kisan Call Centre - To harness potential of ICT in Agriculture by answer farm...Kisan Call Centre - To harness potential of ICT in Agriculture by answer farm...
Kisan Call Centre - To harness potential of ICT in Agriculture by answer farm...Krashi Coaching
 
Call Girls in Dwarka Mor Delhi Contact Us 9654467111
Call Girls in Dwarka Mor Delhi Contact Us 9654467111Call Girls in Dwarka Mor Delhi Contact Us 9654467111
Call Girls in Dwarka Mor Delhi Contact Us 9654467111Sapana Sha
 
POINT- BIOCHEMISTRY SEM 2 ENZYMES UNIT 5.pptx
POINT- BIOCHEMISTRY SEM 2 ENZYMES UNIT 5.pptxPOINT- BIOCHEMISTRY SEM 2 ENZYMES UNIT 5.pptx
POINT- BIOCHEMISTRY SEM 2 ENZYMES UNIT 5.pptxSayali Powar
 
CARE OF CHILD IN INCUBATOR..........pptx
CARE OF CHILD IN INCUBATOR..........pptxCARE OF CHILD IN INCUBATOR..........pptx
CARE OF CHILD IN INCUBATOR..........pptxGaneshChakor2
 
BASLIQ CURRENT LOOKBOOK LOOKBOOK(1) (1).pdf
BASLIQ CURRENT LOOKBOOK  LOOKBOOK(1) (1).pdfBASLIQ CURRENT LOOKBOOK  LOOKBOOK(1) (1).pdf
BASLIQ CURRENT LOOKBOOK LOOKBOOK(1) (1).pdfSoniaTolstoy
 
18-04-UA_REPORT_MEDIALITERAСY_INDEX-DM_23-1-final-eng.pdf
18-04-UA_REPORT_MEDIALITERAСY_INDEX-DM_23-1-final-eng.pdf18-04-UA_REPORT_MEDIALITERAСY_INDEX-DM_23-1-final-eng.pdf
18-04-UA_REPORT_MEDIALITERAСY_INDEX-DM_23-1-final-eng.pdfssuser54595a
 

Recently uploaded (20)

Student login on Anyboli platform.helpin
Student login on Anyboli platform.helpinStudent login on Anyboli platform.helpin
Student login on Anyboli platform.helpin
 
Mastering the Unannounced Regulatory Inspection
Mastering the Unannounced Regulatory InspectionMastering the Unannounced Regulatory Inspection
Mastering the Unannounced Regulatory Inspection
 
mini mental status format.docx
mini    mental       status     format.docxmini    mental       status     format.docx
mini mental status format.docx
 
Privatization and Disinvestment - Meaning, Objectives, Advantages and Disadva...
Privatization and Disinvestment - Meaning, Objectives, Advantages and Disadva...Privatization and Disinvestment - Meaning, Objectives, Advantages and Disadva...
Privatization and Disinvestment - Meaning, Objectives, Advantages and Disadva...
 
Mattingly "AI & Prompt Design: The Basics of Prompt Design"
Mattingly "AI & Prompt Design: The Basics of Prompt Design"Mattingly "AI & Prompt Design: The Basics of Prompt Design"
Mattingly "AI & Prompt Design: The Basics of Prompt Design"
 
A Critique of the Proposed National Education Policy Reform
A Critique of the Proposed National Education Policy ReformA Critique of the Proposed National Education Policy Reform
A Critique of the Proposed National Education Policy Reform
 
microwave assisted reaction. General introduction
microwave assisted reaction. General introductionmicrowave assisted reaction. General introduction
microwave assisted reaction. General introduction
 
Advanced Views - Calendar View in Odoo 17
Advanced Views - Calendar View in Odoo 17Advanced Views - Calendar View in Odoo 17
Advanced Views - Calendar View in Odoo 17
 
Sanyam Choudhary Chemistry practical.pdf
Sanyam Choudhary Chemistry practical.pdfSanyam Choudhary Chemistry practical.pdf
Sanyam Choudhary Chemistry practical.pdf
 
Grant Readiness 101 TechSoup and Remy Consulting
Grant Readiness 101 TechSoup and Remy ConsultingGrant Readiness 101 TechSoup and Remy Consulting
Grant Readiness 101 TechSoup and Remy Consulting
 
Activity 01 - Artificial Culture (1).pdf
Activity 01 - Artificial Culture (1).pdfActivity 01 - Artificial Culture (1).pdf
Activity 01 - Artificial Culture (1).pdf
 
Interactive Powerpoint_How to Master effective communication
Interactive Powerpoint_How to Master effective communicationInteractive Powerpoint_How to Master effective communication
Interactive Powerpoint_How to Master effective communication
 
Z Score,T Score, Percential Rank and Box Plot Graph
Z Score,T Score, Percential Rank and Box Plot GraphZ Score,T Score, Percential Rank and Box Plot Graph
Z Score,T Score, Percential Rank and Box Plot Graph
 
Kisan Call Centre - To harness potential of ICT in Agriculture by answer farm...
Kisan Call Centre - To harness potential of ICT in Agriculture by answer farm...Kisan Call Centre - To harness potential of ICT in Agriculture by answer farm...
Kisan Call Centre - To harness potential of ICT in Agriculture by answer farm...
 
Call Girls in Dwarka Mor Delhi Contact Us 9654467111
Call Girls in Dwarka Mor Delhi Contact Us 9654467111Call Girls in Dwarka Mor Delhi Contact Us 9654467111
Call Girls in Dwarka Mor Delhi Contact Us 9654467111
 
POINT- BIOCHEMISTRY SEM 2 ENZYMES UNIT 5.pptx
POINT- BIOCHEMISTRY SEM 2 ENZYMES UNIT 5.pptxPOINT- BIOCHEMISTRY SEM 2 ENZYMES UNIT 5.pptx
POINT- BIOCHEMISTRY SEM 2 ENZYMES UNIT 5.pptx
 
CARE OF CHILD IN INCUBATOR..........pptx
CARE OF CHILD IN INCUBATOR..........pptxCARE OF CHILD IN INCUBATOR..........pptx
CARE OF CHILD IN INCUBATOR..........pptx
 
BASLIQ CURRENT LOOKBOOK LOOKBOOK(1) (1).pdf
BASLIQ CURRENT LOOKBOOK  LOOKBOOK(1) (1).pdfBASLIQ CURRENT LOOKBOOK  LOOKBOOK(1) (1).pdf
BASLIQ CURRENT LOOKBOOK LOOKBOOK(1) (1).pdf
 
18-04-UA_REPORT_MEDIALITERAСY_INDEX-DM_23-1-final-eng.pdf
18-04-UA_REPORT_MEDIALITERAСY_INDEX-DM_23-1-final-eng.pdf18-04-UA_REPORT_MEDIALITERAСY_INDEX-DM_23-1-final-eng.pdf
18-04-UA_REPORT_MEDIALITERAСY_INDEX-DM_23-1-final-eng.pdf
 
Staff of Color (SOC) Retention Efforts DDSD
Staff of Color (SOC) Retention Efforts DDSDStaff of Color (SOC) Retention Efforts DDSD
Staff of Color (SOC) Retention Efforts DDSD
 

Methods of sampling from a population.pdf

  • 1. Methods of sampling from a population: 1. Simple random sampling In this case each individual is chosen entirely by chance and each member of the population has an equal chance, or probability, of being selected. Examples of this method are fish-bowl, lottery, and the likes. The advantages of a simple random sample include its ease of use and its accurate representation of the larger population. 2. Systematic sampling Systematic sampling is a probability sampling method in which researchers select members of the population at a regular interval (or k) determined in advance. 3. Stratified sampling Stratified random sampling is a method of sampling that involves the division of a population into smaller sub-groups known as strata. In stratified random sampling, or stratification, the strata are formed based on members' shared attributes or characteristics such as income or educational attainment. 4. Clustered sampling In cluster sampling, researchers divide a population into smaller groups known as clusters. They then randomly select among these clusters to form a sample. Cluster sampling is a method of probability sampling that is often used to study large populations, particularly those that are widely geographically dispersed. Cluster sampling is typically used in market research. It's used when a researcher can't get information about the population as a whole, but they can get information about the clusters. Cluster sampling is often more economical or more practical than stratified sampling or simple random sampling. 5. Convenience sampling A convenience sample is a type of non-probability sampling method where the sample is taken from a group of people easy to contact or to reach. For example, standing at a mall or a grocery store and asking people to answer questions would be an example of a convenience sample. Statistical methods are mathematical formulas, models, and techniques that are used in statistical analysis of raw research data. The application of statistical methods extracts information from research data and provides different ways to assess the robustness or strength of research outputs. What are the statistical methods used in research? 1. Mean. The arithmetic mean, more commonly known as “the average,” is the sum of a list of numbers divided by the number of items on the list. The mean is usually the best measure of central tendency to use when your data distribution is continuous and symmetrical, such as when your data is normally distributed. However, it all depends on what you are trying to show from your data. The mean is an important measure because it incorporates the score from every subject in the research study. 2. Percentage. One of the most frequent ways to represent statistics is by percentage. Percent simply means "per hundred" and the symbol used to express percentage is %. One percent (or 1%) is one hundredth of the total or whole and is therefore calculated by dividing the total or whole number by 100. 3. Standard Deviation. The standard deviation is a statistic that measures the dispersion of a dataset relative to its mean and is calculated as the square root of the variance. If the data points are further from the mean, there is a higher deviation within the data set; thus, the more spread out the data, the higher the standard deviation. Analyzing and interpreting data - process of assigning meaning to the collected information and determining conclusions, significance, and implications of the findings.