Downloaded 53 times


![160
Chuenpagdee, R., Morgan, L. E., Maxwell, S. M., Norse, E. A., & Pauly, D.
(2003). Shifting Gears: assessing collateral impacts of fishing methods in
US waters. Frontiers in Ecology and the Environment, 10, 517–524.
Clabby, C. (2010). Does Peak Phosphorus Loom? Retrieved September
7, 2015, from http://www.americanscientist.org/issues/pub/does-peak-
phosphorus-loom
Clark, K., & Summers, L. (1982). The Dynamics of Youth Unemployment.
Retrieved September 1, 2015, from http://www.nber.org/chapters/c7875.
pdf
Connor, D. J. (2008). Organic agriculture cannot feed the world. Field Crops
Research, 106(2), 187–190. http://doi.org/10.1016/j.fcr.2007.11.010
Consumers International. (2012). The relationship between supermarkets
and suppliers : What are the implications for consumers ?
Convention on Biological Diversity. (2015). Programmes: Agricultural
Biodiversity. What’s the Problem? Retrieved September 4, 2015, from
https://www.cbd.int/agro/whatstheproblem.shtml
Copa-Cogeca. (2011). Copa-Cogeca’s position on the EU’s biofuels policy.
Cordell, D., & White, S. (2011). Peak phosphorus: Clarifying the key issues
of a vigorous debate about long-term phosphorus security. Sustainability,
3(10), 2027–2049. http://doi.org/10.3390/su3102027
Cotula, L., Vermeulen, S., Keeley, J., & Leonard, R. (2009). Land Grab or
Development Oportunity? Agricultural Investment and International
Land Deals in Africa. London/Rome. Retrieved from http://www.fao.org/
docrep/011/ak241e/ak241e00.htm
Cowan, R., & Gunby, P. (1996). Sprayed to death: path dependence, lock-
in and pest control strategies. The Economic Journal, 106(436), 521–542.
http://doi.org/10.2307/2235561
Cox, T. S., Glover, J. D., van Tassel, D. L., Cox, C. M., & De Haan, L. R. (2006).
Prospects for Developing Perennial Grain Crops. BioScience, 56(8), 649.
http://doi.org/10.1641/0006-3568(2006)56[649:PFDPGC]2.0.CO;2
Culver, L., Mauch, C., & Ritson, K. (2012). Rachel Carson’s Silent Spring -
Encounters and Legacies, 7, 1–70.
Dallemand, J., Pascua, I. P., Motola, V., Banja, M., Scarlat, N., Medarac, H., …
Monforti-ferrario, F. (2015). Energy use in the EU food sector : State of play
and opportunities for improvement. http://doi.org/10.2790/158316
Datar, I., & Betti, M. (2010). Possibilities for an in vitro meat production
system. Innovative Food Science & Emerging Technologies, 11(1), 13–22.
http://doi.org/10.1016/j.ifset.2009.10.007
Dayton, P. K., Thrush, S. F., Agardy, M. T., & Hofman, R. J. (1995).
Environmental effects of marine fishing. Aquatic Conservation: Marine
and Freshwater Ecosystems, 5(March), 205–232. http://doi.org/10.1002/
aqc.3270050305
de Benoist, B., Andersson, M., Egli, I., Takkouche, B., & Allen, H. (2004).
Iodine status worldwide. WHO Global Database on Iodine Deficiency.
Geneca: World Health Organization.
de Coning, E. (2013). Caught at Sea: Forced labour and Trafficking.
De Ponti, T., Rijk, B., & Van Ittersum, M. K. (2012). The crop yield gap
between organic and conventional agriculture. Agricultural Systems, 108,
1–9. http://doi.org/10.1016/j.agsy.2011.12.004
De Schutter, O. (2008). Building resilience: a human rights framework for
world food and nutrition security. Promotion and Protection of All Human
Rights, Civil, Political, Economic, Social and Cultural Rights, Including the
Right to Development., 15508, A/HRC/9/23. Retrieved from http://www2.
ohchr.org/english/issues/food/ docs/A.HRC.9.23.pdf
de Schutter, O. (2009). International Trade in Agriculture and the Right to
Food.
de Schutter, O. (2010). Report submitted by the Special Rapporteur on the
right to food. Development, (December), 21. http://doi.org/A/HRC/16/49
Deloitte Touche Tohmatsu Limited. (2014). Global Powers of Retailing
2014: Retail Beyond begins. London. Retrieved from http://www.deloitte.
com/assets/Dcom-Chile/Local Assets/Documents/Nuevos/Estudios/CB_
GlobalPowersofRetailing2014.pdf
Derpsch, R., Friedrich, T., Kassam, A., & Hongwen, L. (2010). Current status
of adoption of no-till farming in the world and some of its main benefits.
International Journal of Agricultural and Biological Engineering, 3(1), 1–25.
http://doi.org/10.3965/j.issn.1934-6344.2010.01.001-025
DESA-UN. (1995). World Summit for Social Development Copenhagen
1995. Retrieved September 1, 2015, from http://social.un.org/index/
Home/WSSD1995.aspx
DESA-UN. (2010). Rethinking Poverty: Report on the World Social Situation
2010. Retrieved September 1, 2015, from http://books.google.com/books
?hl=en&lr=&id=xCx4L2OWmssC&oi=fnd&pg=PA1&dq=Rethinking+Poverty
:+Report+on+the+World+Social+Situation+2010&ots=wr09DuAD8F&sig=b
6W-3azmzZJE5OcL_SFKsi_l_cY
Dixon, J., Gulliver, A., Gibbon, D., & Kassam, a. H. (2001). Farming Systems
and Poverty: Improving Farmers’ Livelihoods in a Changing World.
Experimental Agriculture (Vol. 39). Retrieved from ftp://ftp.fao.org/
docrep/fao/003/y1860e/y1860e00.pdfnftp://ftp.fao.org/docrep/fao/003/
Y1860E/Y1860E00.PDFnhttp://www.journals.cambridge.org/abstract_
S0014479702211059
Doak, C. M., Adair, L. S., Bentley, M., Monteiro, C., & Popkin, B. M. (2005). The
dual burden household and the nutrition transition paradox. International
journal of obesity. International Journal of Obesity, 29(1), 129–136.
Dolan, C., & Sorby, K. (2003). Gender and Employment in High-value
Agriculture and Rural Industries. Agriculture and Rural Development
Working Paper, Series No. 7.
Donal, P. F., Gree, R. E., & Heath, M. F. (2001). Agricultural intensification
and the collapse of Europe’s farmland bird populations. Proceedings.
Biological Sciences / The Royal Society, 268(1462), 25–9. http://doi.
org/10.1098/rspb.2000.1325
Duit, A. (2008). The Ecological State : Cross-National Patterns of
Environmental Governance Regimes. Governance An International
Journal Of Policy And Administration. Retrieved from http://www.ecologic.
de/projekte/epigov/
Duraiappah, A. (1996). Poverty and Environmental Degradation: A literature
review and analysis. CREED Working Paper Series No 8, (8), 35. Retrieved
from http://pubs.iied.org/pdfs/8127IIED.pdf
Easterbrook, G. (1997). Forgotten Benefactor of Humanity. The Atlantic
Monthly, 279(1), 75–82. Retrieved from http://www.theatlantic.com/past/
issues/97jan/borlaug/borlaug.htm
EFSA. (2014). The European Union summary report on trends and
sources of zoonoses, zoonotic agents, and food-borne outbreaks in 2010.
European Food Safety Authority Journal, 12(2). Retrieved from http://
www.efsa.europa.eu/en/efsajournal/pub/3547.htm
EISA. (2012). A European Definition and Characterisation of Integrated
Farming (IF) as Guideline for Sustainable Development of Agriculture.
European Initiative for Sustainable Development in Agriculture, (February),
1–108. Retrieved from http://www.sustainable-agriculture.org/stuff/EISA_
Framework_english_new_wheel_170212.pdf
EPA. (2009). National Water Quality Inventory : Report to Congress 2004
Reporting Cycle. Water, (January), 43. http://doi.org/http://www.epa.gov/
owow/305b/2004report/
Europe Innova. (n.d.). Assessment of the Bio-based Products Market
Potential for Innovation. European Commission Enterprise and Industry.
Retrieved from http://www.biochem-project.eu/download/toolbox/
innovation/06/Bio-Based Market potential.pdf](https://image.slidesharecdn.com/metabolicglobalfoodsystemanalysis-160731141147/85/Metabolic-Global-food-system-analysis-160-320.jpg)
![THE GLOBAL FOOD SYSTEM: AN ANALYSIS 169
BIBLIOGRAPHY
U.S. Energy Information Administration. (2012). Biofuels Issues and
Trends, (October), 1–48. Retrieved from papers2://publication/
uuid/24B1B2ED-7BD8-41CB-9215-E749DD9CA356
U.S. Food and Drug Administration (FDA). (2015). All About
BSE. Retrieved from http://www.fda.gov/AnimalVeterinary/
ResourcesforYou/AnimalHealthLiteracy/ucm136222.htm
UNCTAD. (2013a). Implications of global value chains for trade,
investment, development and jobs .
UNCTAD. (2013b). Trade and Environment Review 2013.
UNCTAD. (2013c). Trade and Environment Review 2013: Wake up
before it is too late. Retrieved from http://unctad.org/en/pages/
PublicationWebflyer.aspx?publicationid=666
UNEP. (2010). Assessing the environmental impacts of consumption
and production. Environment.
UNEP. (2012). The Critical Role of Global Food Consumption Patterns
in Achieving Sustainable Food Systems and Food for All, 12–16.
UNESCO. (2003). Water for People Water for Live: The United Nations
World Water Development Report.
UNESCO. (2006). Non-Renewable Groundwater Resources. A
Guidebook on Socially Sustainable Management for Water Policy
Makers. Arid Lands Water Evaluation and Management.
UNICEF. (2013). Improving Child Nutrition: The Achievable Imperative
for Global Progress. United Nations’ Childrens Fund (UNICEF).
Retrieved from http://www.unicef.org/gambia/Improving_Child_
Nutrition_-_the_achievable_imperative_for_global_progress.pdf
United Nations. (2015). World Population Prospects 2015 Key_
Findings_WPP_2015.
United Nations Convention to Combat Desertification (UNCCD).
(2012). Background Information on Desertification and Land
Degradation for World Day to Combat Desertification - 17 June. World
Day to Combat Desertification, 1. Retrieved from http://www.un.org/
en/events/desertificationday/background.shtml
United Nations Environmental Programme. (2007). Global
Environment Outlook: GEO4 Environment for Development. Retrieved
September 5, 2015, from http://www.unep.org/geo/geo4/report/geo-
4_report_full_en.pdf
United Nations Environmental Programme. (2011). Waste: investing in
energy and resource efficiency.
United States Bureau of Labour Statistics. (2011). Employment,
Hours, and Earnings from the Current Employment Statistics survey.
Retrieved from http://data.bls.gov/pdq/querytool.jsp?survey=ce
United States Department of Agriculture. (2007). USDA table of
nutrient retention factors: release 6. Retrieved from http://www.ars.
usda.gov/SP2UserFiles/Place/80400525/Data/retn/retn06.pdf
United States Department of Agriculture. (2012). USDA Economic
Research Service - Global Food Industry. Retrieved August 9, 2015,
from http://www.ers.usda.gov/topics/international-markets-trade/
global-food-markets/global-food-industry.aspx
United States Department of Health and Human Services. (2011).
Fish and Fishery Products Hazards and Controls Guidance. Fish and
Fishery Products Hazard and Control Guidance Fourth Edition.
USDA. (2014a). CRIS Funding Trend - ARS Sponsored - by Portfolio.
Retrieved August 17, 2015, from https://portal.nifa.usda.gov/lmd4/
portfolios/trends/7-cris-funding-trend-ars-sponsored-by-portfolio/
public
USDA. (2014b). CRIS Funding Trend - NIFA Funding Source - by
Portfolio. Retrieved August 17, 2015, from https://portal.nifa.usda.
gov/lmd4/portfolios/trends/8-cris-funding-trend-nifa-funding-
source-by-portfolio/public
USDAEconomicResearchService-AdoptionofGeneticallyEngineered
Crops in the U.S. (n.d.). Retrieved from http://www.ers.usda.gov/data-
products/adoption-of-genetically-engineered-crops-in-the-us.aspx
Van Boeckel, T. P., Brower, C., Gilbert, M., Grenfell, B. T., Levin, S.
A., Robinson, T. P., … Laxminarayan, R. (2015). Global trends in
antimicrobial use in food animals. Proceedings of the National
Academy of Sciences of the United States of America, 112(18), 5649–
5654. http://doi.org/10.1073/pnas.1503141112
van der Werf, G. R., Morton, D. C., DeFries, R. S., Olivier, J. G. J.,
Kasibhatla, P. S., Jackson, R. B., … Randerson, J. T. (2009). CO2
emissions from forest loss. Nature Geoscience, 2(11), 737–738. http://
doi.org/10.1038/ngeo671
Van Wart, J., Kersebaum, K. C., Peng, S., Milner, M., & Cassman, K.
G. (2013). Estimating crop yield potential at regional to national
scales. Field Crops Research, 143, 34–43. http://doi.org/10.1016/j.
fcr.2012.11.018
Vanloqueren, G., & Baret, P. V. (2008). Why are ecological, low-input,
multi-resistant wheat cultivars slow to develop commercially? A
Belgian agricultural “lock-in” case study. Ecological Economics, 66(2-
3), 436–446. http://doi.org/10.1016/j.ecolecon.2007.10.007
Vanloqueren,G.,&Baret,P.V.(2009).Howagriculturalresearchsystems
shape a technological regime that develops genetic engineering but
locks out agroecological innovations. Research Policy, 38(6), 971–983.
http://doi.org/10.1016/j.respol.2009.02.008
Vanloqueren, G., & Baret, P. V. (2009). (n.d.). How agricultural research
systems shape a technological regime that develops genetic
engineering but locks out agroecological innovations. Research
policy, 38(6), 971-983.
Verma,M.(2015).EnergyUseinGlobalFoodProductionConsiderations
for Sustainable Food Security in the 21st Century. (R. W. Hartel, P. J.
Clark, J. F. Finley, D. Rodriguez-Lazaro, Y. Roos, & D. Topping, Eds.)
(SpringerBr). Adelaide: Springer International Publishing. http://doi.
org/10.1007/978-3-319-16781-7
Veron, G., Patterson, B. D., & Reeves, R. (2008). Freshwater Animal
Diversity Assessment. Freshwater Animal Diversity Assessment,
198(APRIL), 607–617. http://doi.org/10.1007/978-1-4020-8259-7
Vetter, S. (2013). Development and sustainable management of
rangeland commons – aligning policy with the realities of South
Africa’s rural landscape. African Journal of Range & Forage Science,
30(1-2), 1–9. http://doi.org/10.2989/10220119.2012.750628
Vicard, V. (2012). Trade, conflict, and political integration: Explaining
the heterogeneity of regional trade agreements. European Economic
Review, 56(1), 54–71. http://doi.org/10.1016/j.euroecorev.2011.06.003
Vitousek, P. M., Aber, J. D., Howarth, R. W., Likens, G. E., Matson, P.
A., Schindler, D. W., … Tilman, D. G. (1997). HUMAN ALTERATION OF
THE GLOBAL NITROGEN CYCLE: SOURCES AND CONSEQUENCES.
Ecological Applications, 7(3), 737–750. http://doi.org/10.1890/1051-
0761(1997)007[0737:HAOTGN]2.0.CO;2
Vogt, R. D., Guo, J. H., Luo, J. H., Peng, X. Y., Xiang, R. J., Xiao, J.
S., … Zhao, Y. (2007). Water chemistry in forested acid sensitive
sites in sub-tropical Asia receiving acid rain and alkaline dust.
Applied Geochemistry, 22(6), 1140–1148. http://doi.org/10.1016/j.
apgeochem.2007.03.005
Wagner, K. (2014). Revealing the truth about nutrition labelling: The
age of the confused consumer. Studies by Undergraduate Researchers
at Guelph, 7(3).](https://image.slidesharecdn.com/metabolicglobalfoodsystemanalysis-160731141147/85/Metabolic-Global-food-system-analysis-169-320.jpg)

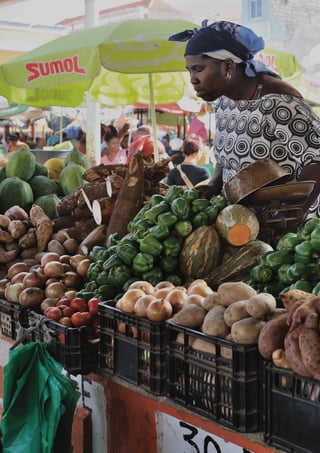
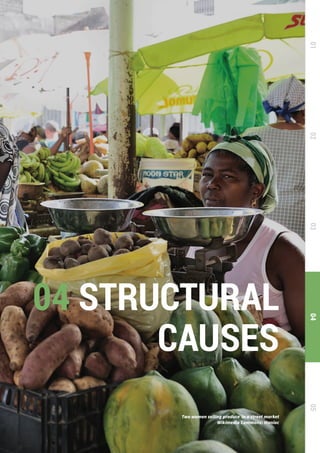
The global food system faces fundamental challenges that necessitate structural transformation to ensure food security while remaining within environmental limits. Despite adequate food production, over 795 million people are undernourished, reflecting deep-rooted humanitarian imbalances that current expansion trends cannot remedy. The analysis highlights the need for adaptive policies that prioritize nutrition, sustainability, and equitable livelihoods to address the complex interplay of environmental, social, and economic factors impacting global food systems.