Download as PDF, PPTX


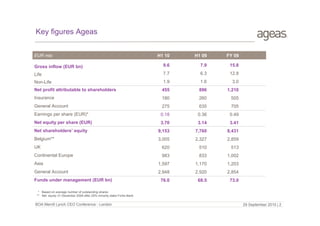
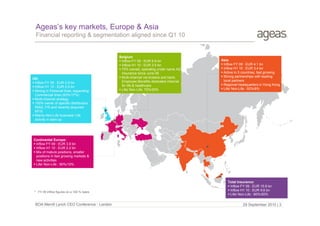
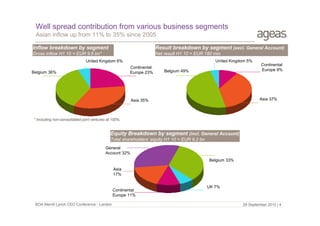


Ageas is a large insurance company operating in Europe and Asia. It has a balanced portfolio between life and non-life insurance as well as mature and emerging markets. While Ageas has strong market positions, it faces challenges from the economic environment including low interest rates, regulatory changes with the new Solvency II regulations, and improving operational performance in non-life insurance. Ageas has taken steps to reduce risk in its investment portfolio and improve underwriting results. It remains well capitalized and is preparing for the new regulatory regime.


