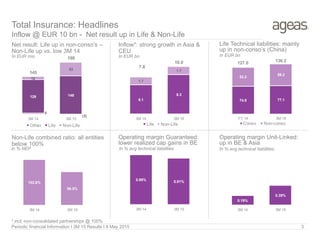
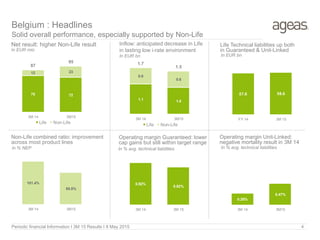
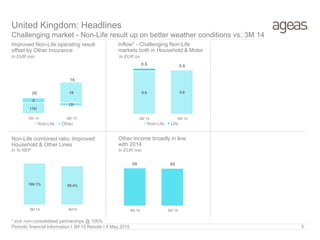
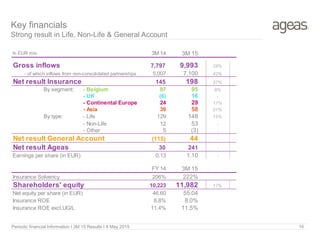
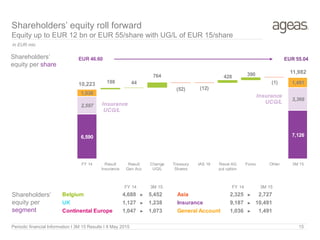
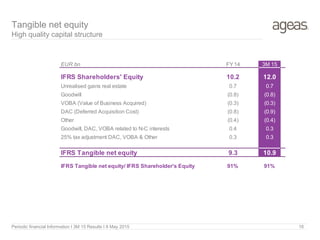
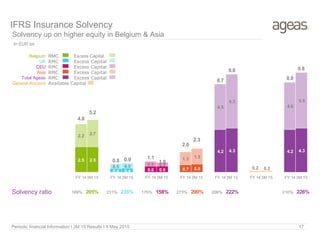
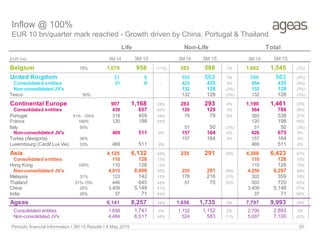
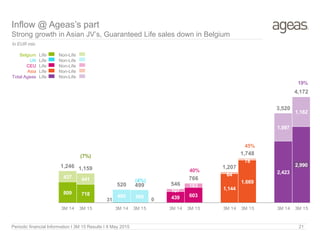
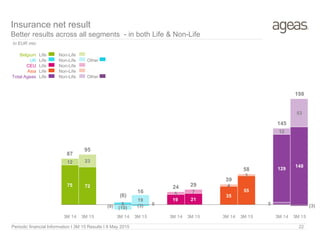
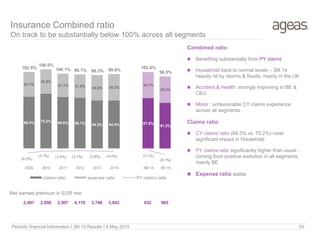
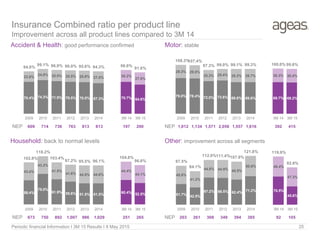
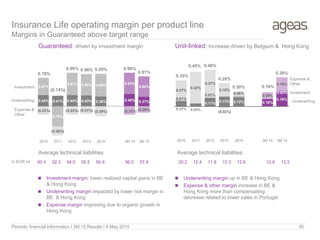
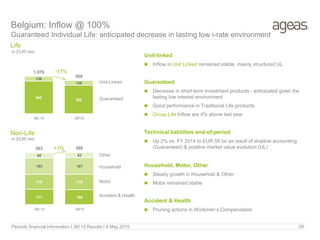
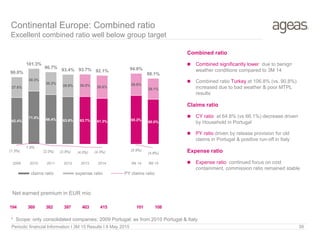
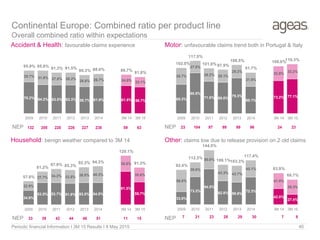
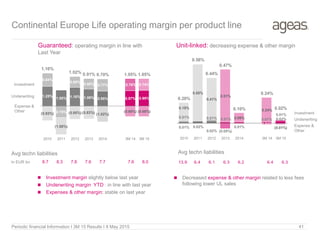
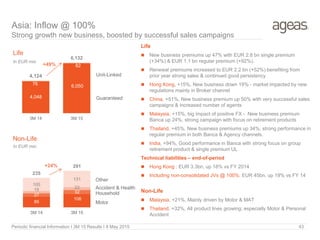
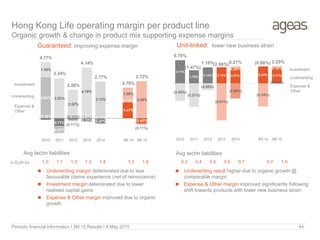
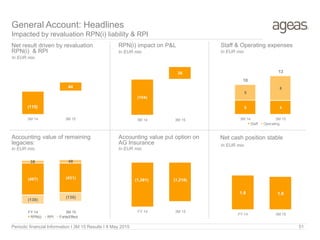
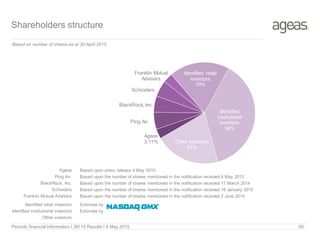
Ageas reported solid results for the first quarter of 2015. Insurance net profit increased 37% to EUR 198 million, driven by growth in both life and non-life segments. Gross inflows also increased 28% to EUR 9.9 billion. The group's net profit was EUR 241 million and shareholders' equity rose to EUR 11.9 billion. Insurance solvency increased to 222% and Ageas approved a gross cash dividend of EUR 1.55 per share to be paid.
Ageas is a listed international insurance Group with a heritage spanning 190 years.
It offers Retail and Business customers Life and Non-Life insurance products designed to suit their specific needs, today and tomorrow.
As one of Europe's larger insurance companies, Ageas concentrates its activities in Europe and Asia, which together make up the major part of the global insurance market. It operates successful insurance businesses in Belgium, the UK, Luxembourg, France, Italy, Portugal, Turkey, China, Malaysia, India, Thailand, Vietnam and the Philippines through a combination of wholly owned subsidiaries and long term partnerships with strong financial institutions and key distributors.
Ageas ranks among the market leaders in the countries in which it operates. It represents a staff force of over 40,000 people and reported annual inflows close to EUR 30 billion in 2015 (all figures at 100%).
Ageas is an international insurance group with a heritage spanning 190 years. Present in 13 countries across Europe and Asia, the company offers Life and Non-Life solutions to millions of Retail and Business customers.
Ageas helps customers to manage, anticipate and insure their risks through a wide range of products designed for their needs both today and in the future. Distinguished by an expertise in partnerships, Ageas has developed long term agreements with market-leading local financial institutions and distributors around the world allowing it to stay close to the customer.
As one of Europe’s larger insurance companies, Ageas is the No.1 insurer in Belgium and ranks among the market leaders in most of the countries in which it operates. With a total workforce of more than 40,000 people (including the non-consolidated partnerships), Ageas is present in Belgium, the UK, Luxembourg, France, Italy, Portugal, Turkey, China, Malaysia, India, Thailand, Vietnam and the Philippines.
In 2015 Ageas reported annual inflows close to EUR 30 billion (at 100%). Ageas is listed on Euronext Brussels and is included in the BEL20 index.
Ageas is an international insurance group with a heritage spanning 190 years. Present in 13 countries across Europe and Asia, the company offers Life and Non-Life solutions to millions of Retail and Business customers.
3M ThinkTank - Trends in Digital AnalyticsW2O Group
Chuck Hemann, Group Director of Analytics for WCG joined several social and digital innovators from P&G, Verizon, Sprinklr, IBM, Accenture, Hershey's and others to
Vital Trends in Digital Experience and Transformation in 2016 | Dreamforce 20...Dion Hinchcliffe
Here's the deck I presented at the Emerging Tech Trends track at the Hilton Union Square at Dreamforce 2016 last week. Updates on trends from last year and new trends both are included. A thorough list of what your organization should be considering from both a technology standpoint and as a business.
Booz Allen Hamilton created the Field Guide to Data Science to help organizations and missions understand how to make use of data as a resource. The Second Edition of the Field Guide, updated with new features and content, delivers our latest insights in a fast-changing field. http://bit.ly/1O78U42
An immersive workshop at General Assembly, SF. I typically teach this workshop at General Assembly, San Francisco. To see a list of my upcoming classes, visit https://generalassemb.ly/instructors/seth-familian/4813
I also teach this workshop as a private lunch-and-learn or half-day immersive session for corporate clients. To learn more about pricing and availability, please contact me at http://familian1.com
Ageas is an international insurance group with a heritage spanning 190 years. Present in 13 countries across Europe and Asia, the company offers Life and Non-Life solutions to millions of Retail and Business customers.
Ageas helps customers to manage, anticipate and insure their risks through a wide range of products designed for their needs both today and in the future. Distinguished by an expertise in partnerships, Ageas has developed long term agreements with market-leading local financial institutions and distributors around the world allowing it to stay close to the customer.
We are very satisfied with the strong nine month and third quarter results. They show that we are delivering on the promises of our Ambition 2018 strategic plan. The combined ratio, margins in guaranteed life, return on equity and solvency all exceed our targets.
Ageas delivered a strong set of first half-year figures evidencing good progress with respect to our Ambition 2018 strategic plan. Life inflows continued to grow while at the same time we optimised the product mix in Belgium and Asia. The result of our Life activities remained strong in all segments. The Non-Life businesses in Belgium and Continental Europe realised excellent results which were reflected in outstanding combined ratios.
Regulatory impact on banks and insurers investmentsAgeas
The financial sector is operating in a rapidly changing environment with new regulations coming up and with a growing dependency on macro-economic developments. In this context, banks and insurers are both confronted with the, Basel III and Solvency II regulations that will soon be effective. To get a better insight in the consequences and opportunities of these new regulations for their investment behavior, Ageas has asked Vlerick to make a detailed study.
Vlerick Business School and Ageas and its Belgian operational company AG Insurance, promoters of the Vlerick Chair “Centre for Financial Services”, strongly belief that the exchange between the business community and the academic world is beneficial for both parties by increasing the mutual understanding of each other’s strategies, challenges, opportunities and needs.
The European Unemployment Puzzle: implications from population agingGRAPE
We study the link between the evolving age structure of the working population and unemployment. We build a large new Keynesian OLG model with a realistic age structure, labor market frictions, sticky prices, and aggregate shocks. Once calibrated to the European economy, we quantify the extent to which demographic changes over the last three decades have contributed to the decline of the unemployment rate. Our findings yield important implications for the future evolution of unemployment given the anticipated further aging of the working population in Europe. We also quantify the implications for optimal monetary policy: lowering inflation volatility becomes less costly in terms of GDP and unemployment volatility, which hints that optimal monetary policy may be more hawkish in an aging society. Finally, our results also propose a partial reversal of the European-US unemployment puzzle due to the fact that the share of young workers is expected to remain robust in the US.
Poonawalla Fincorp and IndusInd Bank Introduce New Co-Branded Credit Cardnickysharmasucks
The unveiling of the IndusInd Bank Poonawalla Fincorp eLITE RuPay Platinum Credit Card marks a notable milestone in the Indian financial landscape, showcasing a successful partnership between two leading institutions, Poonawalla Fincorp and IndusInd Bank. This co-branded credit card not only offers users a plethora of benefits but also reflects a commitment to innovation and adaptation. With a focus on providing value-driven and customer-centric solutions, this launch represents more than just a new product—it signifies a step towards redefining the banking experience for millions. Promising convenience, rewards, and a touch of luxury in everyday financial transactions, this collaboration aims to cater to the evolving needs of customers and set new standards in the industry.
how to sell pi coins in South Korea profitably.DOT TECH
Yes. You can sell your pi network coins in South Korea or any other country, by finding a verified pi merchant
What is a verified pi merchant?
Since pi network is not launched yet on any exchange, the only way you can sell pi coins is by selling to a verified pi merchant, and this is because pi network is not launched yet on any exchange and no pre-sale or ico offerings Is done on pi.
Since there is no pre-sale, the only way exchanges can get pi is by buying from miners. So a pi merchant facilitates these transactions by acting as a bridge for both transactions.
How can i find a pi vendor/merchant?
Well for those who haven't traded with a pi merchant or who don't already have one. I will leave the telegram id of my personal pi merchant who i trade pi with.
Tele gram: @Pi_vendor_247
#pi #sell #nigeria #pinetwork #picoins #sellpi #Nigerian #tradepi #pinetworkcoins #sellmypi
how to sell pi coins in all Africa Countries.DOT TECH
Yes. You can sell your pi network for other cryptocurrencies like Bitcoin, usdt , Ethereum and other currencies And this is done easily with the help from a pi merchant.
What is a pi merchant ?
Since pi is not launched yet in any exchange. The only way you can sell right now is through merchants.
A verified Pi merchant is someone who buys pi network coins from miners and resell them to investors looking forward to hold massive quantities of pi coins before mainnet launch in 2026.
I will leave the telegram contact of my personal pi merchant to trade with.
@Pi_vendor_247
Exploring Abhay Bhutada’s Views After Poonawalla Fincorp’s Collaboration With...beulahfernandes8
The financial landscape in India has witnessed a significant development with the recent collaboration between Poonawalla Fincorp and IndusInd Bank.
The launch of the co-branded credit card, the IndusInd Bank Poonawalla Fincorp eLITE RuPay Platinum Credit Card, marks a major milestone for both entities.
This strategic move aims to redefine and elevate the banking experience for customers.
If you are looking for a pi coin investor. Then look no further because I have the right one he is a pi vendor (he buy and resell to whales in China). I met him on a crypto conference and ever since I and my friends have sold more than 10k pi coins to him And he bought all and still want more. I will drop his telegram handle below just send him a message.
@Pi_vendor_247
where can I find a legit pi merchant onlineDOT TECH
Yes. This is very easy what you need is a recommendation from someone who has successfully traded pi coins before with a merchant.
Who is a pi merchant?
A pi merchant is someone who buys pi network coins and resell them to Investors looking forward to hold thousands of pi coins before the open mainnet.
I will leave the telegram contact of my personal pi merchant to trade with
@Pi_vendor_247
Currently pi network is not tradable on binance or any other exchange because we are still in the enclosed mainnet.
Right now the only way to sell pi coins is by trading with a verified merchant.
What is a pi merchant?
A pi merchant is someone verified by pi network team and allowed to barter pi coins for goods and services.
Since pi network is not doing any pre-sale The only way exchanges like binance/huobi or crypto whales can get pi is by buying from miners. And a merchant stands in between the exchanges and the miners.
I will leave the telegram contact of my personal pi merchant. I and my friends has traded more than 6000pi coins successfully
Tele-gram
@Pi_vendor_247
What price will pi network be listed on exchangesDOT TECH
The rate at which pi will be listed is practically unknown. But due to speculations surrounding it the predicted rate is tends to be from 30$ — 50$.
So if you are interested in selling your pi network coins at a high rate tho. Or you can't wait till the mainnet launch in 2026. You can easily trade your pi coins with a merchant.
A merchant is someone who buys pi coins from miners and resell them to Investors looking forward to hold massive quantities till mainnet launch.
I will leave the telegram contact of my personal pi vendor to trade with.
@Pi_vendor_247
US Economic Outlook - Being Decided - M Capital Group August 2021.pdfpchutichetpong
The U.S. economy is continuing its impressive recovery from the COVID-19 pandemic and not slowing down despite re-occurring bumps. The U.S. savings rate reached its highest ever recorded level at 34% in April 2020 and Americans seem ready to spend. The sectors that had been hurt the most by the pandemic specifically reduced consumer spending, like retail, leisure, hospitality, and travel, are now experiencing massive growth in revenue and job openings.
Could this growth lead to a “Roaring Twenties”? As quickly as the U.S. economy contracted, experiencing a 9.1% drop in economic output relative to the business cycle in Q2 2020, the largest in recorded history, it has rebounded beyond expectations. This surprising growth seems to be fueled by the U.S. government’s aggressive fiscal and monetary policies, and an increase in consumer spending as mobility restrictions are lifted. Unemployment rates between June 2020 and June 2021 decreased by 5.2%, while the demand for labor is increasing, coupled with increasing wages to incentivize Americans to rejoin the labor force. Schools and businesses are expected to fully reopen soon. In parallel, vaccination rates across the country and the world continue to rise, with full vaccination rates of 50% and 14.8% respectively.
However, it is not completely smooth sailing from here. According to M Capital Group, the main risks that threaten the continued growth of the U.S. economy are inflation, unsettled trade relations, and another wave of Covid-19 mutations that could shut down the world again. Have we learned from the past year of COVID-19 and adapted our economy accordingly?
“In order for the U.S. economy to continue growing, whether there is another wave or not, the U.S. needs to focus on diversifying supply chains, supporting business investment, and maintaining consumer spending,” says Grace Feeley, a research analyst at M Capital Group.
While the economic indicators are positive, the risks are coming closer to manifesting and threatening such growth. The new variants spreading throughout the world, Delta, Lambda, and Gamma, are vaccine-resistant and muddy the predictions made about the economy and health of the country. These variants bring back the feeling of uncertainty that has wreaked havoc not only on the stock market but the mindset of people around the world. MCG provides unique insight on how to mitigate these risks to possibly ensure a bright economic future.
Financial Assets: Debit vs Equity Securities.pptxWrito-Finance
financial assets represent claim for future benefit or cash. Financial assets are formed by establishing contracts between participants. These financial assets are used for collection of huge amounts of money for business purposes.
Two major Types: Debt Securities and Equity Securities.
Debt Securities are Also known as fixed-income securities or instruments. The type of assets is formed by establishing contracts between investor and issuer of the asset.
• The first type of Debit securities is BONDS. Bonds are issued by corporations and government (both local and national government).
• The second important type of Debit security is NOTES. Apart from similarities associated with notes and bonds, notes have shorter term maturity.
• The 3rd important type of Debit security is TRESURY BILLS. These securities have short-term ranging from three months, six months, and one year. Issuer of such securities are governments.
• Above discussed debit securities are mostly issued by governments and corporations. CERTIFICATE OF DEPOSITS CDs are issued by Banks and Financial Institutions. Risk factor associated with CDs gets reduced when issued by reputable institutions or Banks.
Following are the risk attached with debt securities: Credit risk, interest rate risk and currency risk
There are no fixed maturity dates in such securities, and asset’s value is determined by company’s performance. There are two major types of equity securities: common stock and preferred stock.
Common Stock: These are simple equity securities and bear no complexities which the preferred stock bears. Holders of such securities or instrument have the voting rights when it comes to select the company’s board of director or the business decisions to be made.
Preferred Stock: Preferred stocks are sometime referred to as hybrid securities, because it contains elements of both debit security and equity security. Preferred stock confers ownership rights to security holder that is why it is equity instrument
<a href="https://www.writofinance.com/equity-securities-features-types-risk/" >Equity securities </a> as a whole is used for capital funding for companies. Companies have multiple expenses to cover. Potential growth of company is required in competitive market. So, these securities are used for capital generation, and then uses it for company’s growth.
Concluding remarks
Both are employed in business. Businesses are often established through debit securities, then what is the need for equity securities. Companies have to cover multiple expenses and expansion of business. They can also use equity instruments for repayment of debits. So, there are multiple uses for securities. As an investor, you need tools for analysis. Investment decisions are made by carefully analyzing the market. For better analysis of the stock market, investors often employ financial analysis of companies.
what is the future of Pi Network currency.DOT TECH
The future of the Pi cryptocurrency is uncertain, and its success will depend on several factors. Pi is a relatively new cryptocurrency that aims to be user-friendly and accessible to a wide audience. Here are a few key considerations for its future:
Message: @Pi_vendor_247 on telegram if u want to sell PI COINS.
1. Mainnet Launch: As of my last knowledge update in January 2022, Pi was still in the testnet phase. Its success will depend on a successful transition to a mainnet, where actual transactions can take place.
2. User Adoption: Pi's success will be closely tied to user adoption. The more users who join the network and actively participate, the stronger the ecosystem can become.
3. Utility and Use Cases: For a cryptocurrency to thrive, it must offer utility and practical use cases. The Pi team has talked about various applications, including peer-to-peer transactions, smart contracts, and more. The development and implementation of these features will be essential.
4. Regulatory Environment: The regulatory environment for cryptocurrencies is evolving globally. How Pi navigates and complies with regulations in various jurisdictions will significantly impact its future.
5. Technology Development: The Pi network must continue to develop and improve its technology, security, and scalability to compete with established cryptocurrencies.
6. Community Engagement: The Pi community plays a critical role in its future. Engaged users can help build trust and grow the network.
7. Monetization and Sustainability: The Pi team's monetization strategy, such as fees, partnerships, or other revenue sources, will affect its long-term sustainability.
It's essential to approach Pi or any new cryptocurrency with caution and conduct due diligence. Cryptocurrency investments involve risks, and potential rewards can be uncertain. The success and future of Pi will depend on the collective efforts of its team, community, and the broader cryptocurrency market dynamics. It's advisable to stay updated on Pi's development and follow any updates from the official Pi Network website or announcements from the team.
2. Insurance
performance
Group result
Balance sheet
Progress in
legacies
Dividend
Insurance net profit of EUR 198 mio (+37%)
Inflow @ 100% of EUR 10.0 bn (+28%)
Life Guaranteed margin at 91 bps (vs.98 bps)
Group combined ratio at 96.5%* (vs.102.6%)
Consolidated Life Technical Liabilities at EUR 77.1 bn* (+ 3% vs. FY ‘14)
Group net profit of EUR 241 mio
General Account net profit of EUR 44 mio, largely driven by RPN(i)
Shareholders’ equity at EUR 12.0 bn or EUR 55.04 per share
UCG/L at EUR 15.44 per share
Insurance solvency at 222%, Group solvency at 226%
Net cash position General Account at EUR 1.6 bn (stable)
New agreement between ageas & BNP P to purchase CASHES
Gross cash dividend of EUR 1.55 per share approved / paid today
Main messages
Ageas reports a solid start of the year
Periodic financial Information I 3M 15 Results I 8 May 2015 1
* Consolidated entities only
3. 2
Changes in Management Committee as per 1 October 2015
Antonio Cano becomes COO - replaced as CEO Belgium by Hans De Cuyper
Executive
Committee
Emmanuel Van Grimbergen
GRO
Antonio Cano
CEO Belgium
Andy Watson
CEO UK
Gary Crist
CEO Asia
Steven Braekeveldt
CEO CEU
Management Committee
Board
Bart De Smet
CEO
Barry Smith
COO
Filip Coremans
CRO
Christophe Boizard
CFO
Hans De Cuyper
current function: CFO Belgium
Periodic financial Information I 3M 15 Results I 8 May 2015
retiring
4. Net result: Life up in non-conso’s –
Non-Life up vs. low 3M 14
In EUR mio In EUR bn
Non-Life combined ratio: all entities
below 100%
Inflow*: strong growth in Asia &
CEU
In EUR bn
Total Insurance: Headlines
Inflow @ EUR 10 bn - Net result up in Life & Non-Life
Periodic financial Information I 3M 15 Results I 8 May 2015 3
Life Technical liabilities: mainly
up in non-conso’s (China)
Operating margin Guaranteed:
lower realized cap gains in BE
Operating margin Unit-Linked:
up in BE & Asia
In % avg technical liabilities In % avg technical liabilities
* incl. non-consolidated partnerships @ 100%
In % NEP
5
(3)
129 148
12
53
145
198
3M 14 3M 15
Other Life Non-Life
6.1
8.3
1.7
1.7
7.8
10.0
3M 14 3M 15
Life Non-Life
74.8 77.1
52.2
59.2
127.0 136.2
FY 14 3M 15
Conso Non-conso
102.6%
96.5%
3M 14 3M 15
0.98% 0.91%
3M 14 3M 15
0.19%
0.39%
3M 14 3M 15
5. 101.4%
95.8%
3M 14 3M15
Periodic financial Information I 3M 15 Results I 8 May 2015 4
Net result: higher Non-Life result
In EUR mio
In EUR bn
Operating margin Guaranteed: lower
cap gains but still within target range
Non-Life combined ratio: improvement
across most product lines
Inflow: anticipated decrease in Life
in lasting low i-rate environment
Life Technical liabilities up both
in Guaranteed & Unit-Linked
In EUR bn
Belgium : Headlines
Solid overall performance, especially supported by Non-Life
Operating margin Unit-Linked:
negative mortality result in 3M 14
In % avg. technical liabilities In % avg. technical liabilitiesIn % NEP
75 72
12 23
87
95
3M 14 3M15
Life Non-Life
1.1 1.0
0.6
0.6
1.7
1.5
3M 14 3M15
Life Non-Life
57.6 58.6
FY 14 3M 15
0.92%
0.82%
3M 14 3M 15
0.26%
0.47%
3M 14 3M15
6. Improved Non-Life operating result
offset by Other Insurance
In EUR mio
United Kingdom: Headlines
Challenging market - Non-Life result up on better weather conditions vs. 3M 14
Periodic financial Information I 3M 15 Results I 8 May 2015 5
Non-Life combined ratio: Improved
Household & Other Lines
In % NEP
In EUR bn
Inflow* - Challenging Non-Life
markets both in Household & Motor
Other income broadly in line
with 2014
In EUR mio
* incl. non-consolidated partnerships @ 100%
(10)
19
5
(3)
(6)
16
3M 14 3M 15
Non-Life Other
0.6 0.6
0.6 0.6
3M 14 3M 15
Non-Life Life
106.1% 99.4%
3M 14 3M15
69 69
3M 14 3M 15
7. Net profit increase driven by
Luxembourg & Portugal Non-Life
In EUR mio In EUR bn
Non-Life combined ratio excellent
owing to benign weather
Life Inflow*: sales up in all
entities In EUR bn
Continental Europe: Headlines
Strong inflow & increased net profit in Life & Non-Life
Operating margin Guaranteed in
line with 2014
Periodic financial Information I 3M 15 Results I 8 May 2015 6
Life Technical liabilities up
In % avg technical liabilities
Operating margin Unit-Linked:
lower sales in Portugal
In % avg technical liabilitiesIn % NEP
* incl. non-consolidated partnerships @ 100%
0.9
1.2
0.3
0.3
1.2
1.5
3M 14 3M 15
Life Non-Life
19 21
5
7
24
29
3M 14 3M 15
Life Non-Life
14.5 15.3
17.3 17.7
31.8 32.9
FY 14 3M 15
Conso Non-conso
94.8%
88.1%
3M 14 3M 15
0.24%
0.02%
3M 14 3M 15
1.05% 1.05%
3M 14 3M 15
8. Net result: Better performance in
most countries & positive FX
In EUR mio In EUR bn
Non-Life combined ratio increased
but still excellent
Inflow* growth fuelled by China &
Thailand
Life Technical liabilities up across
all entities
In EUR bn
Asia: Headlines
Strong Life result driven by new business & renewals
Periodic financial Information I 3M 15 Results I 8 May 2015 7
In % avg technical liabilities In EUR mio
Life operating margin Hong Kong:
strong improvement in UL
Result non-conso partnerships:
strong result in China & Thailand
In % NEP
* incl. non-consolidated partnerships @ 100%
35
55
4
3
38
58
3M 14 3M 15
Life Non-Life
4.1
6.1
0.2
0.3
4.4
6.4
3M 14 3M15
Life Non-Life
89.7%
92.1%
3M 14 3M 15
1.50%
2.55%
3M 14 3M 15
2.8 3.3
34.9 41.5
37.7
44.8
FY 14 3M 15
Conso Non-conso
32
44
4
3
36
47
3M 14 3M15
Life Non-Life
9. FY 14 3M 15
Net result driven by revaluation
RPN(i) & RPI
In EUR mio
Accounting value of remaining
legacies:
General Account: Headlines
Impacted by revaluation RPN(i) liability & RPI
Periodic financial Information I 3M 15 Results I 8 May 2015 8
Net cash position stable
In EUR mio
RPN(i) impact on P&L Staff & Operating expenses
In EUR mio
In EUR mio
In EUR mio
(115)
44
3M 14 3M 15
In EUR mio
Accounting value put option on
AG Insurance
5 5
5
8
10
13
3M 14 3M 15
Staff Operating
(1,391) (1,218)(467) (431)
38 48
(130)
(130)
FY 14 3M 15
RPN(i) RPI FortisEffect
1.6 1.6
FY 14 3M 15
(104)
36
3M 14 3M 15
10. Periodic financial Information I 3M 15 Results I 8 May 2015 9
Progress in solving financial legacies
Ageas & BNP Paribas close agreement on remaining CASHES
BNP P purchases CASHES @ own discretion re purchase price & timing
Conversion into underlying Ageas shares @ end of each month
No minimum targets - expiration YE 2016
Ageas will pay pro-rata RPN(i) value to BNP P @ conversion
Ageas will receive a break-up fee
Decreasing volatility of results
Reduction of interest payments & credit exposure
Ageas will report monthly on website on progress made re transaction
12,000 convertible securities issued in 2007 @ 3m Euribor + 200 bps
12.5 mio underlying Ageas shares
After tender 02/12 37.06% outstanding: 4,447 CASHES & 4.6 mio underlying shares
Financial instrument resulting in interest payment 3m Euribor + 90 bps on RPN
Value RPN(I) liability @ 31/03/15 at EUR 431 mio
CASHES
ISIN BE0933899800
Held by BNP PF
Reporting
Transaction
details
RPN(i)
Held by ageas
Rationale
11. Periodic financial Information I 3M 15 Results I 8 May 2015 10
Shareholders’ equity roll forward
Equity up to EUR 12 bn or EUR 55/share with UG/L of EUR 15/share
In EUR mio
6,590 7,126
2,597
3,366
1,036
1,491198 44
764 428 390
(52) (12)
(1)
EUR 46.60 EUR 55.04
10,223
11,982
FY 14 Result
Insurance
Result
Gen Acc
Change
UG/L
Treasury
Shares
IAS 19 Reval AG
put option
Forex Other 3M 15
Insurance
UCG/L
Insurance
UCG/L
Shareholders’
equity per
segment
Shareholders’
equity per share
FY 14 3M 15 FY 14 3M 15
Belgium 4,688 ► 5,452 Asia 2,325 ► 2,727
UK 1,127 ► 1,238 Insurance 9,187 ► 10,491
Continental Europe 1,047 ► 1,073 General Account 1,036 ► 1,491
12. Periodic financial Information I 3M 15 Results I 8 May 2015 11
IFRS Insurance Solvency
Solvency up on higher equity in Belgium & Asia
2.5 2.5
0.4 0.4 0.6 0.6 0.7 0.8
4.2 4.3 4.2 4.3
2.2 2.7
0.5 0.5 0.5 0.4
1.3 1.5
4.5
5.3
0.2 0.2
4.6
5.5
4.8
5.2
0.8 0.9 1.1
1.0
2.0
2.3
8.7
9.6
8.8
9.8
FY 14 3M 15 FY 14 3M 15 FY 14 3M 15 FY 143M 15 FY 14 3M 15 FY 14 3M 15 FY 14 3M 15
Belgium
UK
CEU
Asia
Total Ageas
General Account
RMC Excess Capital
RMC Excess Capital
RMC Excess Capital
RMC Excess Capital
RMC Excess Capital
Available Capital
In EUR bn
189% 205% 231% 235% 176% 158% 273% 290% 206% 222% 210% 226%Solvency ratio
13. 10 bn Inflow – Asian growth
vs European Life volumes
Solid results
- both in Life & Non-Life
- some attention points remain
Gross dividend of EUR 1.55/share
paid today
Conclusions: 2015 started well
Periodic financial Information I 3M 15 Results I 8 May 2015 12
15. Periodic financial Information I 3M 15 Results I 8 May 2015 14
Key financials
Strong result in Life, Non-Life & General Account
In EUR mio 3M 14 3M 15
Gross inflows 7,797 9,993 28%
- of which inflows from non-consolidated partnerships 5,007 7,100 42%
Net result Insurance 145 198 37%
By segment: - Belgium 87 95 9%
- UK (6) 16 -
- Continental Europe 24 29 17%
- Asia 39 58 51%
By type: - Life 129 148 15%
- Non-Life 12 53 -
- Other 5 (3) -
Net result General Account (115) 44 -
Net result Ageas 30 241 -
Earnings per share (in EUR) 0.13 1.10 -
FY 14 3M 15
Insurance Solvency 206% 222%
Shareholders' equity 10,223 11,982 17%
Net equity per share (in EUR) 46.60 55.04
Insurance ROE 8.8% 8.0%
Insurance ROE excl.UG/L 11.4% 11.5%
16. Periodic financial Information I 3M 15 Results I 8 May 2015 15
Shareholders’ equity roll forward
Equity up to EUR 12 bn or EUR 55/share with UG/L of EUR 15/share
In EUR mio
6,590 7,126
2,597
3,366
1,036
1,491198 44
764 428 390
(52) (12)
(1)
EUR 46.60 EUR 55.04
10,223
11,982
FY 14 Result
Insurance
Result
Gen Acc
Change
UG/L
Treasury
Shares
IAS 19 Reval AG
put option
Forex Other 3M 15
Insurance
UCG/L
Insurance
UCG/L
Shareholders’
equity per
segment
Shareholders’
equity per share
FY 14 3M 15 FY 14 3M 15
Belgium 4,688 ► 5,452 Asia 2,325 ► 2,727
UK 1,127 ► 1,238 Insurance 9,187 ► 10,491
Continental Europe 1,047 ► 1,073 General Account 1,036 ► 1,491
17. Periodic financial Information I 3M 15 Results I 8 May 2015 16
Tangible net equity
High quality capital structure
10/03/2010 I page 16
EUR bn FY14 3M 15
IFRS Shareholders' Equity 10.2 12.0
Unrealised gains real estate 0.7 0.7
Goodwill (0.8) (0.8)
VOBA (Value of Business Acquired) (0.3) (0.3)
DAC (Deferred Acquisition Cost) (0.8) (0.9)
Other (0.4) (0.4)
Goodwill, DAC, VOBA related to N-C interests 0.4 0.3
25% tax adjustment DAC, VOBA & Other 0.3 0.3
IFRS Tangible net equity 9.3 10.9
IFRS Tangible net equity/ IFRS Shareholder's Equity 91% 91%
18. Periodic financial Information I 3M 15 Results I 8 May 2015 17
IFRS Insurance Solvency
Solvency up on higher equity in Belgium & Asia
2.5 2.5
0.4 0.4 0.6 0.6 0.7 0.8
4.2 4.3 4.2 4.3
2.2 2.7
0.5 0.5 0.5 0.4
1.3 1.5
4.5
5.3
0.2 0.2
4.6
5.5
4.8
5.2
0.8 0.9 1.1
1.0
2.0
2.3
8.7
9.6
8.8
9.8
FY 14 3M 15 FY 14 3M 15 FY 14 3M 15 FY 143M 15 FY 14 3M 15 FY 14 3M 15 FY 14 3M 15
Belgium
UK
CEU
Asia
Total Ageas
General Account
RMC Excess Capital
RMC Excess Capital
RMC Excess Capital
RMC Excess Capital
RMC Excess Capital
Available Capital
In EUR bn
189% 205% 231% 235% 176% 158% 273% 290% 206% 222% 210% 226%Solvency ratio
20. Net result: Life up in non-conso’s –
Non-Life up vs. low 3M 14
In EUR mio In EUR bn
Non-Life combined ratio: all entities
below 100%
Inflow*: strong growth in Asia &
CEU
In EUR bn
Total Insurance: Headlines
Inflow @ EUR 10 bn - Net result up in Life & Non-Life
Periodic financial Information I 3M 15 Results I 8 May 2015 19
Life Technical liabilities: mainly
up in non-conso’s (China)
Operating margin Guaranteed:
lower realized cap gains in BE
Operating margin Unit-Linked:
up in BE & Asia
In % avg technical liabilities In % avg technical liabilities
* incl. non-consolidated partnerships @ 100%
In % NEP
5
(3)
129 148
12
53
145
198
3M 14 3M 15
Other Life Non-Life
6.1
8.3
1.7
1.77.8
10.0
3M 14 3M 15
Life Non-Life
74.8 77.1
52.2
59.2
127.0 136.2
FY 14 3M 15
Conso Non-conso
102.6%
96.5%
3M 14 3M 15
0.98% 0.91%
3M 14 3M 15
0.19%
0.39%
3M 14 3M 15
22. Belgium
UK
CEU
Asia
Total Ageas
Life Non-Life
Life Non-Life
Life Non-Life
Life Non-Life
Life Non-Life
Inflow @ Ageas’s part
Strong growth in Asian JV’s, Guaranteed Life sales down in Belgium
In EUR mio
Periodic financial Information I 3M 15 Results I 8 May 2015 21
809 718
31 0 439 603
1,144
1,669
2,423
2,990
437 441
489 499
107
163
64
78
1,097
1,182
(7%)
(4%)
40%
45%
19%
1,246 1,159
520 499 546
766
1,207
1,748
3,520
4,172
3M 14 3M 15 3M 14 3M 15 3M 14 3M 15 3M 14 3M 15 3M 14 3M 15
23. Insurance net result
Better results across all segments - in both Life & Non-Life
Belgium
UK
CEU
Asia
Total Ageas
Life Non-Life
Life Non-Life Other
Life Non-Life
Life Non-Life
Life Non-Life Other
5 (3) 5 (3)
75 72
(0) 0
19 21
35
55
129
148
12 23
(10)
19
5 7
4
3
12
53
87
95
(6)
16
24 29
39
58
145
198
3M 14 3M 15 3M 14 3M 15 3M 14 3M 15 3M 14 3M 15 3M 14 3M 15
In EUR mio
Periodic financial Information I 3M 15 Results I 8 May 2015 22
24. EUR mio 3M 14 3M 15
Life 34 16 less cap gains mainly in fixed income
Non-Life 3 1 & to lesser extend in equities
Total Belgium 37 17
Life
Non-Life 1 5
Other 0
Total UK 1 5
Life 1 2
Non-Life (0) 0
Total CEU 1 2
Life 9 5
Non-Life 1
Total Asia 10 5
Life 44 23
Non-Life 5 6
Other 0
Total Ageas 49 30
10/03/2010 I page 23
Overview of net realised capital gains* by segment
Less impact of capital gains on Ageas’s net profit
Periodic financial Information I 3M 15 Results I 8 May 2015 23
* Net capital gains include capital gains, impairment & related changes in profit sharing, net of tax & @ ageas’s part – CEU JV’s not included
25. Periodic financial Information I 3M 15 Results I 8 May 2015 24
Insurance Combined ratio
On track to be substantially below 100% across all segments
Combined ratio
Benefiting substantially from PY claims
Household back to normal levels – 3M 14
heavily hit by storms & floods, mainly in the UK
Accident & Health: strongly improving in BE &
CEU
Motor : unfavourable CY claims experience
across all segments
Claims ratio
CY claims ratio (69.3% vs. 70.2%) most
significant impact in Household
PY claims ratio significantly higher than usual -
coming from positive evolution in all segments,
mainly BE
Expense ratio stable
69.4% 73.2% 69.0% 68.1% 64.3% 64.4% 67.5%
61.2%
33.1%
32.8%
31.1% 31.0% 34.0% 35.2%
35.1%
35.3%
102.5%
106.0%
100.1% 99.1% 98.3% 99.6%
102.6%
96.5%
(6.0%)
(3.7%) (3.5%) (3.1%) (3.8%) (4.0%) (2.7%)
(8.1%)
2009 2010 2011 2012 2013 2014 3M 14 3M 15
claims ratio expense ratio PY claims ratio
2,497 2,858 3,507 4,178 3,749 3,843 932 985
Net earned premium in EUR mio
27. 0.07% 0.04%
0.11% 0.13% 0.12% 0.10%
0.19%0.01%
0.01%
(0.02%)
0.02%
0.27%
0.42%
0.37%
0.18%
0.06%
0.09%
0.18%
0.35%
0.45% 0.48%
0.28%
0.20% 0.19%
0.39%
2010 2011 2012 2013 2014 3M 14 3M 15
0.44% 0.41% 0.44% 0.43% 0.38% 0.48% 0.37%
0.67%
(0.79%)
0.87% 0.83% 0.90% 0.83%
0.80%
(0.33%)
(0.36%)
(0.33%) (0.31%) (0.39%) (0.33%) (0.26%)
0.78%
(0.74%)
0.99% 0.96% 0.89% 0.98%
0.91%
2010 2011 2012 2013 2014 3M 14 3M 15
Insurance Life operating margin per product line
Margins in Guaranteed above target range
Guaranteed: driven by investment margin Unit-linked: increase driven by Belgium & Hong Kong
Average technical liabilities Average technical liabilities
Underwriting margin up in BE & Hong Kong
Expense & other margin increase in BE &
Hong Kong more than compensating
decrease related to lower sales in Portugal
Investment margin: lower realized capital gains in BE
& Hong Kong
Underwriting margin impacted by lower risk margin in
BE & Hong Kong
Expense margin improving due to organic growth in
Hong Kong
Periodic financial Information I 3M 15 Results I 8 May 2015 26
Expense &
Other
Investment
Underwriting
Expense &
Other
Investment
Underwriting
In EUR bn 50.4 52.3 54.0 55.5 56.9 56.0 57.8 20.2 12.4 11.8 12.3 12.6 12.6 13.3
28. 101.4%
95.8%
3M 14 3M15
Periodic financial Information I 3M 15 Results I 8 May 2015 27
Net result: higher Non-Life result
In EUR mio
In EUR bn
Operating margin Guaranteed: lower
cap gains but still within target range
Non-Life combined ratio: improvement
across most product lines
Inflow: anticipated decrease in Life
in lasting low i-rate environment
Life Technical liabilities up both
in Guaranteed & Unit-Linked
In EUR bn
Belgium : Headlines
Solid overall performance, especially supported by Non-Life
Operating margin Unit-Linked:
negative mortality result in 3M 14
In % avg. technical liabilities In % avg. technical liabilitiesIn % NEP
75 72
12 23
87
95
3M 14 3M15
Life Non-Life
1.1 1.0
0.6
0.6
1.7
1.5
3M 14 3M15
Life Non-Life
57.6 58.6
FY 14 3M 15
0.92%
0.82%
3M 14 3M 15
0.26%
0.47%
3M 14 3M15
29. 171 168
170 170
183 187
60 63
583 588
3M 14 3M15
940
822
138
136
1,079
958
3M 14 3M15
-11%
Life
In EUR mio
Non-Life
In EUR mio
Unit-Linked
Guaranteed
Other
Household
Accident & Health
Motor
Periodic financial Information I 3M 15 Results I 8 May 2015 28
Belgium: Inflow @ 100%
Guaranteed Individual Life: anticipated decrease in lasting low i-rate environment
+1%
Unit-linked
Inflow in Unit Linked remained stable, mainly structured UL
Guaranteed
Decrease in short term investment products - anticipated given the
lasting low interest environment
Good performance in Traditional Life products.
Group Life Inflow are 4% above last year
Technical liabilities end-of-period
Up 2% vs. FY 2014 to EUR 59 bn as result of shadow accounting
(Guaranteed) & positive market value evolution (UL)
Household, Motor, Other
Steady growth in Household & Other
Motor remained stable
Accident & Health
Pruning actions in Workmen’s Compensation
30. Periodic financial Information I 3M 15 Results I 8 May 2015 29
Belgium: Combined ratio
Improvement across most product lines
Net earned premium in EUR mio
Combined ratio
Positively impacted by significant
improvement PY claims ratio, more than
offsetting increase in CY claims ratio
Claims ratio
CY ratio at 71.1% (vs. 68.8%) -
deterioration in Household mainly due to
higher large claims – increase of claims
frequency in Motor
PY ratio: strongly impacted by increase of
provision for recoveries (mainly in
Household & Workmen’s Compensation),
good prior year evolution in Motor –
consequence PY reserve strengthening in
TPL
Expense ratio almost stable
64.1% 68.7% 64.3% 62.7% 63.2% 63.5% 63.9%
57.8%
36.8%
36.4%
36.8% 36.8% 36.7% 37.7% 37.5%
38.0%
100.9%
105.1%
101.1% 99.5% 99.9% 101.2% 101.4%
95.8%
(8.0%)
(6.6%) (7.3%)
(4.5%) (3.6%) (3.4%) (4.9%)
(13.3%)
2009 2010 2011 2012 2013 2014 3M 14 3M 15
claims ratio expense ratio PY claims ratio
1,469 1,541 1,601 1,698 1,785 1,815 445 454
32. 0.03% (0.05%)
0.04% 0.04% (0.02%)
(0.04%) 0.05%
0.64%
0.50% 0.44%
0.38%
0.32% 0.30%
0.42%
0.66%
0.45% 0.47%
0.41%
0.30% 0.26%
0.47%
2010 2011 2012 2013 2014 3M 14 3M 15
Insurance Life operating margin per product line
Margins in Guaranteed within target range - UL margin almost doubled
Guaranteed: strong despite lower capital
gains
Unit-linked: return to level of prior years
Average technical liabilities Average technical liabilities
Operating result almost doubled from EUR 4 mio to
EUR 7 mio
Expense & other margin significantly low last year due
to good mortality results & one-off
Average Technical Liabilities up 8% driven by market
values evolution
Operating result amounted to EUR 98 mio, down 10%
Investment margin decreased mainly due to lower
realized capital gains
Underwriting margin down due to risk margin
Average Technical Liabilities up on acquisition Fidea’s
Group Life portfolio
Periodic financial Information I 3M 15 Results I 8 May 2015 31
Expense &
Other
Investment
Underwriting Expense &
Other
Underwriting
In EUR bn 40.7 42.9 42.9 44.9 46.4 47.5 47.0 48.0
0.28% 0.32% 0.32% 0.32% 0.30% 0.35% 0.29%
0.57%
(0.80%)
0.93% 0.88% 0.95% 0.87%
0.84%
(0.21%)
(0.30%)
(0.29%) (0.31%) (0.38%) (0.30%) (0.31%)
0.64%
(0.78%)
0.96% 0.89% 0.87% 0.92%
0.82%
2010 2011 2012 2013 2014 3M 14 3M 15
6.0 5.6 5.6 5.2 5.4 5.7 5.6 6.0
33. Periodic financial Information I 3M 15 Results I 8 May 2015 32
Margin evolution Assets & Liabilities Belgium
Only marginal evolution on back book vs. FY 14
Life
Back book
FY 12 FY 13 FY 14 3M 15
Guaranteed interest rate 2.89% 2.80% 2.71% 2.70%
Fixed income yield 4.03% 3.97% 3.84% 3.83%
FY 13 FY 14 3M 15
Fixed income yield 3.29% 2.89% 2.00%
Reinvested amount (EUR bn) 5.5 4.6 1.1
Loans to Regional entities - state guarantees - bought before QE decisions
Govies Core countries - long maturity - bought before QE decisions
Non Financial Corporate bonds
USD High yield - hedged into EUR
New money
Life & Non-Life
34. Improved Non-Life operating result
offset by Other Insurance
In EUR mio
United Kingdom: Headlines
Challenging market - Non-Life result up on better weather conditions vs. 3M 14
Periodic financial Information I 3M 15 Results I 8 May 2015 33
Non-Life combined ratio: Improved
Household & Other Lines
In % NEP
In EUR bn
Inflow* - Challenging Non-Life
markets both in Household & Motor
Other income broadly in line
with 2014
In EUR mio
* incl. non-consolidated partnerships @ 100%
(10)
19
5
(3)
(6)
16
3M 14 3M 15
Non-Life Other
0.6 0.6
0.6 0.6
3M 14 3M 15
Non-Life Life
106.1% 99.4%
3M 14 3M15
69 69
3M 14 3M 15
35. 16 15
367 367
123 123
50 59
555 563
3M 14 3M 15
Motor
Other
Household
Accident & Health
Non-Life
In EUR mio
2%
United Kingdom: Inflow @ 100%
Non-Life Inflow up 2% thanks to FX
Non-Life
Up 2%, but down 9% at constant FX reflecting challenging pricing
conditions in the market
Motor favourable FX offsets lower volumes as result of deliberate
pricing strategy
Household flat to prior years as Ageas maintains pricing discipline
compared with competitors
Other lines including Commercial & Special Risks up 19% as a result
of several new schemes in late 2014
Other Insurance (including Retail)
YTD total income of EUR 69 mio, flat to last year but 11% down @
constant FX due to continued competitive environment – 2014 income
benefited from a legal settlement (EUR 6 mio)
Periodic financial Information I 3M 15 Results I 8 May 2015 34
36. 80.4% 81.5%
74.6% 73.3%
65.6% 66.3%
72.3%
65.3%
27.7% 28.0%
25.3% 26.5%
32.2% 33.5%
33.8%
34.1%
108.1% 109.5%
99.9% 99.8% 97.8% 99.8%
106.1%
99.4%
(3.5%)
(1.1%) 0.1% (2.1%) (4.0%) (4.6%)
(0.6%)
(3.4%)
2009 2010 2011 2012 2013 2014 3M 14 3M 15
claims ratio expense ratio PY claims ratio
Periodic financial Information I 3M 15 Results I 8 May 2015 35
United Kingdom: Combined ratio
Below 100% reflecting good underlying performance in Household & Other Lines
Net earned premium in EUR mio
Combined ratio
Combined ratio continued sub 100%
performance
Claims ratio
Claims ratio reflecting improved Household &
Other lines performance
CY ratio at 68.8% (vs. 72.9%) significant
reduction primarily due to benign weather partly
offset by accidental damage claims in Motor
PY ratio: driven by a release of reserves in
Other lines from yearly Q1 reserving review &
favourable development in A&H
Expense ratio
Increase driven predominantly by higher
commissions because of changed schemes in
Accident & Health
* Restatement for deconsolidation of Tesco Underwriting since 2013
834 948 1,524 2,083 1,562 1,613 386 422
38. Net profit increase driven by
Luxembourg & Portugal Non-Life
In EUR mio In EUR bn
Non-Life combined ratio excellent
owing to benign weather
Life Inflow*: sales up in all
entities In EUR bn
Continental Europe: Headlines
Strong inflow & increased net profit in Life & Non-Life
Operating margin Guaranteed in
line with 2014
Periodic financial Information I 3M 15 Results I 8 May 2015 37
Life Technical liabilities up
In % avg technical liabilities
Operating margin Unit-Linked:
lower sales in Portugal
In % avg technical liabilitiesIn % NEP
* incl. non-consolidated partnerships @ 100%
0.9
1.2
0.3
0.3
1.2
1.5
3M 14 3M 15
Life Non-Life
19 21
5
7
24
29
3M 14 3M 15
Life Non-Life
14.5 15.3
17.3 17.7
31.8 32.9
FY 14 3M 15
Conso Non-conso
94.8%
88.1%
3M 14 3M 15
0.24%
0.02%
3M 14 3M 15
1.05% 1.05%
3M 14 3M 15
39. 490
642
417
526
907
1,168
3M 14 3M 15
96 102
75 69
57 65
55 57
283 293
3M 14 3M 15
+29%
Life
In EUR mio
Non-Life
In EUR mio
Continental Europe: Inflow @ 100%
Higher Life sales - Non-Life driven by Portugal & Turkey
+4%
Periodic financial Information I 3M 15 Results I 8 May 2015 38
Life
Inflow +29%, including non-controlling interests @ 100%, reflecting
higher sales in all operating companies
Consolidated Inflow up 50%
Portugal: volumes up 44% pushed by Savings & Pension
business compensating for lower Unit-linked volumes
France: up 65% benefiting from significant sale of UL single
premium through broker network
Technical liabilities end-of-period
Consolidated up 6% vs. year-end to EUR 15 bn
Including non-consolidated JVs @ 100%: EUR 33bn, up 3% vs FY
2014
Non-Life
Inflow consolidated entities up 3%
Turkey (Aksigorta) at EUR 164 mio, down 4% @ constant FX as
result of strategic shift towards more profitable growth business
(reduction in Motor Third Party Liability)
A&H & Motor remain the major business lines in the portfolio.
Unit-Linked
Guaranteed
Other
Household
Accident & Health
Motor
40. Periodic financial Information I 3M 15 Results I 8 May 2015 39
Continental Europe: Combined ratio
Excellent combined ratio well below group target
Net earned premium in EUR mio
* Scope: only consolidated companies: 2009 Portugal; as from 2010 Portugal & Italy
Combined ratio
Combined significantly lower due to benign
weather conditions compared to 3M 14
Combined ratio Turkey at 106.8% (vs. 90.8%)
increased due to bad weather & poor MTPL
results
Claims ratio
CY ratio at 64.8% (vs 66.1%) decrease driven
by Household in Portugal
PY ratio driven by release provision for old
claims in Portugal & positive run-off in Italy
Expense ratio
Expense ratio continued focus on cost
containment, commission ratio remained stable
62.4%
71.0% 66.4% 63.6% 63.7% 61.3% 65.2%
60.0%
27.6%
30.3%
30.3%
29.8% 30.0% 30.8%
29.6%
28.1%
90.0%
101.3%
96.7%
93.4% 93.7% 92.1% 94.8%
88.1%
(1.3%)
1.9%
(2.0%) (2.5%) (4.0%) (4.3%)
(0.9%)
(4.8%)
2009 2010 2011 2012 2013 2014 3M 14 3M 15
claims ratio expense ratio PY claims ratio
194 369 382 397 403 415 101 108
42. Continental Europe Life operating margin per product line
Guaranteed: operating margin in line with
Last Year
Unit-linked: decreasing expense & other margin
Avg techn liabilities Avg techn liabilities
Periodic financial Information I 3M 15 Results I 8 May 2015 41
Decreased expense & other margin related to less fees
following lower UL sales
Investment margin slightly below last year
Underwriting margin YTD : in line with last year
Expenses & other margin: stable on last year
8.7 8.3 7.8 7.6 7.7 7.6 8.0In EUR bn
Expense &
Other
Investment
Underwriting
Expense &
Other
Investment
1.25%
1.00% 1.18% 1.06% 0.95% 0.97% 0.99%
0.84%
(0.75%)
0.69%
0.68% 0.77% 0.76% 0.74%
(0.93%)
(1.08%)
(0.85%) (0.83%) (1.02%)
(0.68%) (0.68%)
1.16%
1.02% 0.91% 0.70% 1.05% 1.05%
2010 2011 2012 2013 2014 3M 14 3M 15
Underwriting
13.9 6.4 6.1 6.3 6.2 6.4 6.3
0.01% 0.02%
0.02%
0.01%
0.01%
0.01% 0.02%0.01% 0.01%
(0.05%)
(0.01%)
0.01%
0.18%
0.55%
0.41%
0.51%
0.09%
0.24%
(0.01%)
0.20%
0.56%
0.44%
0.47%
0.10%
0.24%
0.02%
2010 2011 2012 2013 2014 3M 14 3M 15
43. Net result: Better performance in
most countries & positive FX
In EUR mio In EUR bn
Non-Life combined ratio increased
but still excellent
Inflow* growth fuelled by China &
Thailand
Life Technical liabilities up across
all entities
In EUR bn
Asia: Headlines
Strong Life result driven by new business & renewals
Periodic financial Information I 3M 15 Results I 8 May 2015 42
In % avg technical liabilities In EUR mio
Life operating margin Hong Kong:
strong improvement in UL
Result non-conso partnerships:
strong result in China & Thailand
In % NEP
* incl. non-consolidated partnerships @ 100%
35
55
4
3
39
58
3M 14 3M 15
Life Non-Life
4.1
6.1
0.2
0.3
4.4
6.4
3M 14 3M15
Life Non-Life
89.7%
92.1%
3M 14 3M 15
1.50%
2.55%
3M 14 3M 15
2.8 3.3
34.9 41.5
37.7
44.8
FY 14 3M 15
Conso Non-conso
32
44
4
3
36
47
3M 14 3M15
Life Non-Life
44. 4,048
6,05076
82
4,124
6,132
3M 14 3M 15
+49%
+24%
Household
Motor
Guaranteed
Life
Non-Life
In EUR mio
In EUR mio
Unit-Linked
Asia: Inflow @ 100%
Strong growth new business, boosted by successful sales campaigns
Accident & Health
Other
Periodic financial Information I 3M 15 Results I 8 May 2015 43
Life
New business premiums up 47% with EUR 2.8 bn single premium
(+34%) & EUR 1.1 bn regular premium (+92%).
Renewal premiums increased to EUR 2.2 bn (+52%) benefiting from
prior year strong sales & continued good persistency
Hong Kong, +15%, New business down 19% - market impacted by new
regulations mainly in Broker channel
China, +51%, New business premium up 50% with very successful sales
campaigns & increased number of agents
Malaysia, +15%, big impact of positive FX - New business premium
Banca up 24%; strong campaign with focus on retirement products
Thailand, +45%, New business premiums up 34%; strong performance in
regular premium in both Banca & Agency channels.
India, +94%, Good performance in Banca with strong focus on group
retirement product & single premium UL
Technical liabilities – end-of-period
Hong Kong : EUR 3.3bn, up 18% vs FY 2014
Including non-consolidated JVs @ 100%: EUR 45bn, up 19% vs FY 14
Non-Life
Malaysia, +21%, Mainly driven by Motor & MAT
Thailand, +32%, All product lines growing; especially Motor & Personal
Accident
85
106
27
32
18 23
105
131
235
291
3M 14 3M 15
45. Hong Kong Life operating margin per product line
Organic growth & change in product mix supporting expense margins
Guaranteed: improving expense margin Unit-linked: lower new business strain
Periodic financial Information I 3M 15 Results I 8 May 2015 44
Avg techn liabilities Avg techn liabilities
Underwriting result higher due to organic growth @
comparable margin
Expense & Other margin improved significantly following
shift towards products with lower new business strain
Underwriting margin deteriorated due to less
favourable claims experience (net of reinsurance)
Investment margin deteriorated due to lower
realised capital gains
Expense & Other margin improved due to organic
growth
In EUR bn
Expense &
Other
Investment
Underwriting
Expense &
Other
Underwriting
(0.15%)
(0.71%)
(0.15%)
(0.32%) (0.47%)
1.47%
(0.45%)
3.62%
(0.57%)
(0.11%)
0.27% 0.11%
0.15%
(0.11%)
1.30%
3.52%
2.52%
4.19%
3.13%
1.08%
3.28%
4.77%
2.24%
2.26%
4.14%
2.77%
2.70%
2.72%
2010 2011 2012 2013 2014 3M 14 3M 15
Investment
1.0 1.1 1.3 1.3 1.4 1.3 1.8 0.3 0.4 0.5 0.6 0.7 0.7 1.0
3.11%
1.75% 2.13% 2.15% 2.07% 2.26% 2.13%
0.20% 0.16%
(2.40%)
(3.21%)
(0.95%)
(5.01%)
(2.06%)
(3.14%)
(0.04%)
0.70%
(1.47%)
1.18%(2.86%)0.21% (0.88%) 2.25%
2010 2011 2012 2013 2014 3M 14 3M 15
47. Periodic financial Information I 3M 15 Results I 8 May 2015 46
In EUR bn
* All assets at fair value except the ‘Held to Maturity’ assets; loans & real estate which are valued at amortized costs
Asset mix
Asset allocation remained stable
Increased market value bonds because of lower interest
rates & spreads – cash only temporarily up
Gross unrealized gains/losses on Available for Sale
Total portfolio: up to EUR 11.3bn (EUR 9.0 bn FY 14); up in
fixed income & equities
Fixed income: at EUR 10.4 bn (EUR 8.5 bn FY 14)
Sovereigns at EUR 7.7 bn (vs. EUR 6.1 bn)
Corporates at EUR 2.7 bn (vs. EUR 2.4 bn)
Equities: up to EUR 0.8 bn (vs. EUR 0.5 bn)
Gross UG/L on Real Estate: stable at EUR 1.4 bn - not
reflected in shareholders’ equity
EUR 2.9 bn unrealized gains/losses on Held to Maturity
(EUR 2.2 bn FY 14) - not reflected in shareholders’ equity
Sovereign
bonds 37.5
Sovereign
bonds 39.0
Corporate
bonds 26.5
Corporate
bonds 27.2
Structured
0.3
Structured
0.3
Loans 6.1
Loans 6.8
Equities 3.8
Equities 4.2Real Estate 5.0
Real Estate 5.0Cash 2.5
Cash 2.881.8
85.3
Treasury bills
0.1
Treasury bills
0.0
FY 14 3M 15
Investment portfolio
Investment portfolio up on unrealized gains on fixed income & equities
48. Increase portfolio fully driven by lower rates & spreads
Gross UG/L at EUR 7.7 bn (vs. EUR 6.1 bn)
95% investment grade; 89% rated A or higher
Maturity sovereign bond portfolio unchanged & close to
maturity liabilities – duration gap close to zero – limited
interest rate sensitivity
Belgium
19.2
Belgium
19.6
France 6.2 France 6.5
4.2 4.5
Austria 2.8
Austria 3.01.3
1.40.6
0.7Others 3.3
Others 3.4
37.5
39.0
FY 14 3M 15
In EUR bn
Sovereign bond portfolio*
Sovereign & Corporate bond portfolio
Value fixed income portfolio impacted by evolution unrealized gains
Periodic financial Information I 3M 15 Results I 8 May 2015 47
Gross UG/L at EUR 2.7 bn (vs. EUR 2.4 bn)
Priority to investment grade industrials has led to a
slight increase within corporate bond portfolio to 49%
(vs. 48% FY 14)
Credit quality remains very good with 95% investment
grade; 68% rated A or higher
Corporate bond portfolio*
Banking 5.1 Banking 5.1
Other
financials 1.6
Other
financials 1.7
Non
Financials
12.8
Non
Financials
13.3
Government
related 6.9
Government
related 7.1
26.5 27.2
FY 14 3M 15
* All assets at fair value except the ‘Held to Maturity’ assets; loans & real estate which are valued at amortized costs
The Netherlands The Netherlands
Germany
Germany
Southern EuropeSouthern Europe
In EUR bn
49. Loan portfolio (customers + banks)*
Loan & Equity portfolio
More loans with guarantee
Loans to
banks 1.1
Loans to
banks 1.5
RE 0.2
RE 0.3
Infrastructure
0.2
Infrastructure
0.1
Mortgages 1.5
Mortgages 1.4
Other 3.1
Other 3.5
6.1
6.8
FY 14 3M 15
Increase in other: long term lending to social housing
agencies in Belgium, benefiting from explicit guarantee by
the region
Loans to banks up – mainly short term bank deposits
Periodic financial Information I 3M 15 Results I 8 May 2015 48
Equity portfolio*
Gross UG/L up to EUR 0.8 bn
Increase in equity portfolio supported by
investments & equity markets
Equities 2.2
Equities 2.5
Equity funds
0.2
Equity funds
0.3
RE funds 0.6
RE funds 0.6
Mixed funds
& others 0.8
Mixed funds
& others 0.8
3.8
4.2
FY 14 3M 15
* All assets at fair value except the ‘Held to Maturity’ assets; loans & real estate which are valued at amortized costs
In EUR bn In EUR bn
50. Periodic financial Information I 3M 15 Results I 8 May 2015 49
Real estate portfolio
10/03/2010
Gross UG/L stable at EUR 1.4 bn (not reflected in
shareholders’ equity but contributing to available
capital for solvency calculation)
Real Estate exposure mainly in Belgium
Investment
Offices 1.8
Investment
Offices 1.8
Car Parks
1.1
Car Parks
1.1
Investment
Retail 1.3
Investment
Retail 1.3
0.3 0.3
0.4 0.4
5.0 5.0
FY 14 3M 15
Real Estate portfolio*
* All assets at fair value except the ‘Held to Maturity’ assets, loans & real estate which are valued at amortized costs
Investment Warehouses
RE Development
Investment
Warehouses
RE Development
In EUR bn
52. FY 14 3M 15
Net result driven by revaluation
RPN(i) & RPI
In EUR mio
Accounting value of remaining
legacies:
General Account: Headlines
Impacted by revaluation RPN(i) liability & RPI
Periodic financial Information I 3M 15 Results I 8 May 2015 51
Net cash position stable
In EUR mio
RPN(i) impact on P&L Staff & Operating expenses
In EUR mio
In EUR mio
In EUR mio
(115)
44
3M 14 3M 15
In EUR mio
Accounting value put option on
AG Insurance
5 5
5
8
10
13
3M 14 3M 15
Staff Operating
(1,391) (1,218)(467) (431)
38 48
(130)
(130)
FY 14 3M 15
RPN(i) RPI FortisEffect
1.6 1.6
FY 14 3M 15
(104)
36
3M 14 3M 15
53. 1,637 1,577
(51) (24) (46)3 58
FY 14 share
buy-back
investment
in liquid
assets
upstream capital
restructuring
other 3M 15
Periodic financial Information I 3M 15 Results I 8 May 2015 52
Net cash position General Account
Net cash position roughly stable
In EUR bn
Around EUR 300 mio of liquid assets with original maturity longer than 1 year are not included in net cash
position
Share buy-back – another EUR 23 mio spend as per 30/04/2015
Capital restructuring relates to repayment internal loans
54. Periodic financial Information I 3M 15 Results I 8 May 2015 53
Status on various legal procedures
Administrative & criminal proceedings*
AFM I : final - fine imposed
FSMA: appeal filed before Court of Appeal
20082007
May/June 08
Communication re solvency & EC
remedies
September -
October 08
Rescue operations & Split
up of Fortis Group,
spread over 2 WE’s
August 07
Communication Q2 figures
AFM II : final - acquittal
September 07
Capital increase, Prospectus,
Communication about subprime
exposure
May 07
Press release re bid on ABN AMRO
January 08
Press release on subprime & solvency
Criminal Investigation: referral to court asked for 7 individuals - additional investigation ongoing
Administrative proceedings
Criminal proceedings
* For a complete overview of all legal procedures, please check the contingent liabilities in the Annual Report
55. Periodic financial Information I 3M 15 Results I 8 May 2015 54
Status on various legal procedures
Civil proceeding initiated by (associations of) shareholders
20082007
September - October 08
Split up of Fortis Group,
spread over 2 WE’s
May – September 07
Press release re bid on ABN AMRO
Communication Q2 figures
Capital increase, Prospectus, Subprime
January – June 08
Press release on subprime & solvency
Communication re solvency & EC
remedies
BE - 1 professional investor re damages
following rights issue; exchange of written
arguments
Enterprise Court (Ondernemingskamer) re certain facts relating to 2007-2008, Final judgement 06/12/13 mainly in favour plaintiffs
Stichting Investor Claims Against Fortis (SICAF) against Ageas ML & BNPPF; 2° proceeding also against board members &
executives, awaiting ruling preliminary procedural questions
Deminor against ageas & 2 banks; interim judgment 28/4/14 ruling +/- 25% claimants not eligible; exchange of written arguments
ongoing
BE – 2 claimants against ageas: awaiting decision consolidation with Deminor
Mr Lenssens representing several claimants against ageas, 1 bank, Belgian state & several executives, suspended pending
criminal proceedings
Stichting FortisEffect against ageas &
Dutch state; Judgement partly in favour of
plaintiffs, Supreme appeal filed
NL - 1 shareholder claiming damages
referring to FortisEffect judgment
Mr.Modrikamen against ageas, Belgian
state & 2 banks; Interim judgement
05/11/14 ruling +/- 50% claimants not
eligible
Mr. Arnauts representing several claimants against
ageas & 2 banks; suspended pending criminal
proceedings
VEB collective action against ageas, former directors / executives & banks; exchange of written arguments
Mr. Bos representing 7 shareholders against ageas, board members & executive; 1° instance mainly in favour of claimants,
appeal filed
2 separate proceedings - Mr Meijer representing in each case 1 claimant against ageas, awaiting decision consolidation
SICAF
56. Periodic financial Information I 3M 15 Results I 8 May 2015 55
Best estimate of timings as of to date
Impossible to provide accurate timing for next steps
Early 2015 Mid 2015 End 2015 2016
First instance
Pleadings
VEB
BE – 1 professional
investor
Mr.Modrikamen
Deminor
Judgment on the merits
VEB
BE – 1 professional investor
NL 2 separate proceedings
– Mr Meijer
NL – 1 shareholder
Mr.Modrikamen
Appeal
Pleadings FSMA
Judgment preliminary
matters
Judgment on the merits FSMA fine Mr. Bos
Supreme Court
Pleadings FortisEffect
Judgment
Modrikamen – on
court’s competence
57. Periodic financial Information I 3M 15 Results I 8 May 2015 56
Main characteristics Hybrids
Leverage optimized at holding level & at AG Insurance
In EUR mio Ageas
Ageasfinlux
Fresh
Ageas Hybrid
Financing
Hybrone
Fixed-to-
Floating Rate
Callable
Fixed Rate
Reset Perpetual
Subordinated
Loans
Fixed Rate
Reset Dated
Subordinated
Notes
CASHES
% 3m EUR
+ 135 bps 5.125% 5.25% 6.75% 3.5% 3m EUR
+200 bps
Amount
outstanding 1,250 336 450 550 USD 400 1,110
ISIN XS0147484074 XS0257650019 BE6261254013 BE6251340780 BE6277215545 BE0933899800
Call date
Undated,
strike 315.0
mandatory 472.5
Jun 16
Step up to 3M
Euribor +200 bps
Jun 24
Step up to 3M
Euribor +413 bps
Mar 19
Step up to 6yr
USD swap + 533
bps
June 2027
Step up after 12
years of 100bps
Undated,
strike 239.4,
mandatory 359.1
Other
On lent to AG
Insurance
Subscribed by
Ageas & BNP
Paribas Fortis
Public issue Public issue
Coupon served by
FBB, trigger
ACSM linked to
Ageas dividend
Market Price
(31/03/15)
56.00 101.25 100.00 107.25 99.41 76.04
Fortis Bank
(now BNP PF)
AG Insurance
(Belgium)
95
58. Periodic financial Information I 3M 15 Results I 8 May 2015 57
Changes in hybrid debt composition
Tender on Hybrone & succesful debt placement by AG Insurance
Hybrone
Perpetual Securities - EUR 500 mio @ 5.125% - issued in 2006
Supported & guaranteed on subordinated basis by Ageas
On-loan to AG Insurance
Tender March 2013 EUR 336 mio remained outstanding
Tender March 2015
EUR 241 mio Hybrone Securities tendered @ 103%
EUR 95 mio outstanding
Subordinated securities with 32 years maturity, callable after 12
EUR 400 mio @ 3.5%
Solvency II compliant – Tier 2 capital
Part of proceeds used to redeem Hybrone on-loan
P&L impact ≈ EUR 4 mio negative
Lower financing costs
Solvency II compliant
Tender by
Ageas Hybrid
Financing
Debt issue by
AG Insurance
Rationale
60. Cancellation bought back
shares + new buy back
Periodic financial Information I 3M 15 Results I 8 May 2015 59
Total number of outstanding shares
AGM has approved cancellation of another 7.2 mio shares
situation 31/12/2014 situation 30/04/2015
Total Issued Shares 230,996,192 223,778,433
Shares not entitled to dividend & voting rights 16,229,514 11,556,224
1. TREASURYSHARES Share buy-back 7,217,759 2,544,469
FRESH 3,968,254 3,968,254
Other treasury shares 399,597 399,597
2. CASHES 4,643,904 4,643,904
Shares entitled to dividend & voting rights 214,766,678 212,222,209
Cancellation 7.2 mio
bought back shares / 3%
of outstanding
61. Periodic financial Information I 3M 15 Results I 8 May 2015 60
Shareholders structure
Based on number of shares as at 30 April 2015
Ageas
3.11%
Ping An
BlackRock, Inc.
Schroders
Franklin Mutual
Advisers
Identified retail
investors
19%
Identified
institutional
investors
38%
Other investors
21%
Based upon press release 4 May 2015
Based upon the number of shares mentioned in the notification received 6 May 2013
Based upon the number of shares mentioned in the notification received 17 March 2014
Based upon the number of shares mentioned in the notification received 16 January 2015
Based upon the number of shares mentioned in the notification received 2 June 2014
Estimate by
Estimate by
Ageas
Ping An
BlackRock, Inc.
Schroders
Franklin Mutual Advisers
Identified retail investors
Identified institutional investors
Other investors
62. Periodic financial Information I 3M 15 Results I 8 May 2015 61
Financial calendar 2015
12 February
Annual results
2014
8 May
3M 2015
results
29 April
Ordinary & Extraordinary
shareholders’meeting - Brussels
6 May
Ex date
6 March
Annual & EV
report 2014
8 May
Payment 2014
dividend
5 August
6M 2015
results
4 November
9M 2015
results
28 September
Investor Day 2015
63. Periodic financial Information I 3M 15 Results I 8 May 2015 62
Rating
Improved rating for operating entities & holding
S&P MOODY'S FITCH
Operating AG Insurance (Belgium) A- / positive A2 / stable* A+ / stable
entities Last change 30/03/15 10/03/15 10/12/13
Ageas Insurance Limited A+ / stable
Last change 30/03/15
Millenniumbcp Ageas Occidental Vida (Portugal) BB / positive
Last change 25/03/15
Millenniumbcp Ageas Occidental (Portugal) BBB / stable
Last change 31/10/14
Millenniumbcp Ageas Médis (Portugal) BBB / stable
Last change 31/10/14
Ageas Insurance Co. (Asia) Baa1 / stable A / stable
Last change 16/01/13 26/03/13
Muang Thai Life BBB+ / stable BBB+ / stable
Last change 29/12/10 16/12/10
Etiqa Insurance Berhad (Malaysia) A / stable
Last change 25/09/11
Holding ageas SA/NV
Long-term BBB- / A-3 Baa3 / P-3 * BBB+ / F2
Outlook positive negative stable
Last change 30/03/15 10/03/15 10/12/14
* Ageas has requested in early 2009 that this rating should be withdrawn. Ageas no longer participates in Moody's credit rating process.
Ageas does not provide, for purposes of Moody's rating, access to the books, records and other relevant internal documents of these rated entities.
64. Periodic financial Information I 3M 15 Results I 8 May 2015 63
Disclaimer
Certain of the statements contained herein are statements of
future expectations and other forward-looking statements that are
based on management's current views and assumptions and
involve known and unknown risks and uncertainties that could
cause actual results, performance or events to differ materially
from those expressed or implied in such statements. Future actual
results, performance or events may differ materially from those in
such statements due to, without limitation, (i) general economic
conditions, including in particular economic conditions in Ageas’s
core markets, (ii) performance of financial markets, (iii) the
frequency and severity of insured loss events, (iv) mortality and
morbidity levels and trends, (v) persistency levels, (vi) interest rate
levels, (vii) currency exchange rates, (viii) increasing levels of
competition, (ix) changes in laws and regulations, including
monetary convergence and the Economic and Monetary Union, (x)
changes in the policies of central banks and/or foreign
governments and (xi) general competitive factors, in each case on
a global, regional and/or national basis. In addition, the financial
information contained in this presentation, including the pro forma
information contained herein, is unaudited and is provided for
illustrative purposes only. It does not purport to be indicative of
what the actual results of operations or financial condition of
Ageas and its subsidiaries would have been had these events
occurred or transactions been consummated on or as of the dates
indicated, nor does it purport to be indicative of the results of
operations or financial condition that may be achieved in the
future.
65. Periodic financial Information I 3M 15 Results I 8 May 2015 64
Investor Relations
Tel:
E-mail:
Website:
+ 32 2 557 57 34
ir@ageas.com
www.ageas.com
Investor Relations