Download to read offline

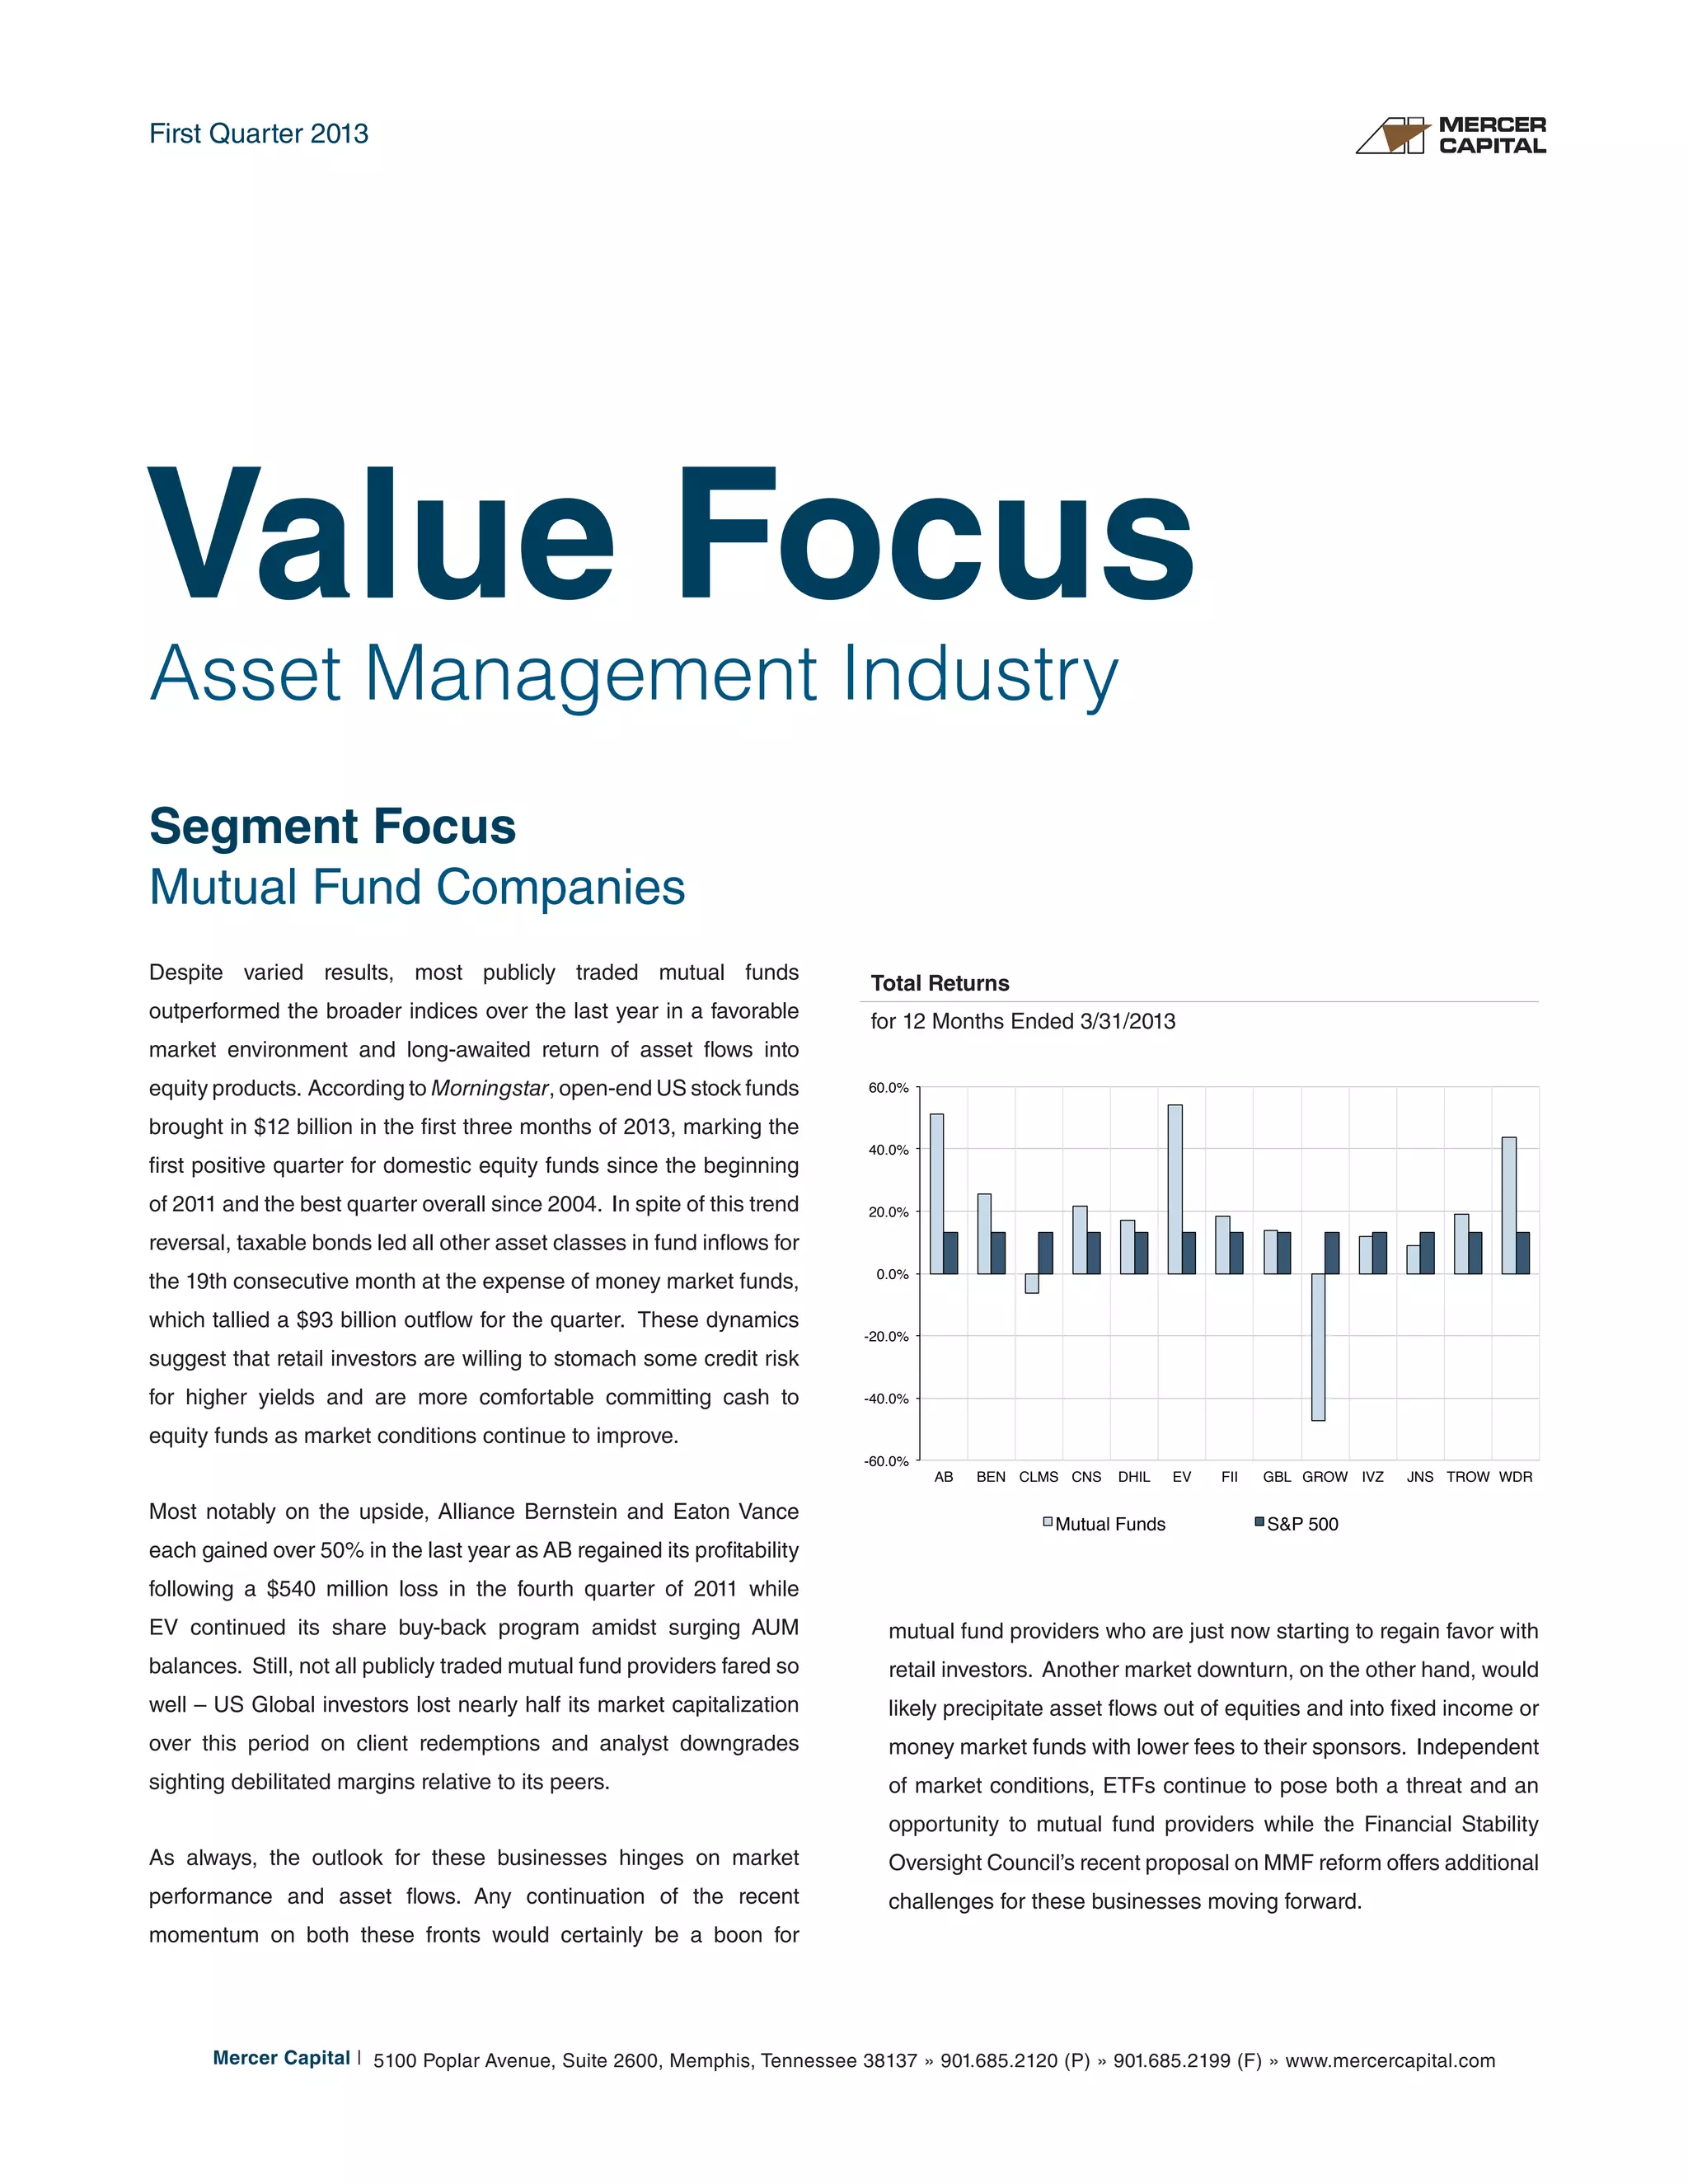

In the first quarter of 2013, most publicly traded mutual funds outperformed broader indices, with a notable resurgence in asset flows into equity products, particularly open-end US stock funds which saw $12 billion in inflows. Taxable bonds remained the top asset class for inflows for the 19th month, while investor behavior indicated a growing appetite for equities despite the past financial crisis. The ongoing market conditions will heavily influence mutual fund performance and capital flows, creating potential benefits for providers if the positive trend continues.


