SlideShare a Scribd company logo
1 of 27
MEDIA USAGE DIARY
     Maddi Duncan
Introduction
In recent decades, forms of media have
skyrocketed, representing both technological and
social change. Over 10 days, I logged the hours I
spent both using and producing media. My
investigation examines which media forms I
utilised and analyses why, and provides a
comparison between the way in which my peers
and myself interact with various types of media.
Usage Log
NEWS
Over 10 days, I spent around 6hrs 25mns viewing the
news. On only two days did I read the newspaper, and
these were the two days I was working, where the
paper is delivered to the desks of all employees. The
vast majority of my news
viewing is via television, and
it was only on days when I
was unable to watch
televised news coverage,
that I would browse
through the headlines
online, in order to remain
up-to-date on current affairs.
NEWS
According to the survey, my classmates shared my
order of preferences for accessing news (television,
then online, then newspaper). I suggest this is
because the news is enhanced with visuals, and
becomes far more captivating and meaningful when
seen, rather than read.
AUDIO
                       Peers Daily Radio Usage

> 4 hrs


3-4 hrs


2-3 hrs


1-2 hrs


  1 hrs


< 1 hrs


  0 hrs


      0.00%   10.00%   20.00%     30.00%     40.00%   50.00%   60.00%
AUDIO
The previous graph represents the number of hours
my peers spent each day listening to the radio. Over
half of them listened to less than one hour each
day, 15% listened to an hour daily, and 16.7%
listened to no radio at all.

On average, I listened to the radio for just over one
hour each day, but, as the next graph
demonstrates, my listening was
unpredictable, ranging from nothing one day to 3
hours the next.
AUDIO
AUDIO
Much of my radio listening
was, however, accidental. For 8 hours over 10 days, I
was subjected to AM radio played by my mother, in
the car and at home. Only when the radio was set to
FM, was it a personal choice. Therefore, I only
deliberately tuned in for 2 hours and 20 minutes
over the period – a mere average of 14 minutes per
day. This places me alongside 53.9% of my
peers, who listen to less than an hour of radio daily.
I believe this percentage who barely listens to radio
is a consequence of technological advancement in
delivering music.
AUDIO
                              How do you listen to music?
Radio (used for music   450

                        400
by 185 people) is       350

clearly losing the      300

battle against          250


computers (used by      200

                        150
320 people) and         100

iPods/iPhones/other     50

Smart Phones (used        0


by 385 people).
AUDIO
Presumably, my peers and my declining dependence on
radio for music is due mostly to the choice offered by
iPods, computers, etc. – that is, we can personally choose
what music to listen to, as opposed to suffering through
songs we may or may not enjoy on the radio. The
portability of iPods and smart phones may contribute to
their success, as they are far easier to carry than a Discman
and CDs, or mp3s on a laptop. There is also the snob factor
– no one wants to whip out a small, battery-operated radio
on the bus, only to be scoffed at by Apple elitists, flicking
through their indie playlists with fancy album artwork.
Whilst live music is increasing in popularity as more bands
include Brisbane in their tours, it is still more financially
feasible to listen to a band’s CD than hear them play live.
BOOKS
I have included books as part of my usage
because, as a self-confessed bookworm, they form
the most significant component of my media usage.


The survey of my classmates did not include
books, but I would estimate the hours I spent
reading over 10 days probably exceeds many, due to
the text-heavy nature of my courses.
BOOKS
17 hours and 10 minutes were spent reading
textbooks, leaving only 3 hours and 50 minutes to
read fiction for pleasure, and 1 hour and 55 minutes
for non-fiction.

While television and movies, at one                  Books
stage, gained popularity over books,     Textbooks    Fiction   Non-Fiction


I believe reading will soon regain its               7%

former glory, as eBooks and                16%


eReaders swarm the market,
targeting the technological age.
                                                                77%
ONLINE
The graph below represents how many minutes per day
I used online media. Though I spent significantly longer
online some days than others, my 10-day internet usage
totalled 16 hours and 10 minutes, averaging around 1
hour and 37 minutes each day.

                                   Personal Daily Internet Usage
                             300
                             250
            No. of minutes


                             200
                             150
                             100
                              50
                               0
ONLINE
According to the survey of my peers (below), I am far
less active online than my classmates, the majority of
whom spend 2-3 hours online per day, followed by 3-4
hours per day. 321 pupils (75%) spent more than 2
hours online each day, with only 111 spending the same
amount of time or less than I did.
                                 Classmates Daily Internet Usage
                           140

                           120

                           100
           No. of People


                           80

                           60

                           40

                           20

                             0
                                 <1 hr   1-2 hrs   2-3 hrs   3-4 hrs   4-5 hrs   5-6 hrs   >6 hrs
ONLINE
Why am I in the minority? Quite simply, I do not do as
much online. My only three uses for internet are
Facebooking, web surfing, and researching, while my
peers engaged in a number of other activities, such as
shopping, reading blogs, and streaming radio and
television.                   Classmates Internet Usage
                                           450
                                           400
  Personal Internet Usage                  350
                                           300
   Facebook   Uni Research   Web Surfing   250
                                           200
                                           150
                                           100
              11%
                       19%                  50
                                             0


              70%
TELEVISION
Excluding news reports, I spent 9 hours and 30
minutes watching television, averaging 57 minutes
per day (table). This places me alongside 116 of my
classmates in the <1 hour category, the second most
common group (after 1-2 hours).
                      Classmates Daily TV Viewing
                140

                120

                100
No. of People


                 80

                 60

                 40

                 20

                  0
                      0    <1   1    1-2    2-3   3-4   >4
                                    Hours
TELEVISION
I expected my peers to watch more television than
they did. When you compare the data for TV
viewing with hours spent online though, it is less
surprising – generally, as hours of internet usage
increased, television viewing decreased. This may be
a result of TV and podcast Daily Internet Usage vs. TV Viewing
streaming online, or
                                    >4
personal preferences to
                                    3-4
game, shop or social        Hours
                                                                         Daily Internet Usage
                                    2-3
network online, over                                                     Daily TV Viewing

                                    1-2
television viewing.
                                    <1


                                          0   50   100       150   200      250
                                                   No. of people
Production Log
ONLINE
My personal online production, shown the pie chart
below, reveals an overwhelming majority of my
media production involves blogging (with 5 hours
and 20 minutes spent engaging in this activity over
the period.) However, this blogging was solely for
this course, and does not represent my usual
personal production. Therefore, Personal Online Production
most of my time was spent                  Email   Blogs    Skype


Skyping (1 hour, 15 minutes) then                     11%
                                             17%
emailing (50 minutes).

                                                     72%
ONLINE
My most frequent
activity, though, was
emailing, as I engaged in it 6
out of 10 days, while I blogged
on only 4 occasions and used
Skype twice.
                                                  Internet Production
                                                  250
This data corresponds to more


                                  No. of People
                                                  200
than half (229) of my                             150
classmates, who answered that                     100
the majority of their online                       50
                                                    0
media production involved
emailing, followed by Skype.
MOBILE
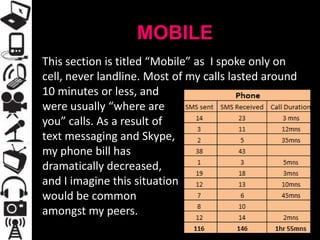
This section is titled “Mobile” as I spoke only on
cell, never landline. Most of my calls lasted around
10 minutes or less, and
were usually “where are
you” calls. As a result of
text messaging and Skype,
my phone bill has
dramatically decreased,
and I imagine this situation
would be common
amongst my peers.
USE vs. PRODUCTION
Over 10 days, I spent 86 hours and 23 minutes
engaging with media. 89% of that time (77hours, 3
minutes) was spent using media (watching the news
and television,                                  Media
listening to the radio, reading and
web-surfing), while only 9 hours                11%


and 20 minutes were spent
 producing media.                Use Production     89%
USE vs. PRODUCTION
What of my classmates? Though the survey did not
provide as extensive information as my media log, I
imagine the majority of my peers would also be
“users”, namely because there are more types of
media production available (eg.
News, television, audio, books, net-use) than media
usage (net-production and mobiles).
USE vs. PRODUCTION
Analysing the available data from the survey, my
overall media use and production seems to be less
than that of my classmates. Whilst I am in the
majority (53.9%) of my peers who listen to less than
1 hour of radio each day, I am in the bottom 25% of
internet users (less than 2 hours online each
day), and the bottom 32% of television viewers
(watching less than 1 hour of TV daily). Though I
assume I read more than my other classmates, my
phone use and internet production are probably
below average.
USE vs. PRODUCTION
Social media – Facebook, Twitter, blogs – is rapidly
growing in popularity, and I predict that the gap
between media production and usage will close over
coming years.

Though media is a valuable tool, there needs to be
balance. I have a discerning use of media; I am not
dependent upon it, and, once coursework is
discounted, it does not form a significant
component of my daily life.
Media Usage Diary

More Related Content

Similar to Media Usage Diary (8)

The Evolving Online Consumer - Brisbane
The Evolving Online Consumer - BrisbaneThe Evolving Online Consumer - Brisbane
The Evolving Online Consumer - Brisbane
 
The Evolving Online Consumer
The Evolving Online ConsumerThe Evolving Online Consumer
The Evolving Online Consumer
 
Unit 1 a
Unit 1 aUnit 1 a
Unit 1 a
 
Global Media Consumption: The Digital Reality
Global Media Consumption: The Digital RealityGlobal Media Consumption: The Digital Reality
Global Media Consumption: The Digital Reality
 
Vincent Everts December presentatie
Vincent Everts December presentatieVincent Everts December presentatie
Vincent Everts December presentatie
 
Life Without Digital
Life Without DigitalLife Without Digital
Life Without Digital
 
Virtual communication (1)
Virtual communication (1)Virtual communication (1)
Virtual communication (1)
 
Technology Assessment #2
Technology Assessment #2Technology Assessment #2
Technology Assessment #2
 

Recently uploaded

在线办理(concordia学位证书)康考迪亚大学毕业证学历学位证书学费发票原版一模一样
在线办理(concordia学位证书)康考迪亚大学毕业证学历学位证书学费发票原版一模一样在线办理(concordia学位证书)康考迪亚大学毕业证学历学位证书学费发票原版一模一样
在线办理(concordia学位证书)康考迪亚大学毕业证学历学位证书学费发票原版一模一样
ahafux
 
一比一原版(UofM毕业证书)明尼苏达大学毕业证如何办理
一比一原版(UofM毕业证书)明尼苏达大学毕业证如何办理一比一原版(UofM毕业证书)明尼苏达大学毕业证如何办理
一比一原版(UofM毕业证书)明尼苏达大学毕业证如何办理
nuovo1
 
一比一原版(UC Berkeley毕业证书)加利福尼亚大学伯克利分校毕业证如何办理
一比一原版(UC Berkeley毕业证书)加利福尼亚大学伯克利分校毕业证如何办理一比一原版(UC Berkeley毕业证书)加利福尼亚大学伯克利分校毕业证如何办理
一比一原版(UC Berkeley毕业证书)加利福尼亚大学伯克利分校毕业证如何办理
nuovo1
 

Recently uploaded (8)

在线办理(concordia学位证书)康考迪亚大学毕业证学历学位证书学费发票原版一模一样
在线办理(concordia学位证书)康考迪亚大学毕业证学历学位证书学费发票原版一模一样在线办理(concordia学位证书)康考迪亚大学毕业证学历学位证书学费发票原版一模一样
在线办理(concordia学位证书)康考迪亚大学毕业证学历学位证书学费发票原版一模一样
 
NO1 Top Amil Baba In Sahiwal, Okara, Hafizabad, Mandi Bahauddin, Jhelum, Jar...
NO1 Top Amil Baba In Sahiwal, Okara, Hafizabad,  Mandi Bahauddin, Jhelum, Jar...NO1 Top Amil Baba In Sahiwal, Okara, Hafizabad,  Mandi Bahauddin, Jhelum, Jar...
NO1 Top Amil Baba In Sahiwal, Okara, Hafizabad, Mandi Bahauddin, Jhelum, Jar...
 
WHO KILLED ALASKA? #18: Mirror Memoria - "TATTOO" TRANSCRIPT.pdf
WHO KILLED ALASKA? #18: Mirror Memoria - "TATTOO" TRANSCRIPT.pdfWHO KILLED ALASKA? #18: Mirror Memoria - "TATTOO" TRANSCRIPT.pdf
WHO KILLED ALASKA? #18: Mirror Memoria - "TATTOO" TRANSCRIPT.pdf
 
C&C Artists' Websites .
C&C Artists' Websites                       .C&C Artists' Websites                       .
C&C Artists' Websites .
 
一比一原版(UofM毕业证书)明尼苏达大学毕业证如何办理
一比一原版(UofM毕业证书)明尼苏达大学毕业证如何办理一比一原版(UofM毕业证书)明尼苏达大学毕业证如何办理
一比一原版(UofM毕业证书)明尼苏达大学毕业证如何办理
 
VIP/Call/Girls Nandi Hills 6378878445 Hours Service Available Day and Night
VIP/Call/Girls Nandi Hills 6378878445 Hours Service Available Day and NightVIP/Call/Girls Nandi Hills 6378878445 Hours Service Available Day and Night
VIP/Call/Girls Nandi Hills 6378878445 Hours Service Available Day and Night
 
一比一原版(UC Berkeley毕业证书)加利福尼亚大学伯克利分校毕业证如何办理
一比一原版(UC Berkeley毕业证书)加利福尼亚大学伯克利分校毕业证如何办理一比一原版(UC Berkeley毕业证书)加利福尼亚大学伯克利分校毕业证如何办理
一比一原版(UC Berkeley毕业证书)加利福尼亚大学伯克利分校毕业证如何办理
 
Codes and conventions of film magazines.pptx
Codes and conventions of film magazines.pptxCodes and conventions of film magazines.pptx
Codes and conventions of film magazines.pptx
 

Media Usage Diary

  • 1. MEDIA USAGE DIARY Maddi Duncan
  • 2. Introduction In recent decades, forms of media have skyrocketed, representing both technological and social change. Over 10 days, I logged the hours I spent both using and producing media. My investigation examines which media forms I utilised and analyses why, and provides a comparison between the way in which my peers and myself interact with various types of media.
  • 4. NEWS Over 10 days, I spent around 6hrs 25mns viewing the news. On only two days did I read the newspaper, and these were the two days I was working, where the paper is delivered to the desks of all employees. The vast majority of my news viewing is via television, and it was only on days when I was unable to watch televised news coverage, that I would browse through the headlines online, in order to remain up-to-date on current affairs.
  • 5. NEWS According to the survey, my classmates shared my order of preferences for accessing news (television, then online, then newspaper). I suggest this is because the news is enhanced with visuals, and becomes far more captivating and meaningful when seen, rather than read.
  • 6. AUDIO Peers Daily Radio Usage > 4 hrs 3-4 hrs 2-3 hrs 1-2 hrs 1 hrs < 1 hrs 0 hrs 0.00% 10.00% 20.00% 30.00% 40.00% 50.00% 60.00%
  • 7. AUDIO The previous graph represents the number of hours my peers spent each day listening to the radio. Over half of them listened to less than one hour each day, 15% listened to an hour daily, and 16.7% listened to no radio at all. On average, I listened to the radio for just over one hour each day, but, as the next graph demonstrates, my listening was unpredictable, ranging from nothing one day to 3 hours the next.
  • 9. AUDIO Much of my radio listening was, however, accidental. For 8 hours over 10 days, I was subjected to AM radio played by my mother, in the car and at home. Only when the radio was set to FM, was it a personal choice. Therefore, I only deliberately tuned in for 2 hours and 20 minutes over the period – a mere average of 14 minutes per day. This places me alongside 53.9% of my peers, who listen to less than an hour of radio daily. I believe this percentage who barely listens to radio is a consequence of technological advancement in delivering music.
  • 10. AUDIO How do you listen to music? Radio (used for music 450 400 by 185 people) is 350 clearly losing the 300 battle against 250 computers (used by 200 150 320 people) and 100 iPods/iPhones/other 50 Smart Phones (used 0 by 385 people).
  • 11. AUDIO Presumably, my peers and my declining dependence on radio for music is due mostly to the choice offered by iPods, computers, etc. – that is, we can personally choose what music to listen to, as opposed to suffering through songs we may or may not enjoy on the radio. The portability of iPods and smart phones may contribute to their success, as they are far easier to carry than a Discman and CDs, or mp3s on a laptop. There is also the snob factor – no one wants to whip out a small, battery-operated radio on the bus, only to be scoffed at by Apple elitists, flicking through their indie playlists with fancy album artwork. Whilst live music is increasing in popularity as more bands include Brisbane in their tours, it is still more financially feasible to listen to a band’s CD than hear them play live.
  • 12. BOOKS I have included books as part of my usage because, as a self-confessed bookworm, they form the most significant component of my media usage. The survey of my classmates did not include books, but I would estimate the hours I spent reading over 10 days probably exceeds many, due to the text-heavy nature of my courses.
  • 13. BOOKS 17 hours and 10 minutes were spent reading textbooks, leaving only 3 hours and 50 minutes to read fiction for pleasure, and 1 hour and 55 minutes for non-fiction. While television and movies, at one Books stage, gained popularity over books, Textbooks Fiction Non-Fiction I believe reading will soon regain its 7% former glory, as eBooks and 16% eReaders swarm the market, targeting the technological age. 77%
  • 14. ONLINE The graph below represents how many minutes per day I used online media. Though I spent significantly longer online some days than others, my 10-day internet usage totalled 16 hours and 10 minutes, averaging around 1 hour and 37 minutes each day. Personal Daily Internet Usage 300 250 No. of minutes 200 150 100 50 0
  • 15. ONLINE According to the survey of my peers (below), I am far less active online than my classmates, the majority of whom spend 2-3 hours online per day, followed by 3-4 hours per day. 321 pupils (75%) spent more than 2 hours online each day, with only 111 spending the same amount of time or less than I did. Classmates Daily Internet Usage 140 120 100 No. of People 80 60 40 20 0 <1 hr 1-2 hrs 2-3 hrs 3-4 hrs 4-5 hrs 5-6 hrs >6 hrs
  • 16. ONLINE Why am I in the minority? Quite simply, I do not do as much online. My only three uses for internet are Facebooking, web surfing, and researching, while my peers engaged in a number of other activities, such as shopping, reading blogs, and streaming radio and television. Classmates Internet Usage 450 400 Personal Internet Usage 350 300 Facebook Uni Research Web Surfing 250 200 150 100 11% 19% 50 0 70%
  • 17. TELEVISION Excluding news reports, I spent 9 hours and 30 minutes watching television, averaging 57 minutes per day (table). This places me alongside 116 of my classmates in the <1 hour category, the second most common group (after 1-2 hours). Classmates Daily TV Viewing 140 120 100 No. of People 80 60 40 20 0 0 <1 1 1-2 2-3 3-4 >4 Hours
  • 18. TELEVISION I expected my peers to watch more television than they did. When you compare the data for TV viewing with hours spent online though, it is less surprising – generally, as hours of internet usage increased, television viewing decreased. This may be a result of TV and podcast Daily Internet Usage vs. TV Viewing streaming online, or >4 personal preferences to 3-4 game, shop or social Hours Daily Internet Usage 2-3 network online, over Daily TV Viewing 1-2 television viewing. <1 0 50 100 150 200 250 No. of people
  • 20. ONLINE My personal online production, shown the pie chart below, reveals an overwhelming majority of my media production involves blogging (with 5 hours and 20 minutes spent engaging in this activity over the period.) However, this blogging was solely for this course, and does not represent my usual personal production. Therefore, Personal Online Production most of my time was spent Email Blogs Skype Skyping (1 hour, 15 minutes) then 11% 17% emailing (50 minutes). 72%
  • 21. ONLINE My most frequent activity, though, was emailing, as I engaged in it 6 out of 10 days, while I blogged on only 4 occasions and used Skype twice. Internet Production 250 This data corresponds to more No. of People 200 than half (229) of my 150 classmates, who answered that 100 the majority of their online 50 0 media production involved emailing, followed by Skype.
  • 22. MOBILE This section is titled “Mobile” as I spoke only on cell, never landline. Most of my calls lasted around 10 minutes or less, and were usually “where are you” calls. As a result of text messaging and Skype, my phone bill has dramatically decreased, and I imagine this situation would be common amongst my peers.
  • 23. USE vs. PRODUCTION Over 10 days, I spent 86 hours and 23 minutes engaging with media. 89% of that time (77hours, 3 minutes) was spent using media (watching the news and television, Media listening to the radio, reading and web-surfing), while only 9 hours 11% and 20 minutes were spent producing media. Use Production 89%
  • 24. USE vs. PRODUCTION What of my classmates? Though the survey did not provide as extensive information as my media log, I imagine the majority of my peers would also be “users”, namely because there are more types of media production available (eg. News, television, audio, books, net-use) than media usage (net-production and mobiles).
  • 25. USE vs. PRODUCTION Analysing the available data from the survey, my overall media use and production seems to be less than that of my classmates. Whilst I am in the majority (53.9%) of my peers who listen to less than 1 hour of radio each day, I am in the bottom 25% of internet users (less than 2 hours online each day), and the bottom 32% of television viewers (watching less than 1 hour of TV daily). Though I assume I read more than my other classmates, my phone use and internet production are probably below average.
  • 26. USE vs. PRODUCTION Social media – Facebook, Twitter, blogs – is rapidly growing in popularity, and I predict that the gap between media production and usage will close over coming years. Though media is a valuable tool, there needs to be balance. I have a discerning use of media; I am not dependent upon it, and, once coursework is discounted, it does not form a significant component of my daily life.