Download as PDF, PPTX
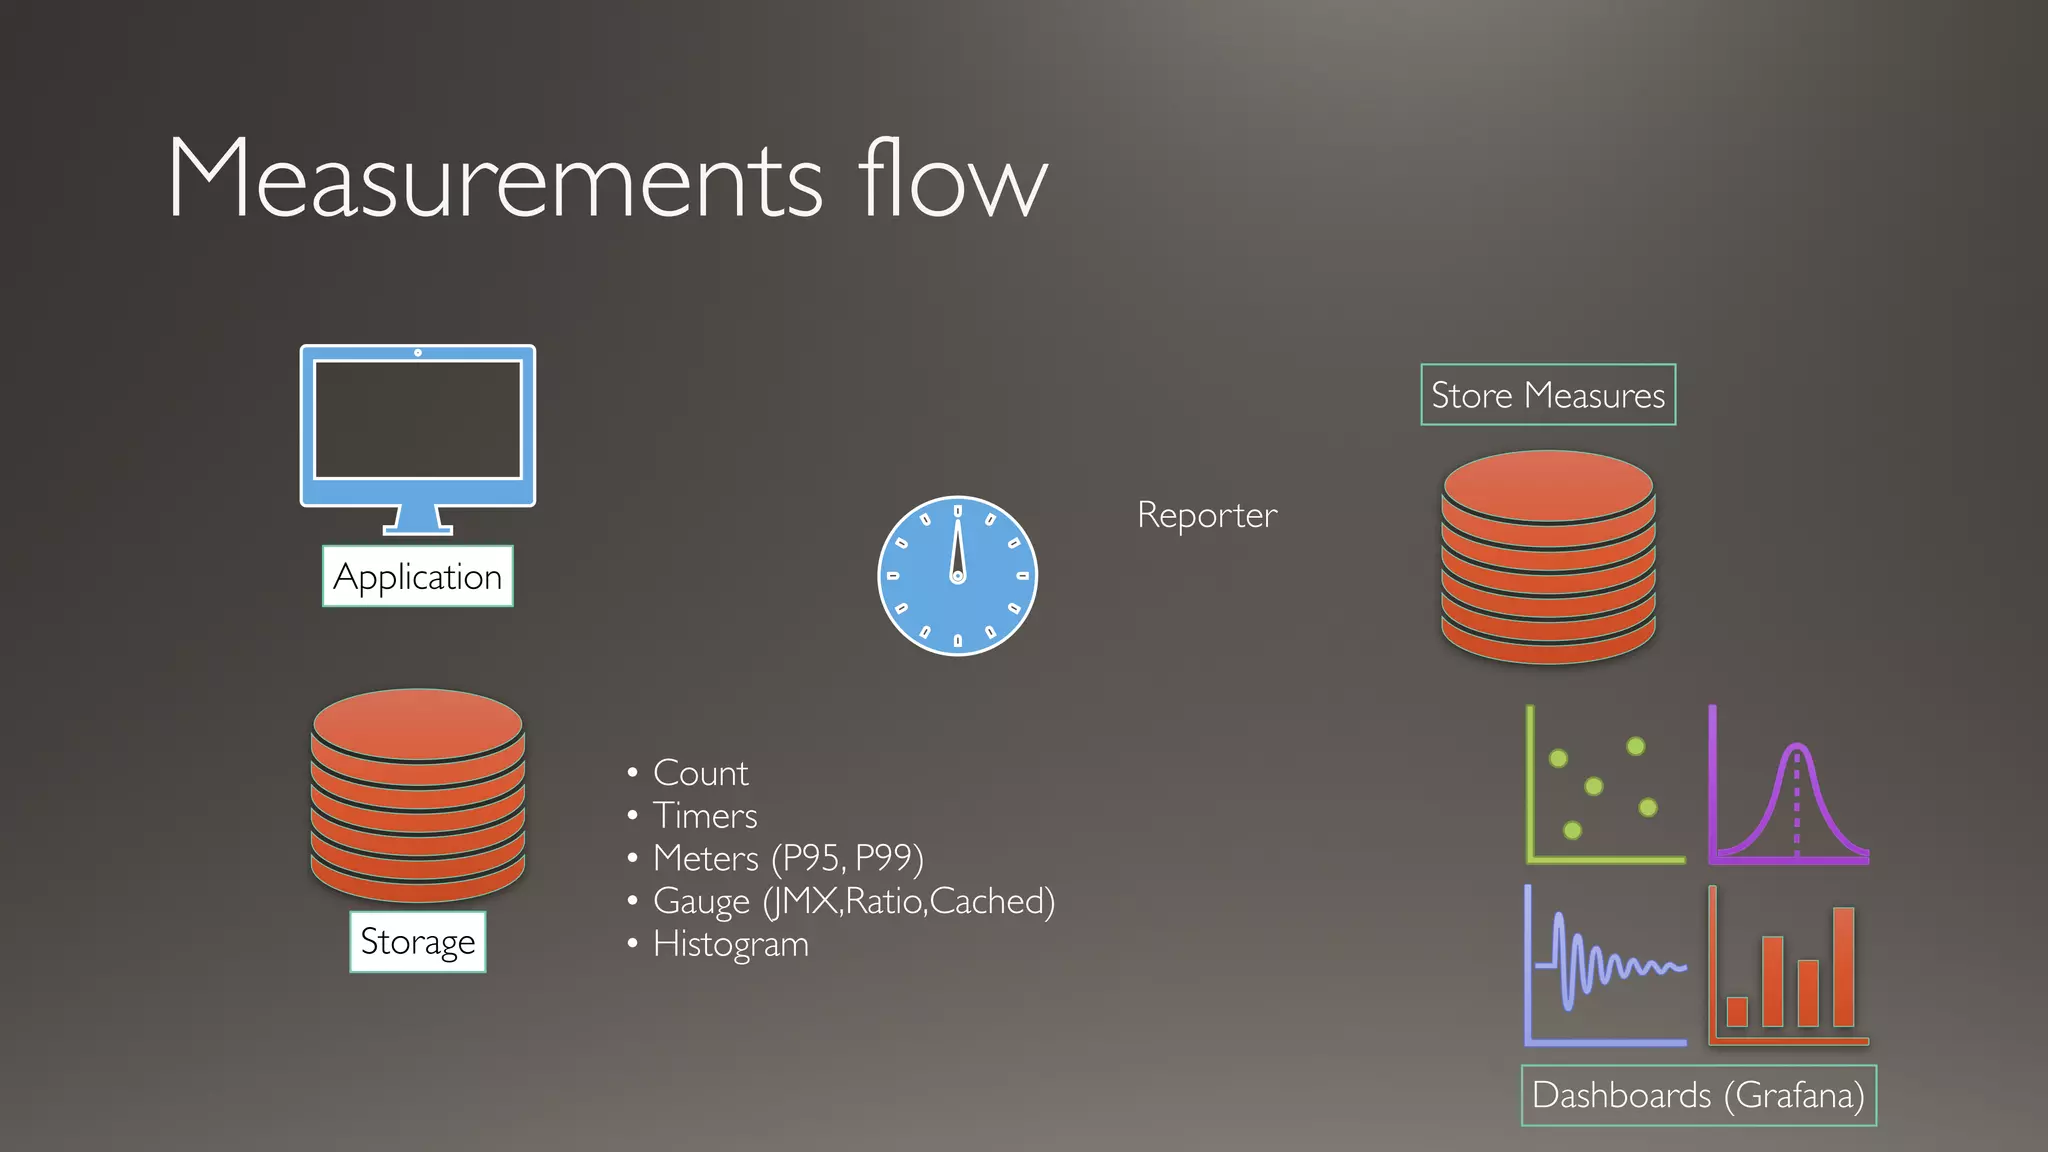
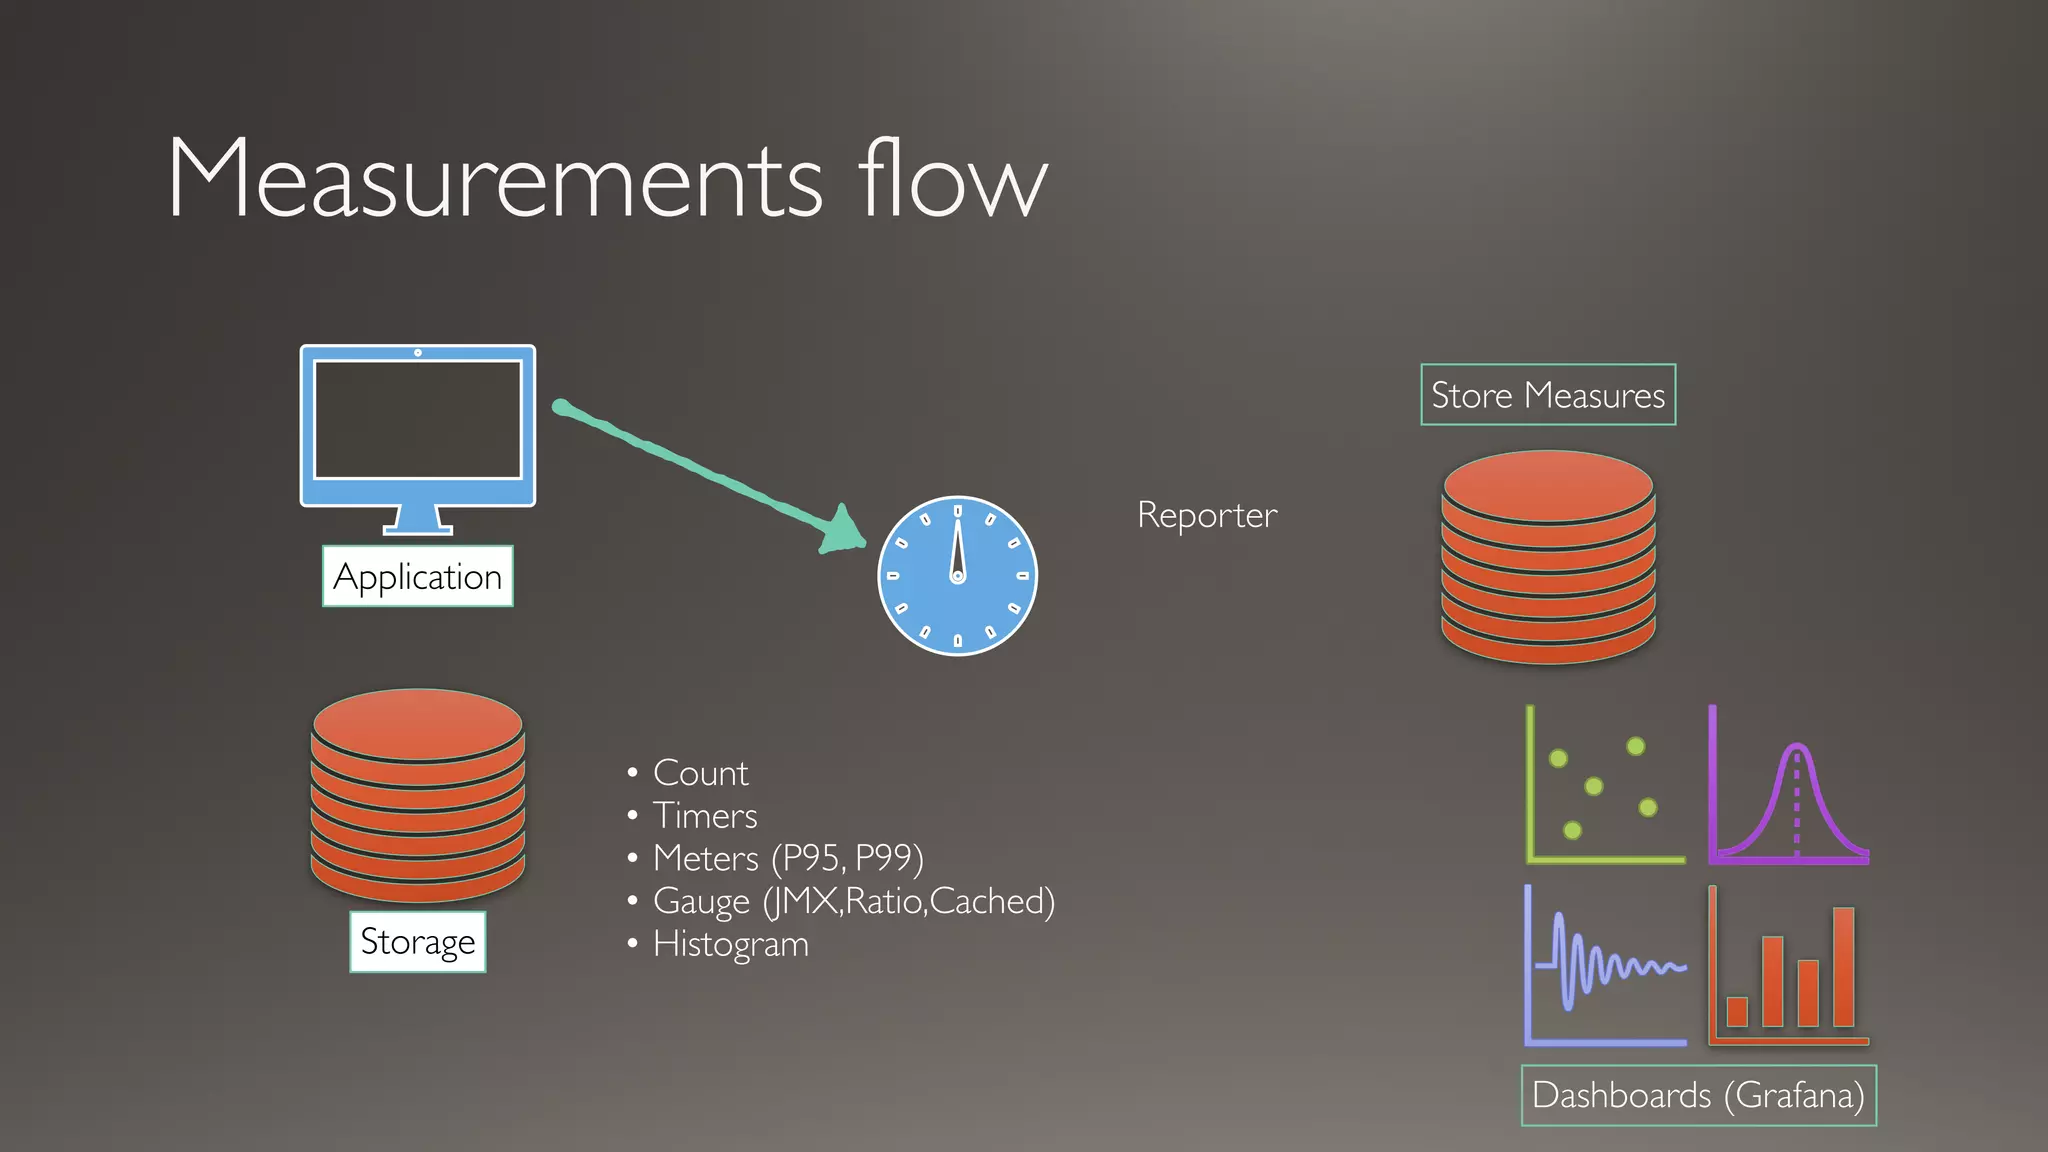
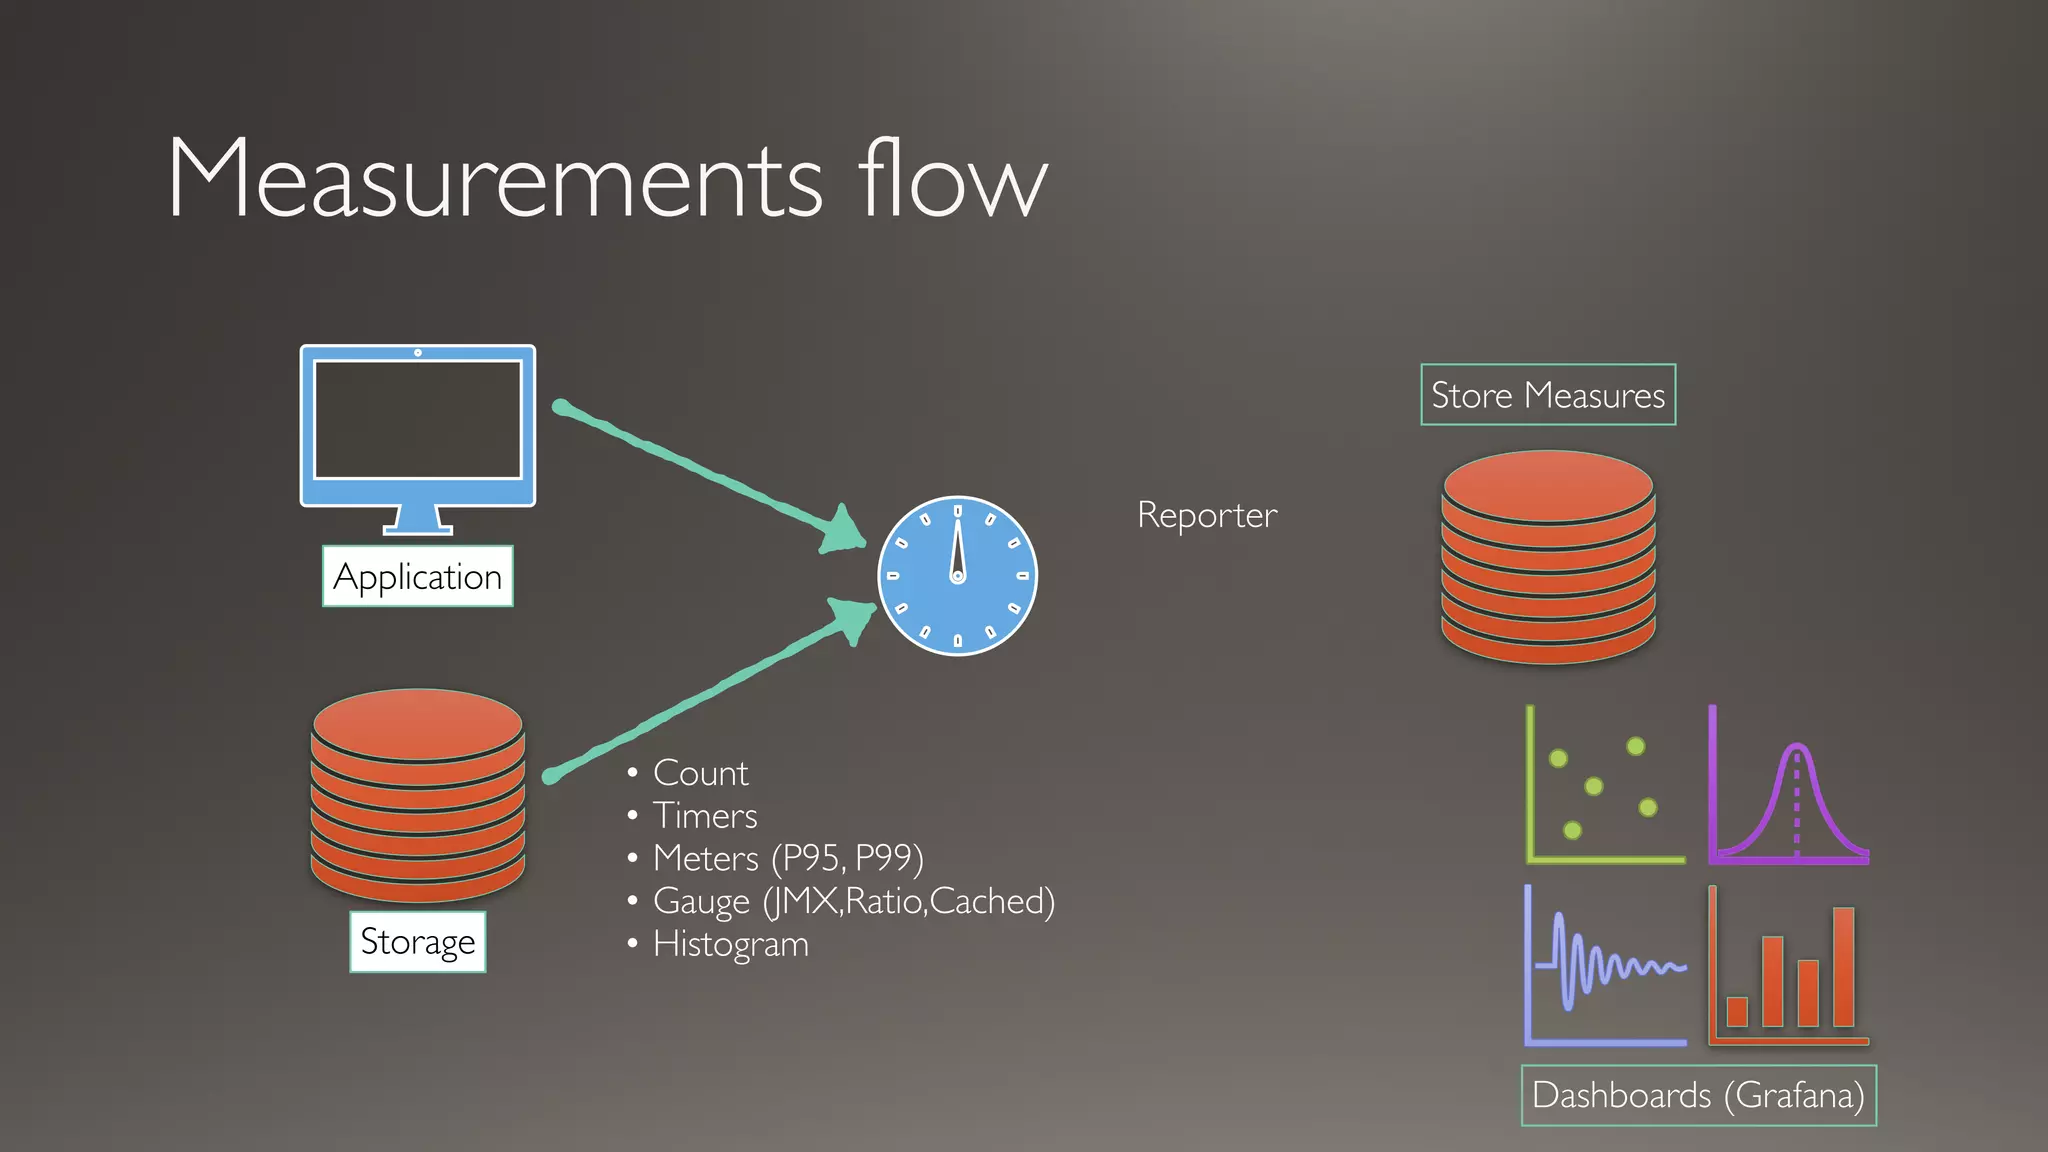
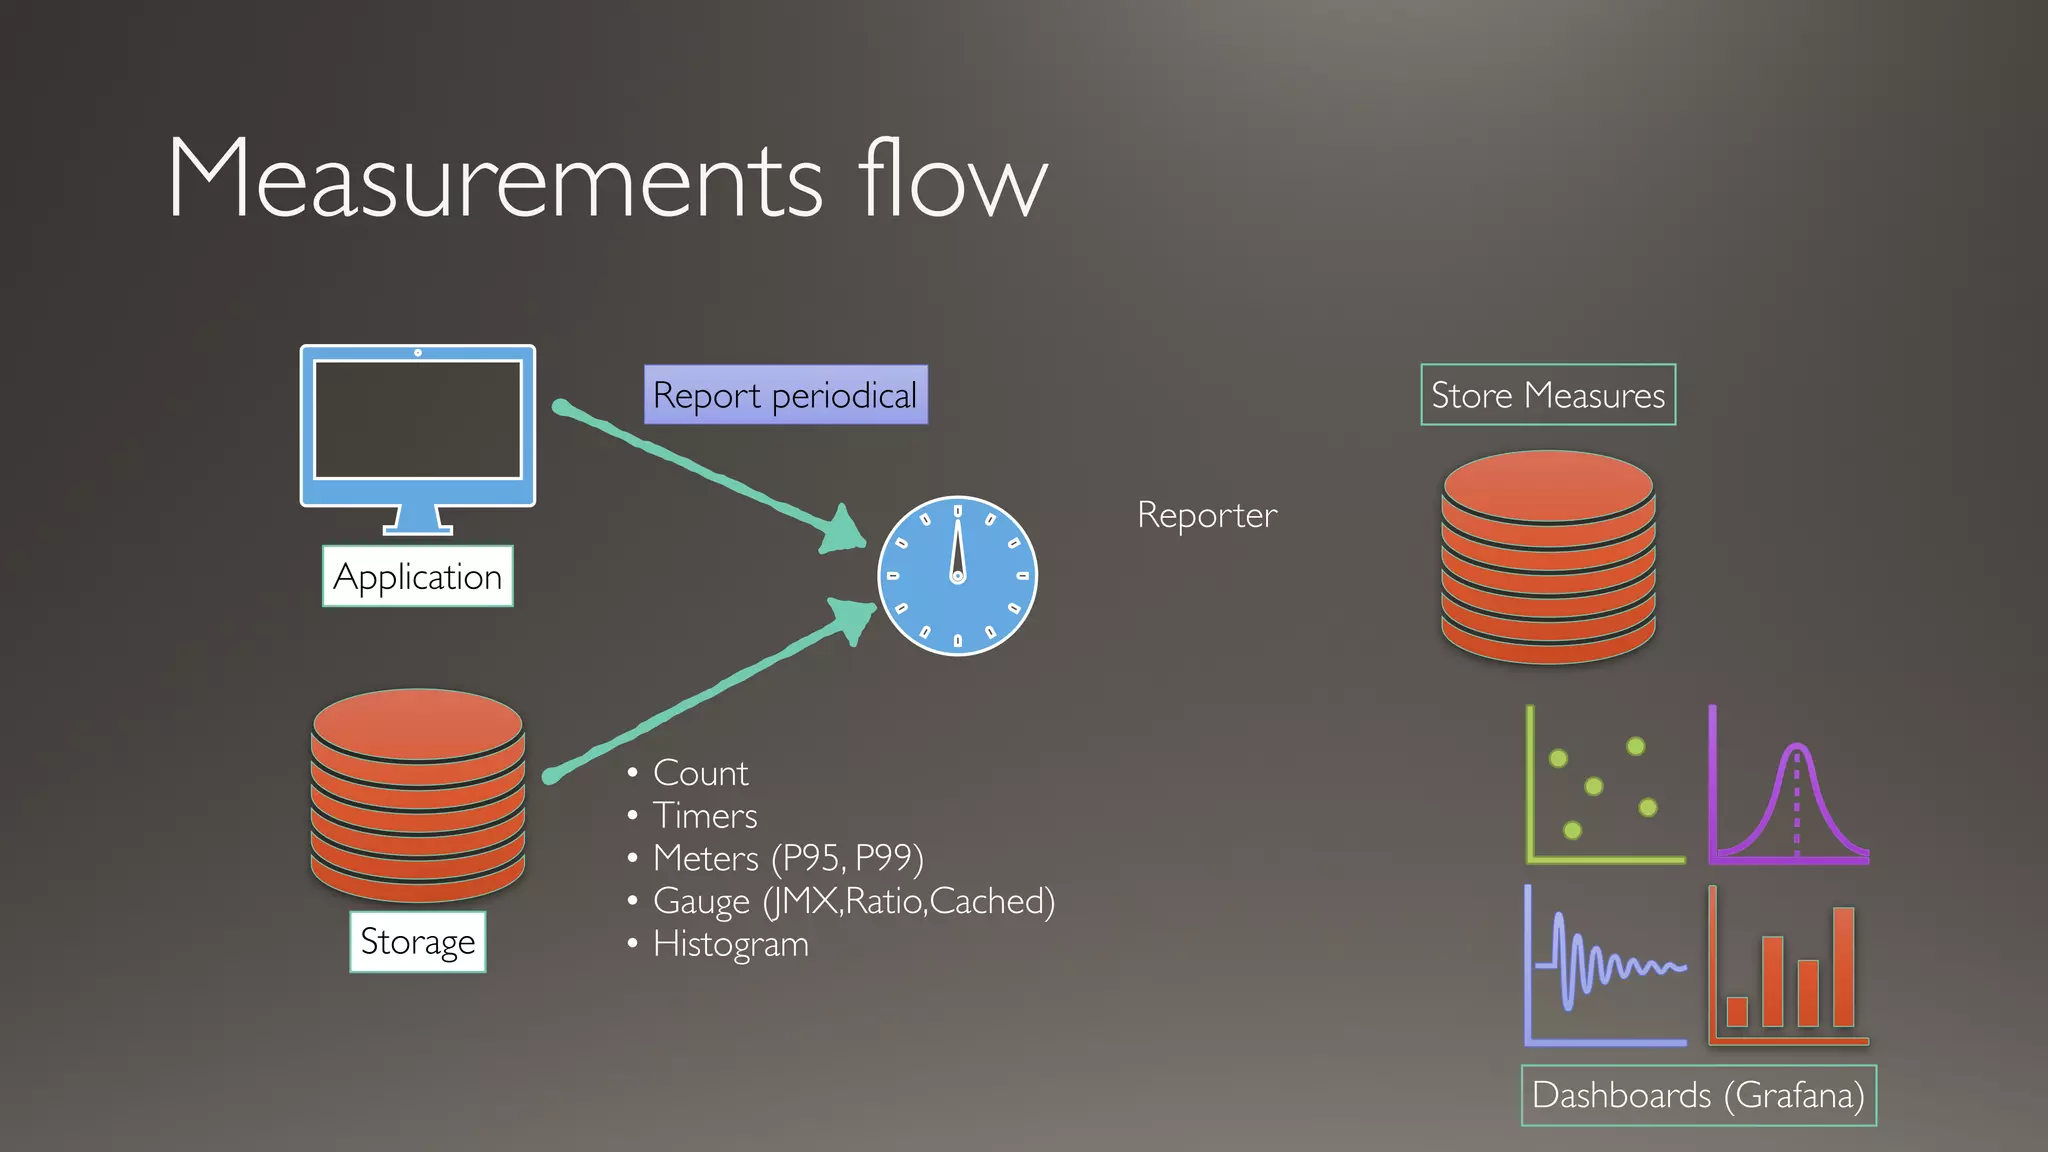
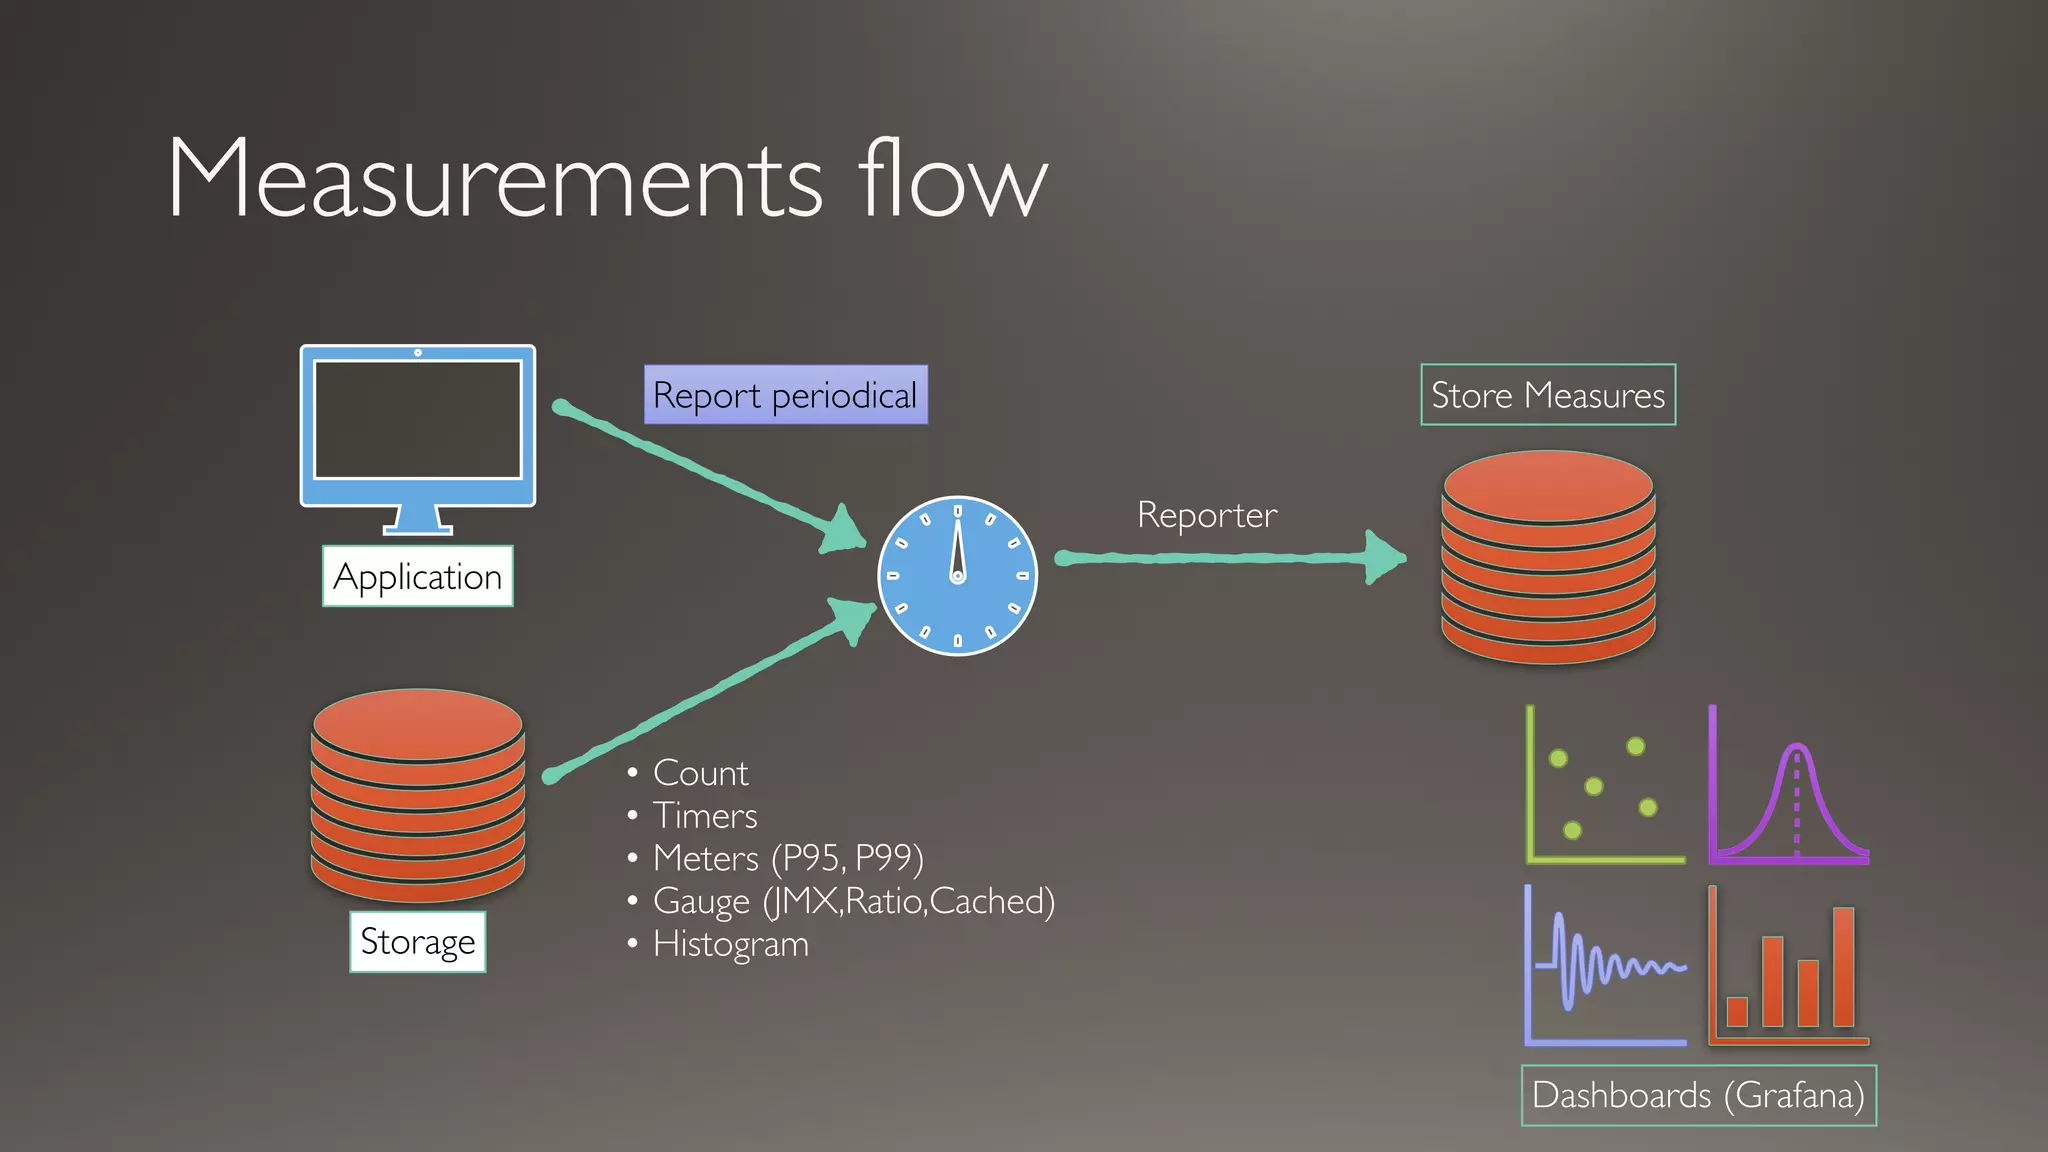
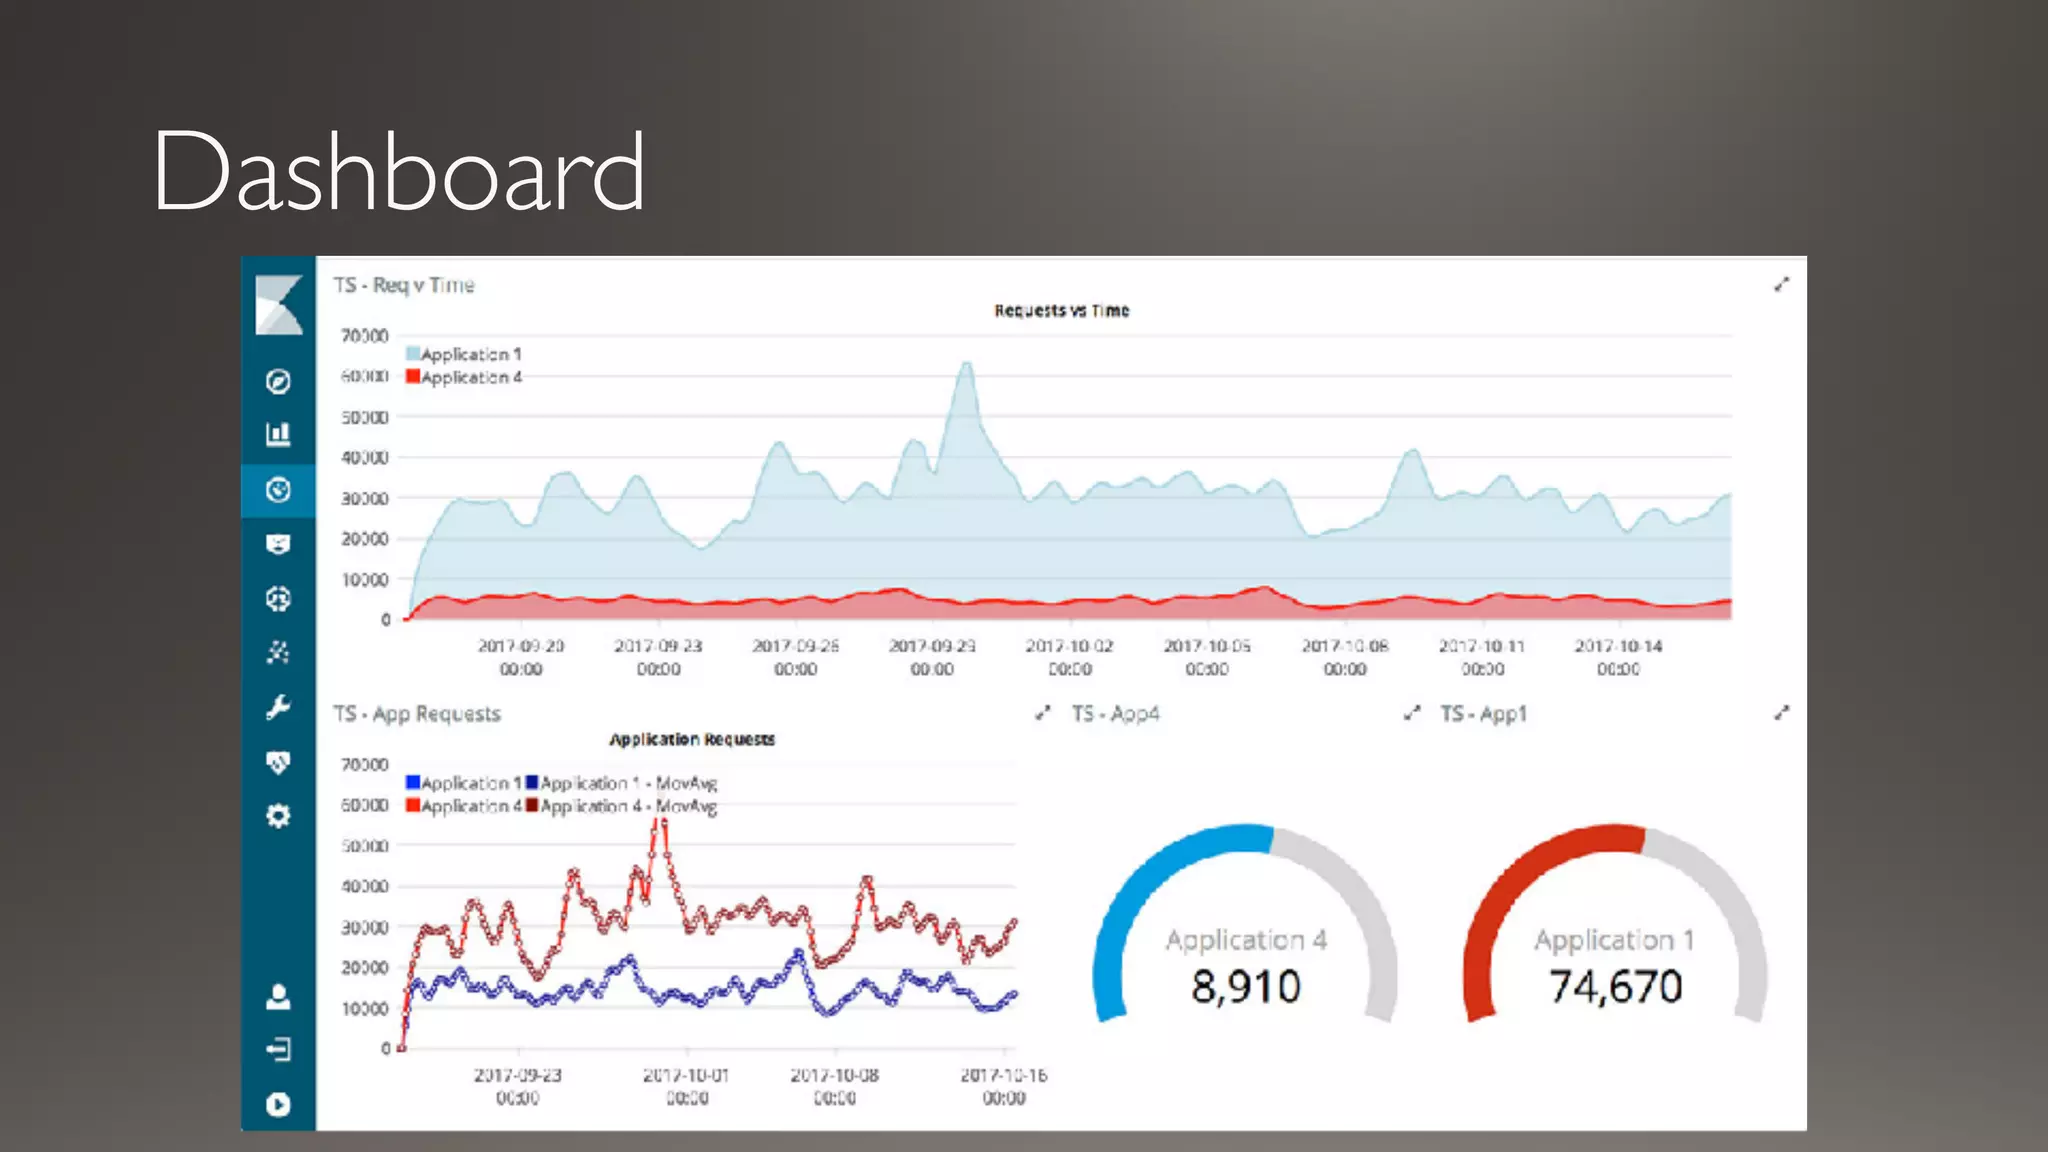
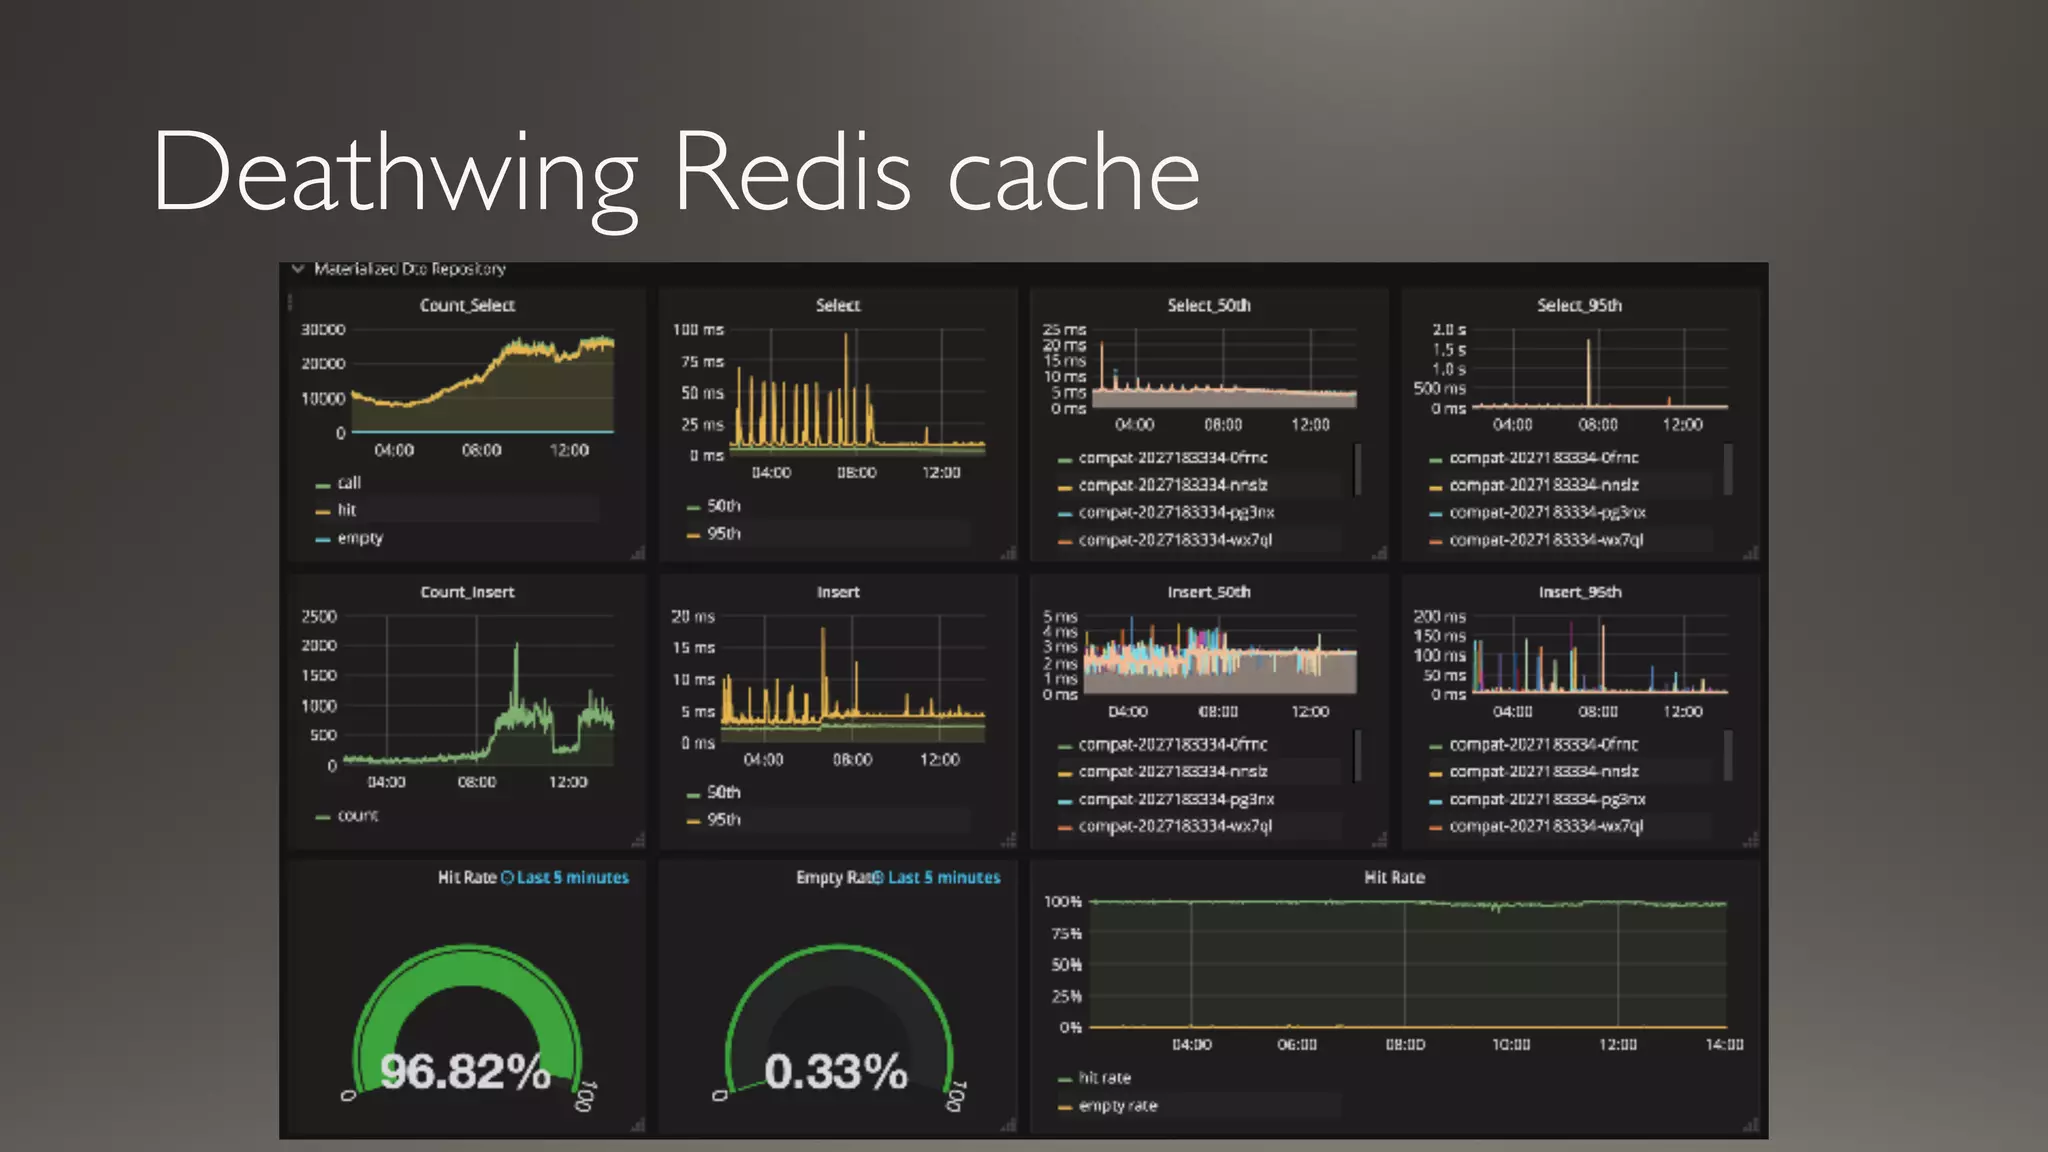
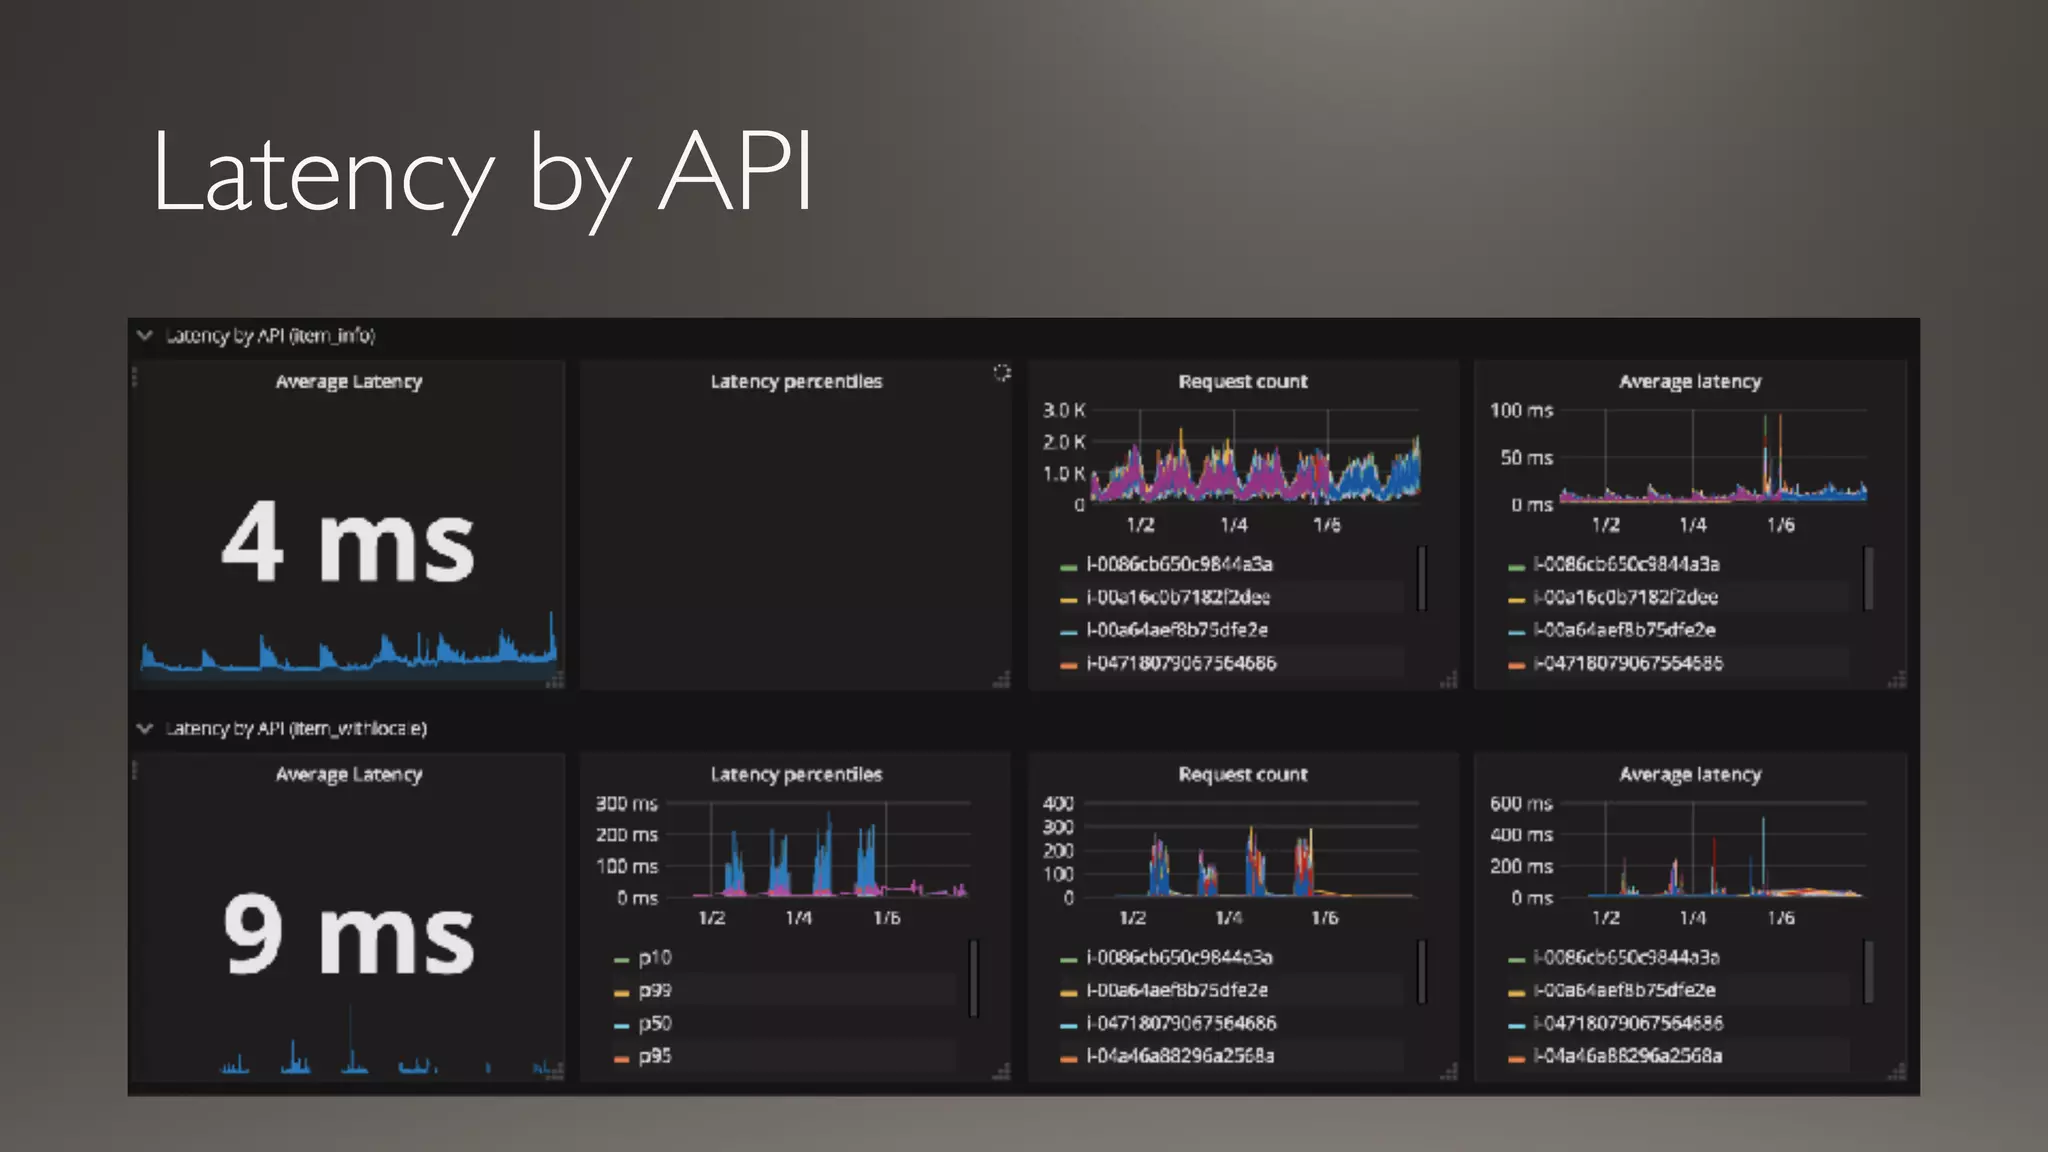
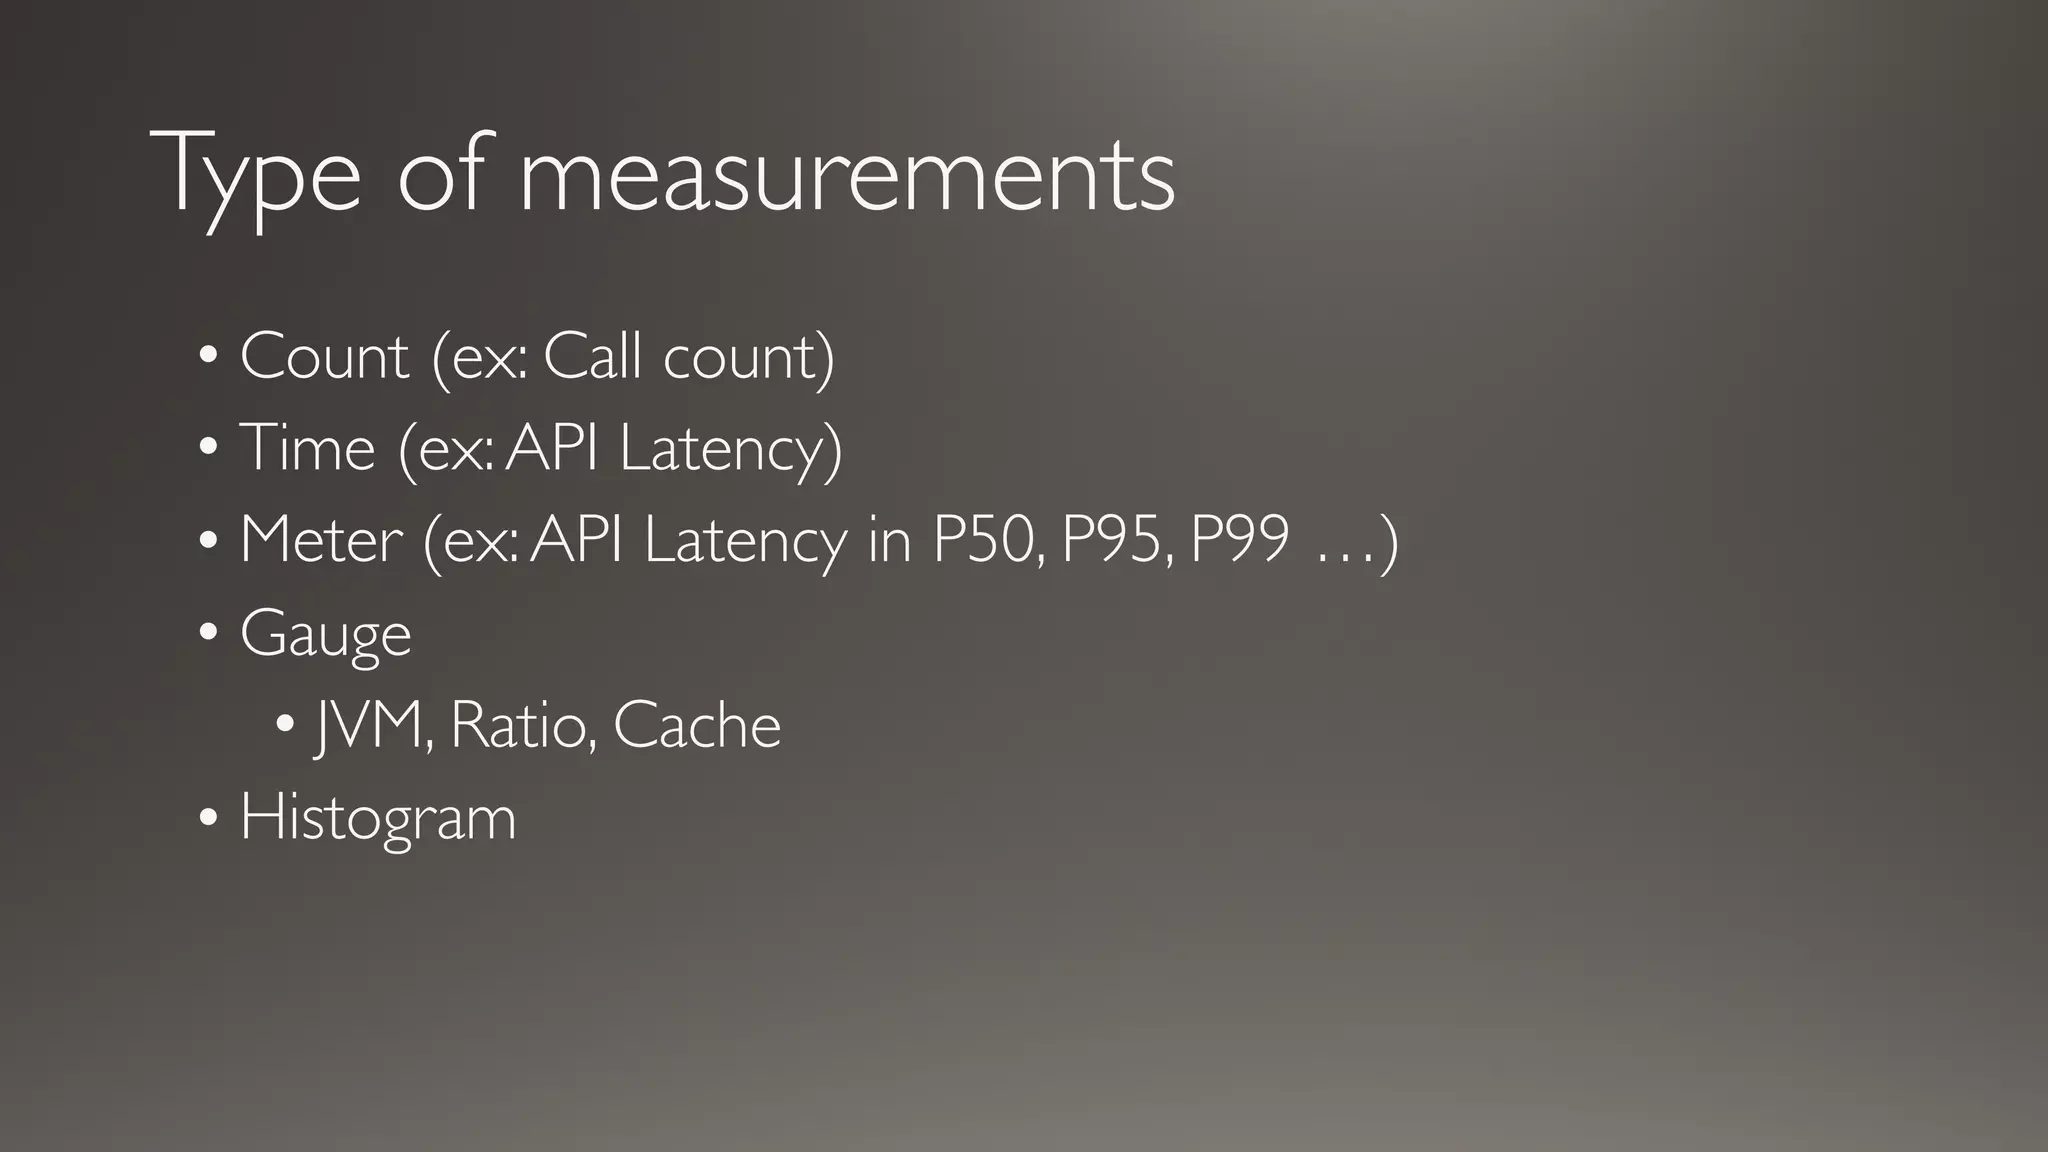
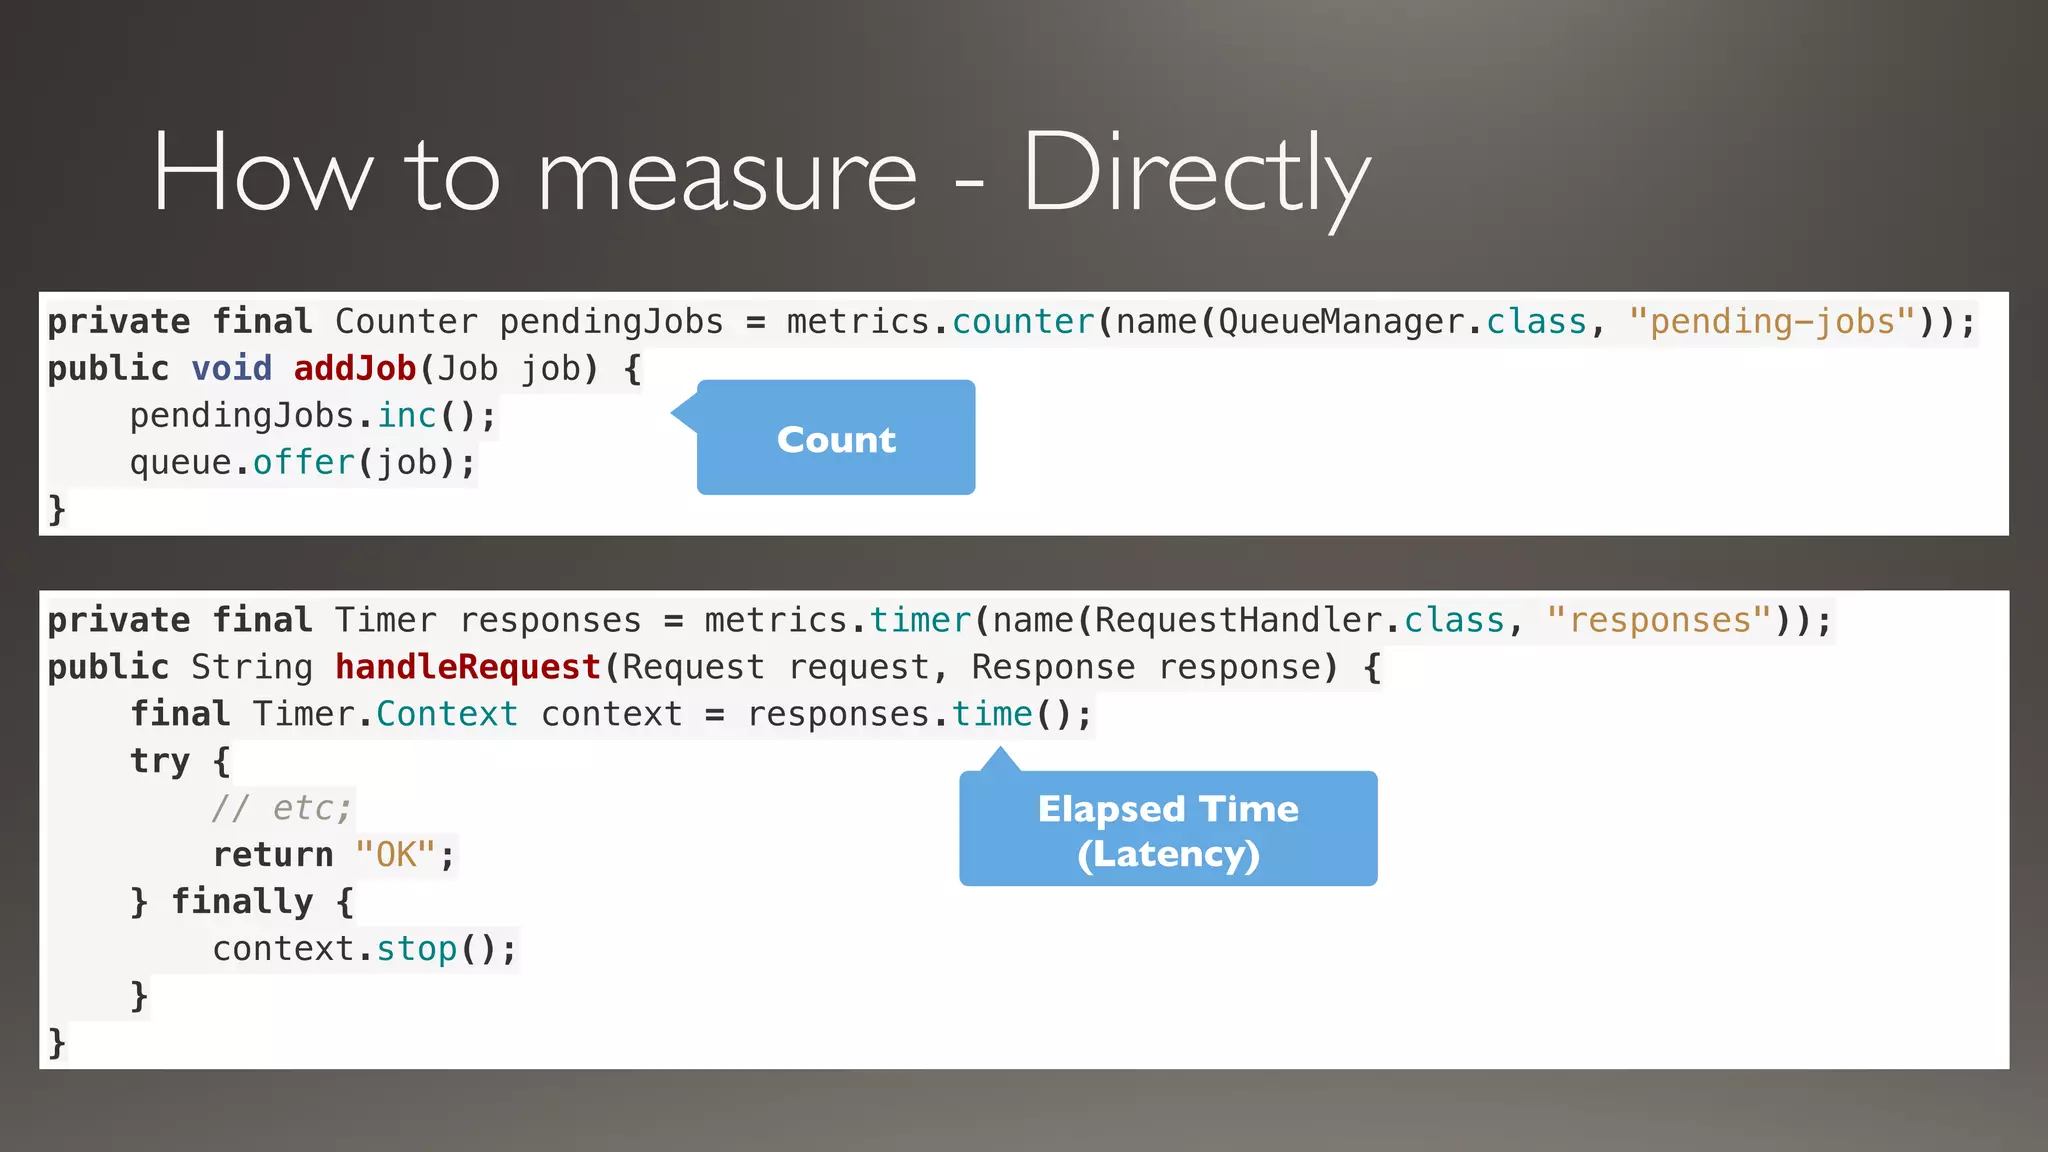
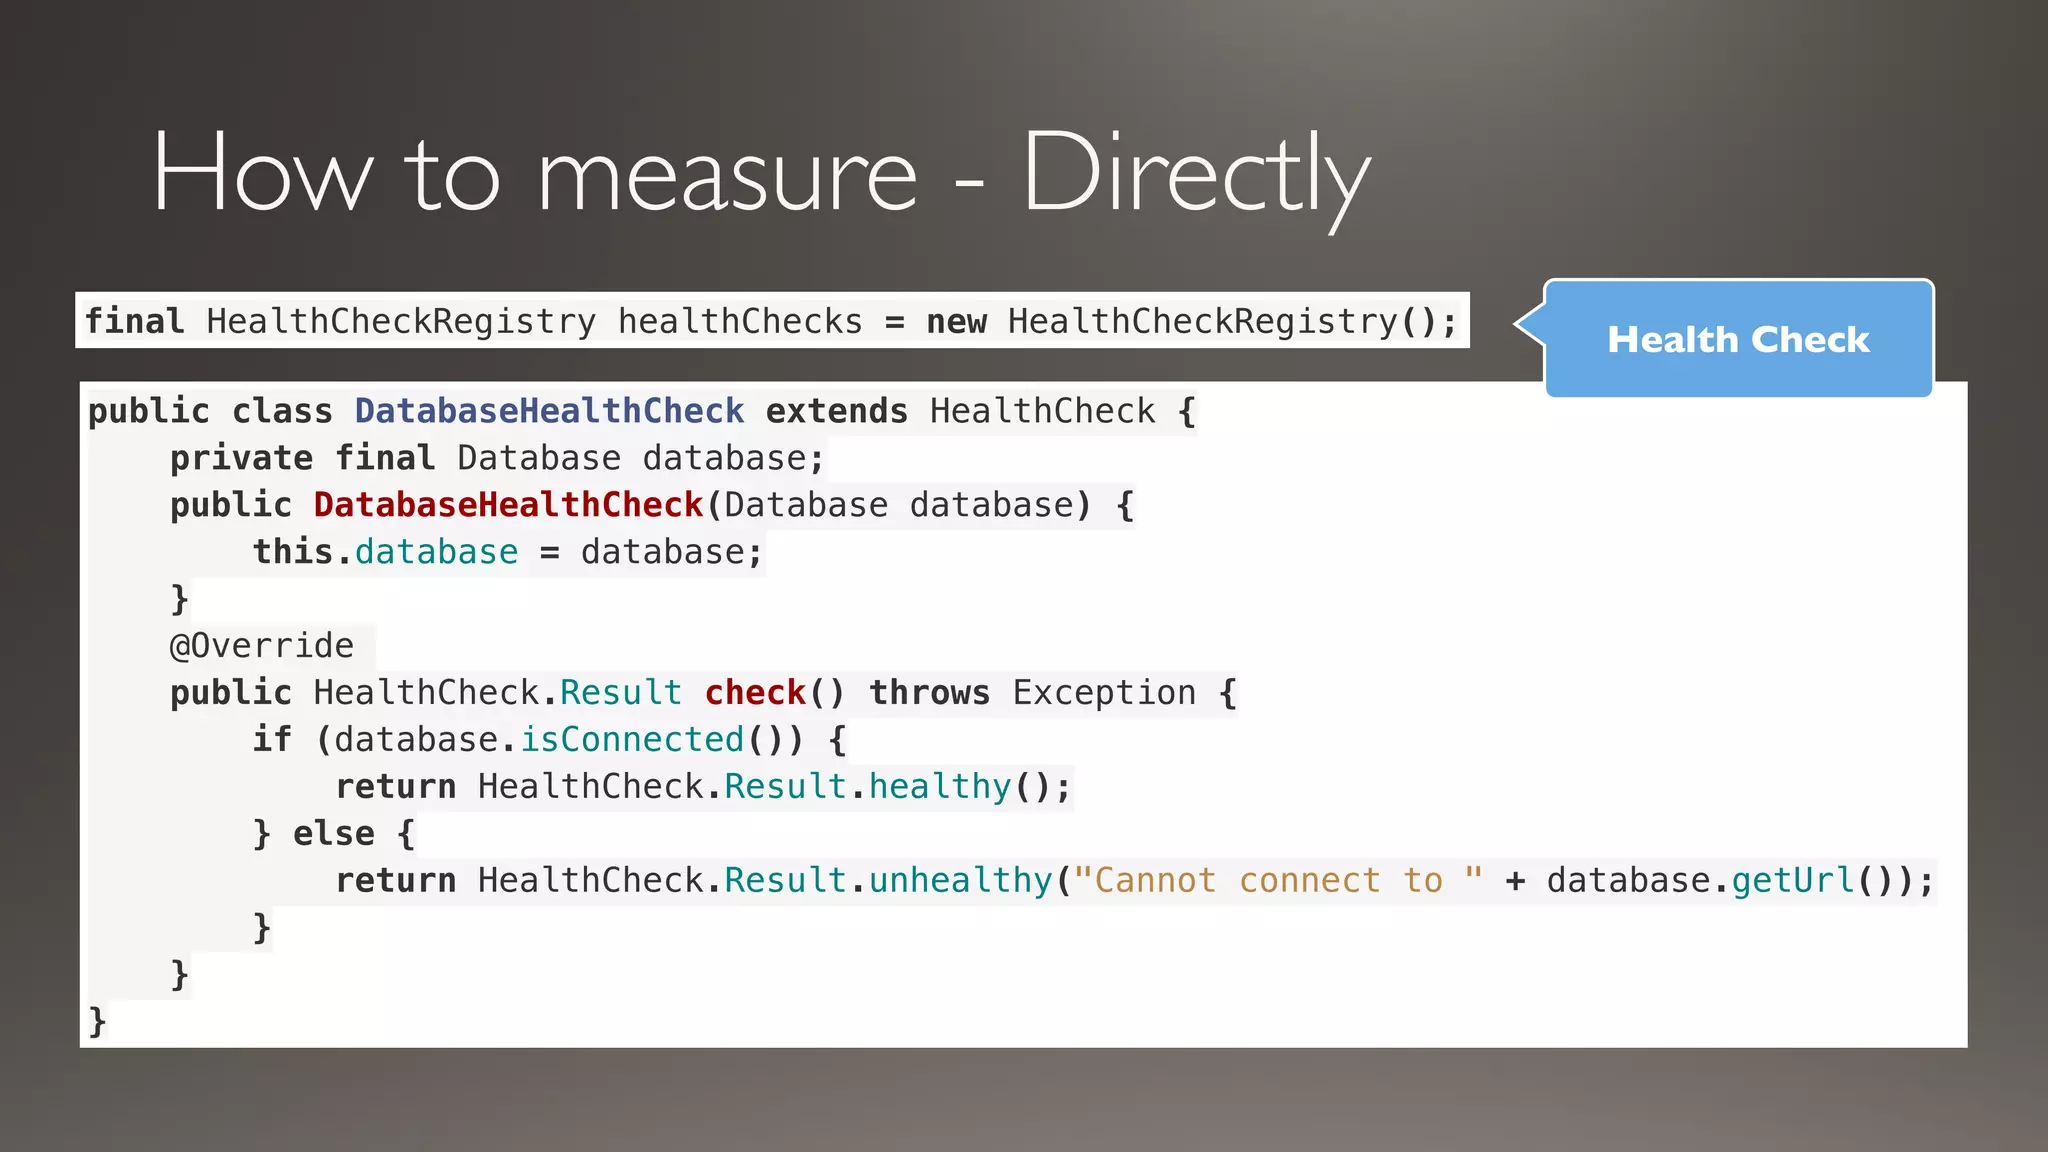
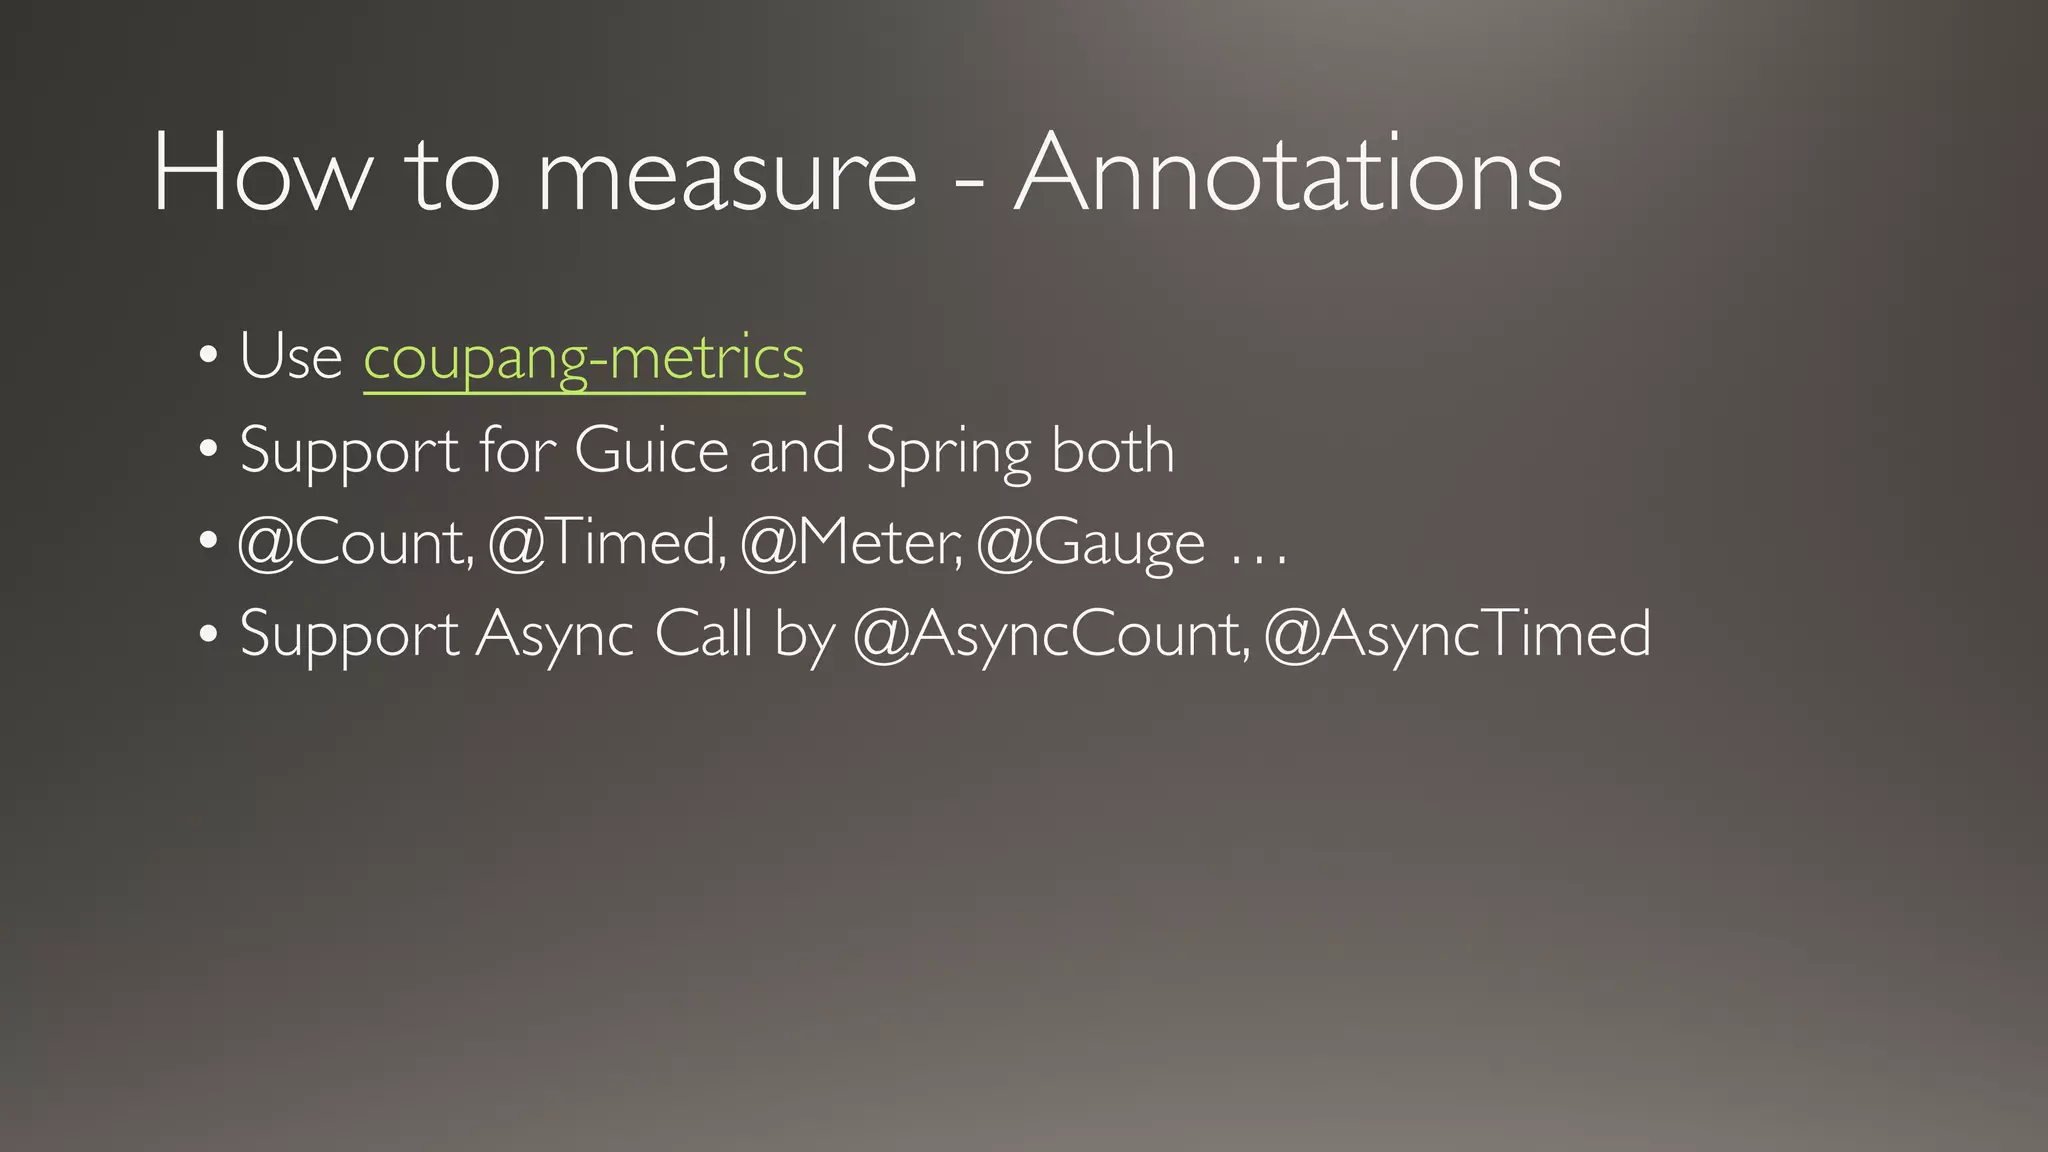
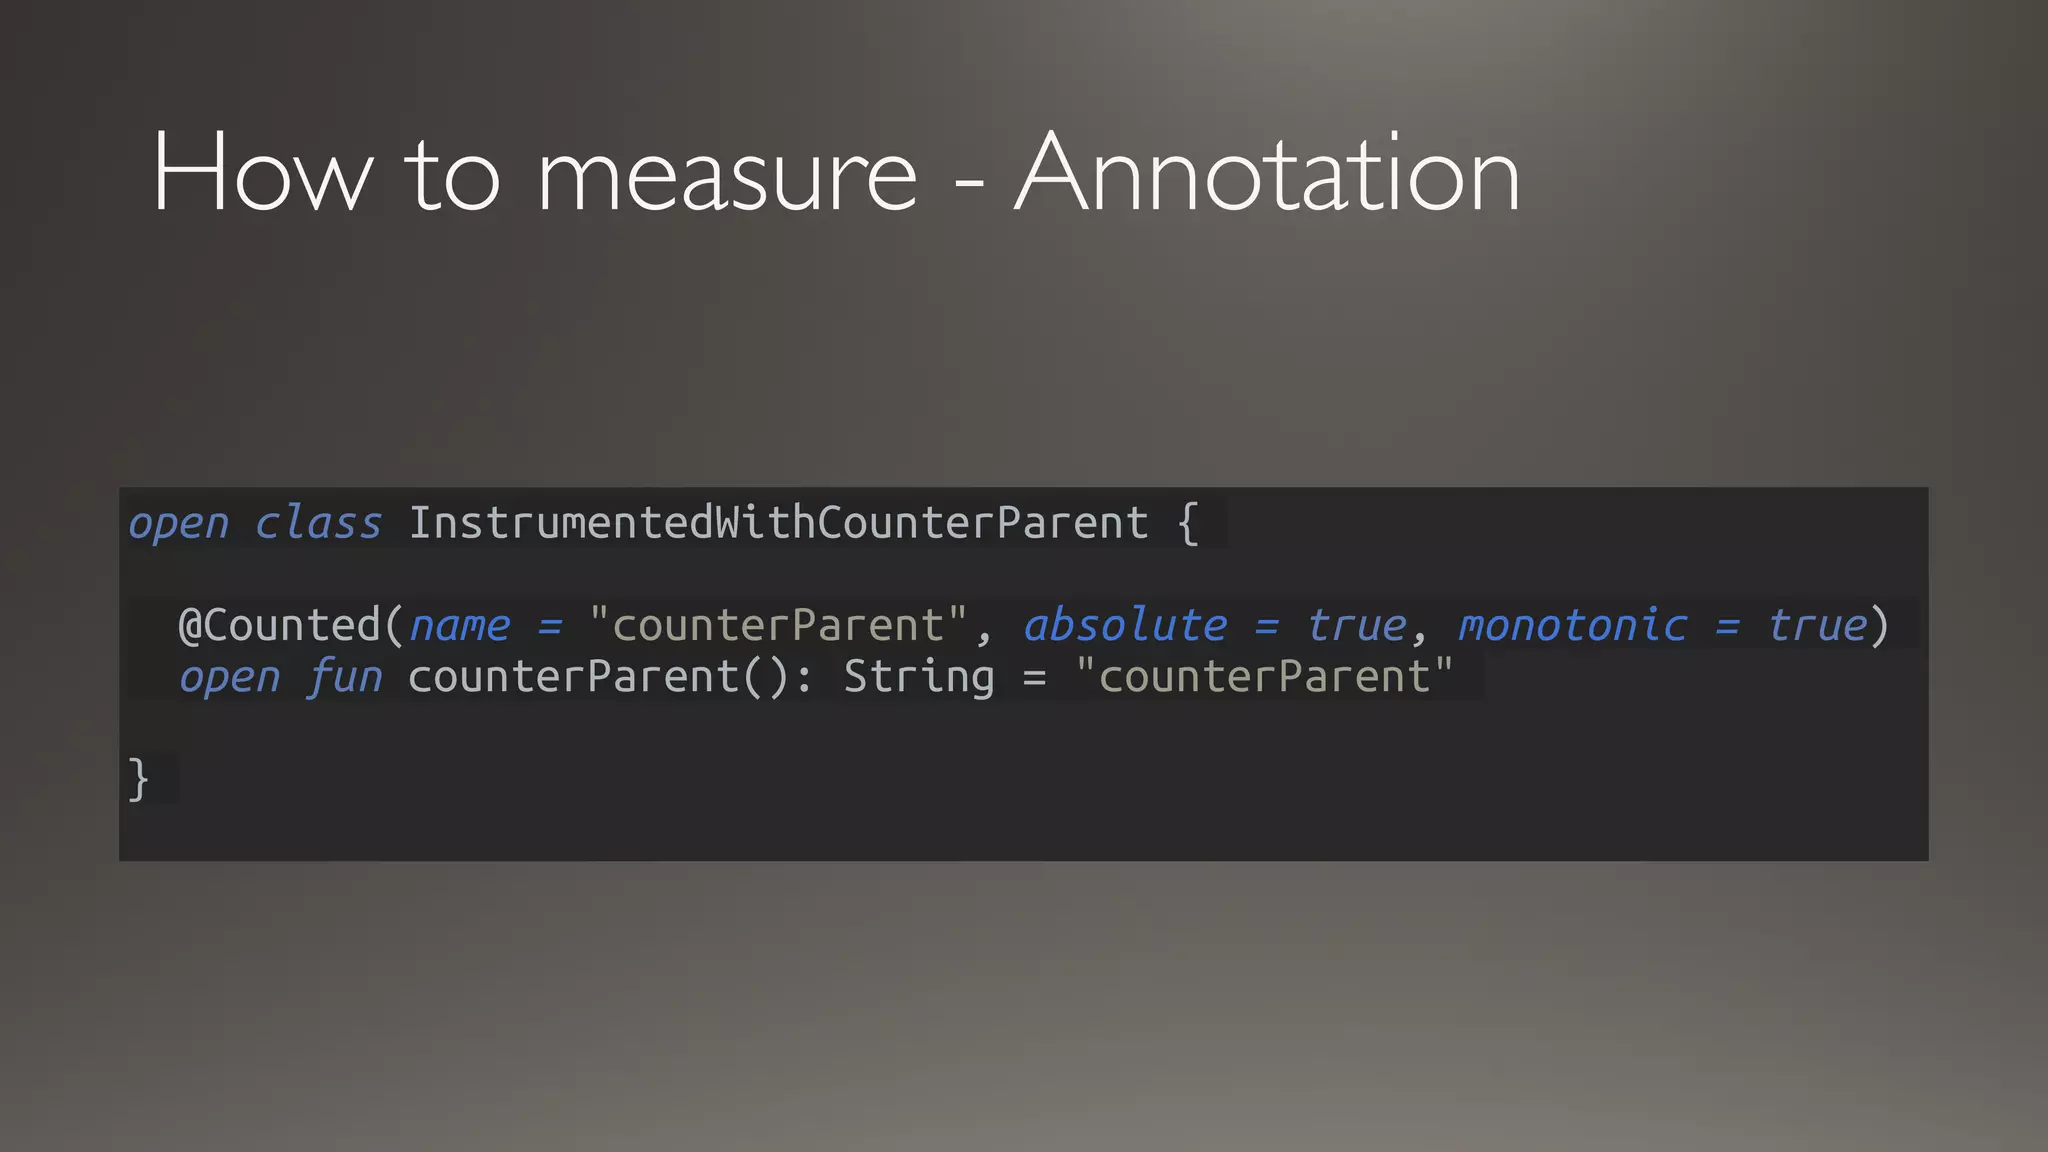
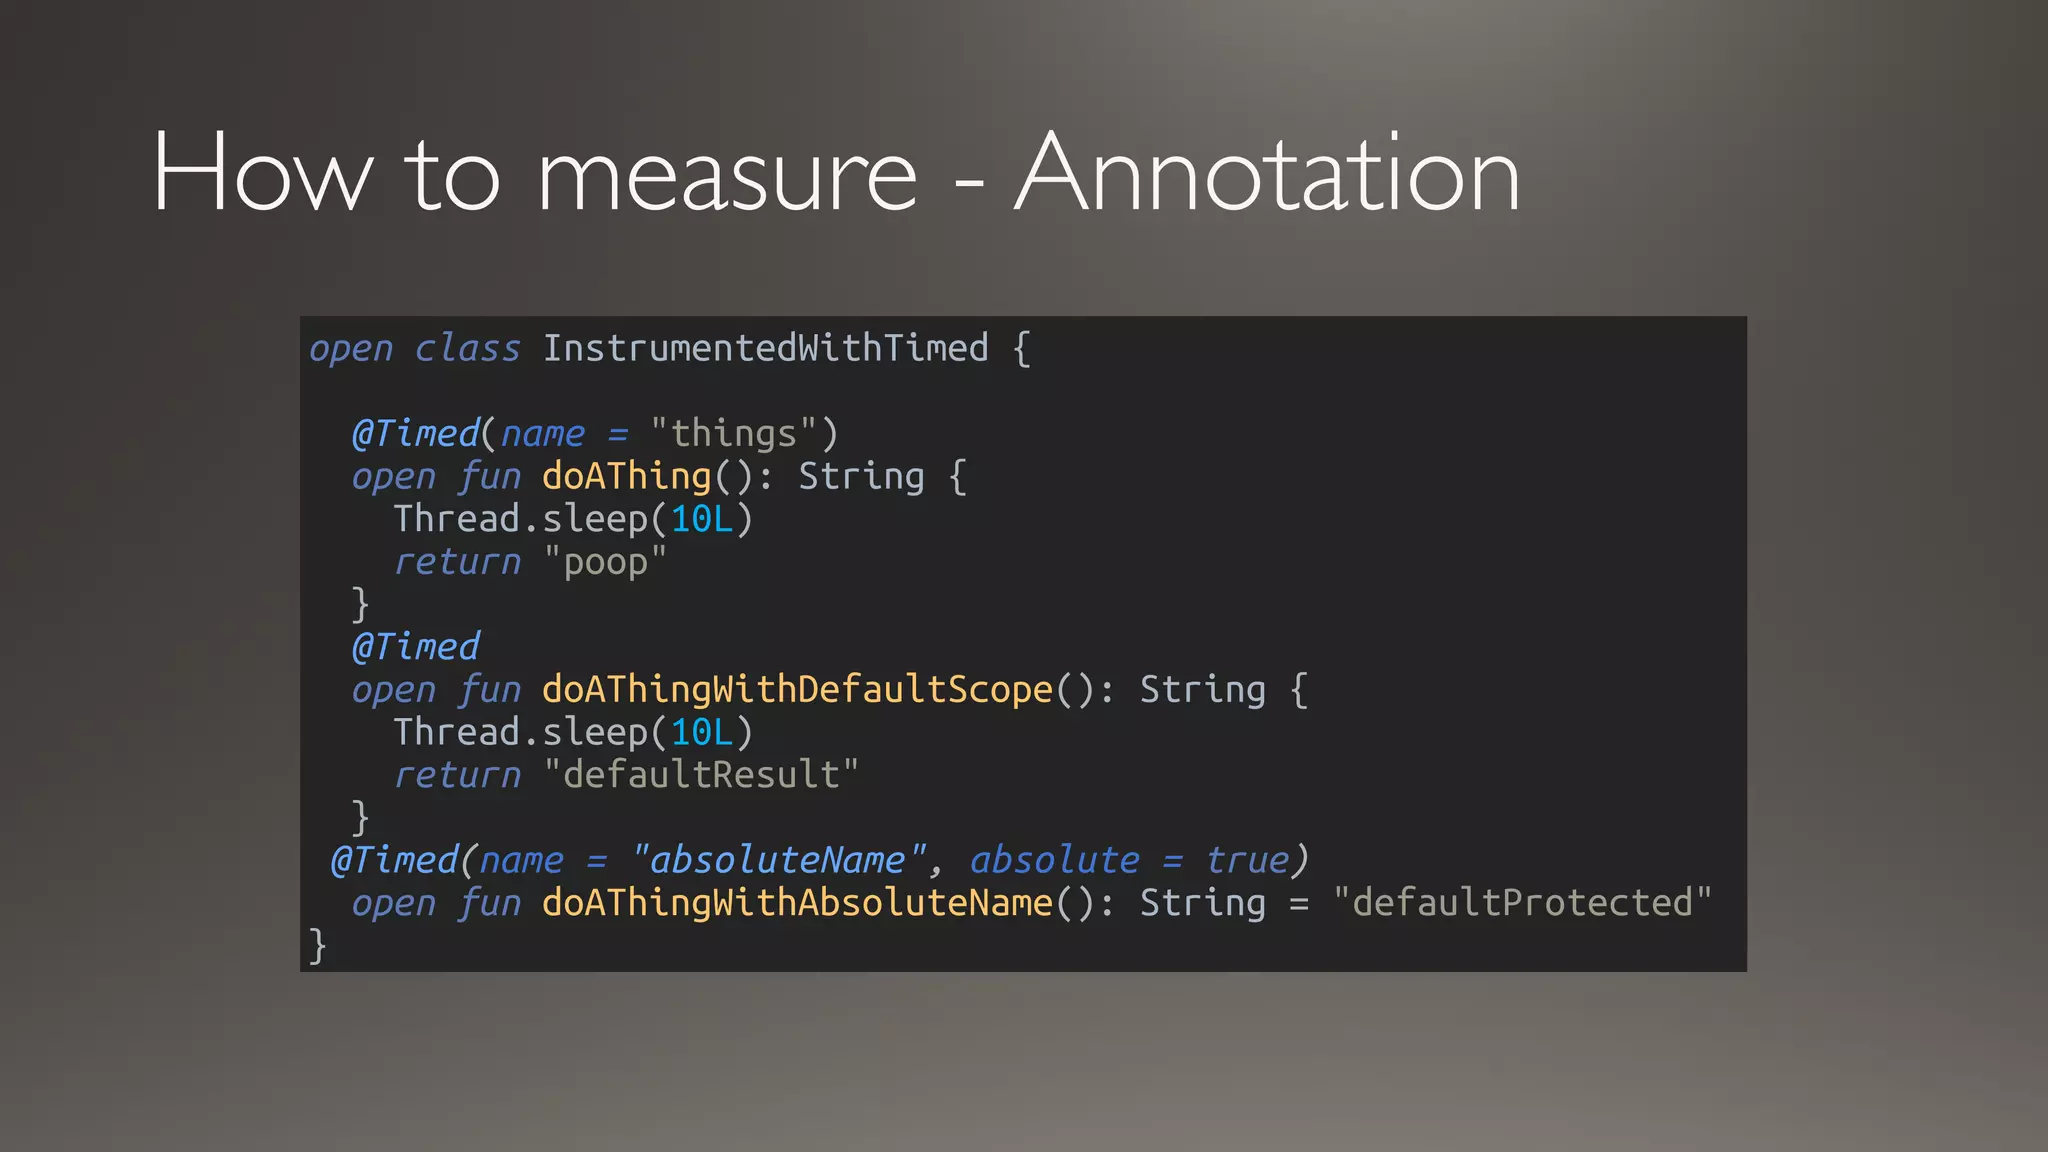
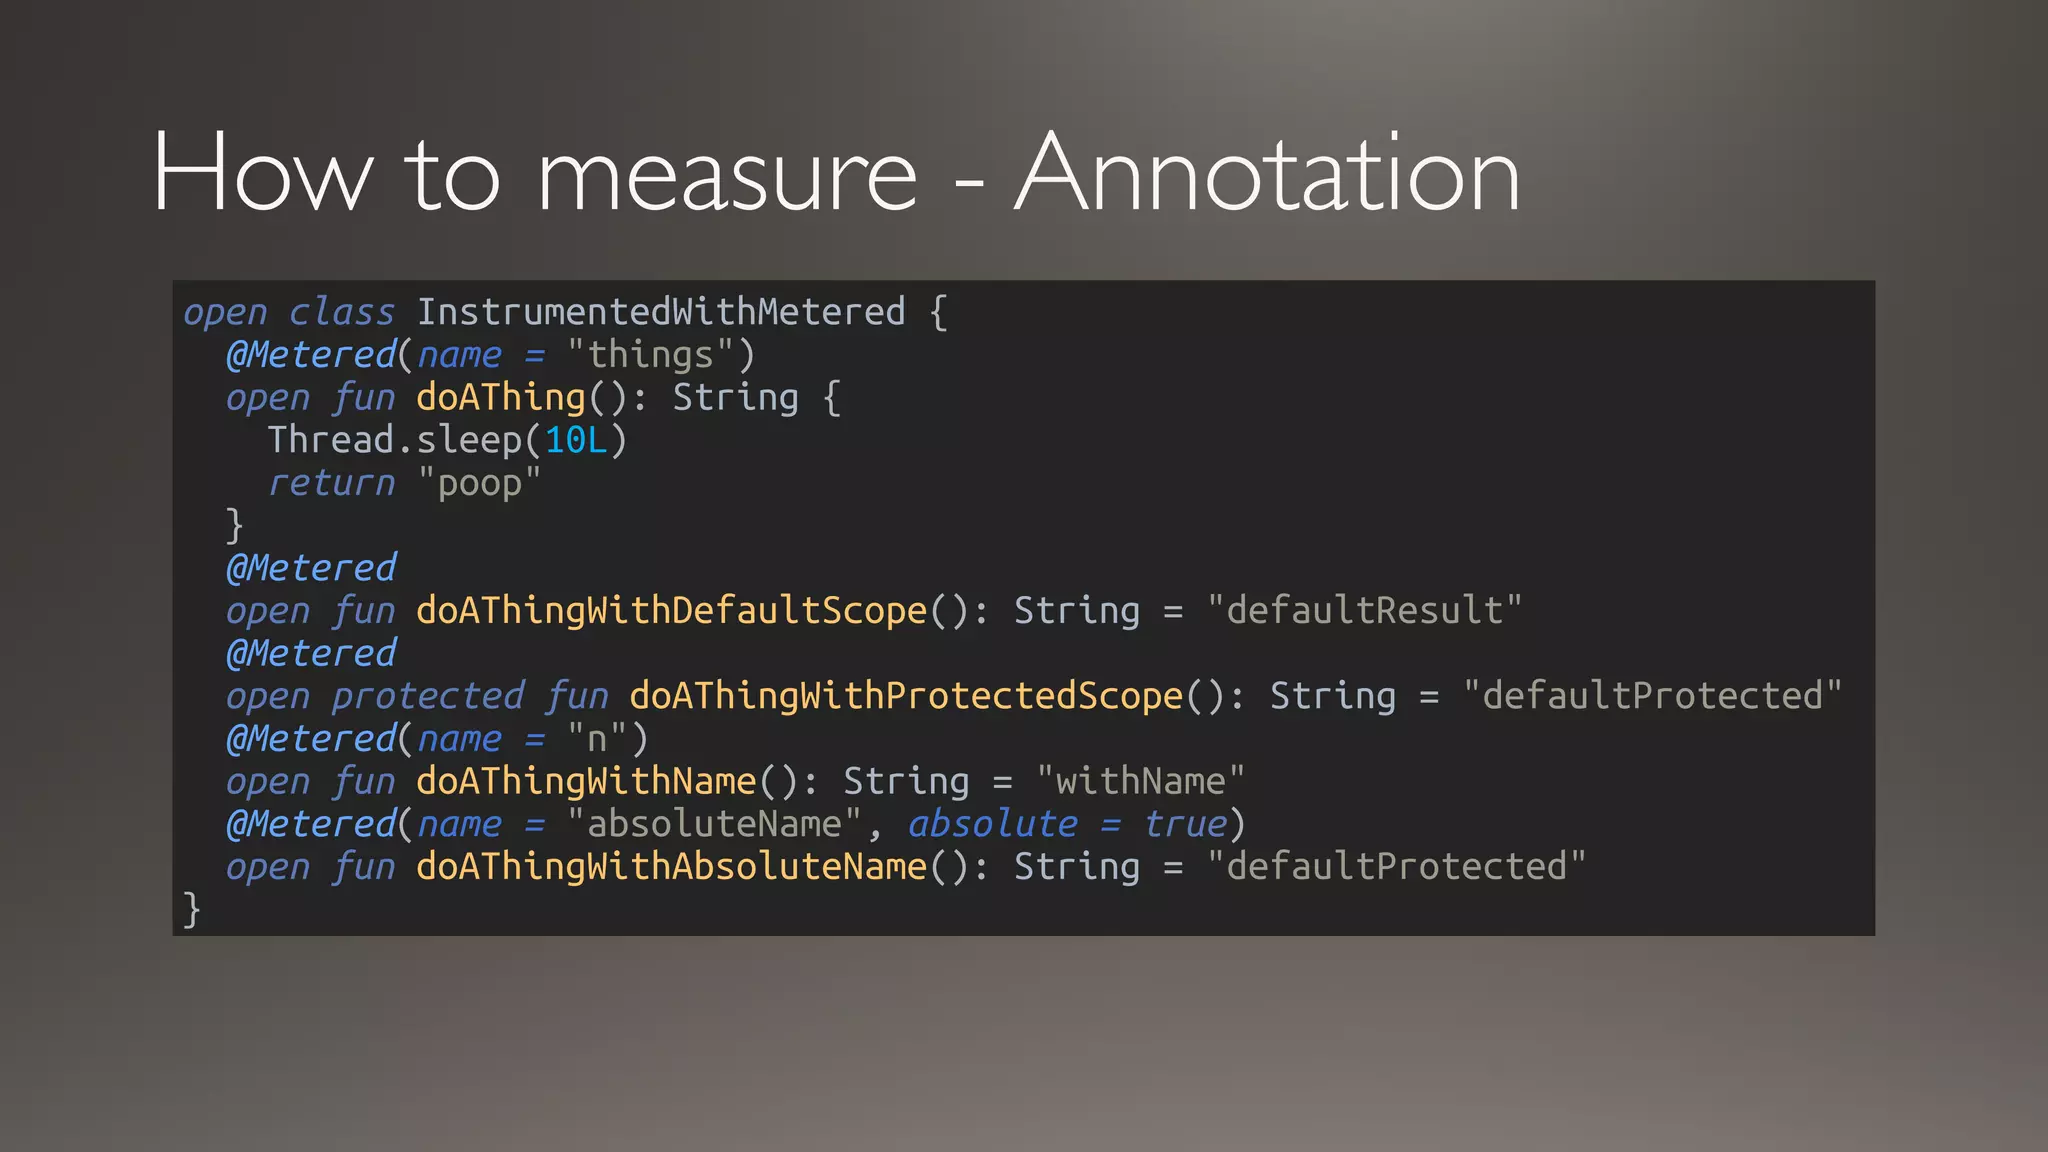
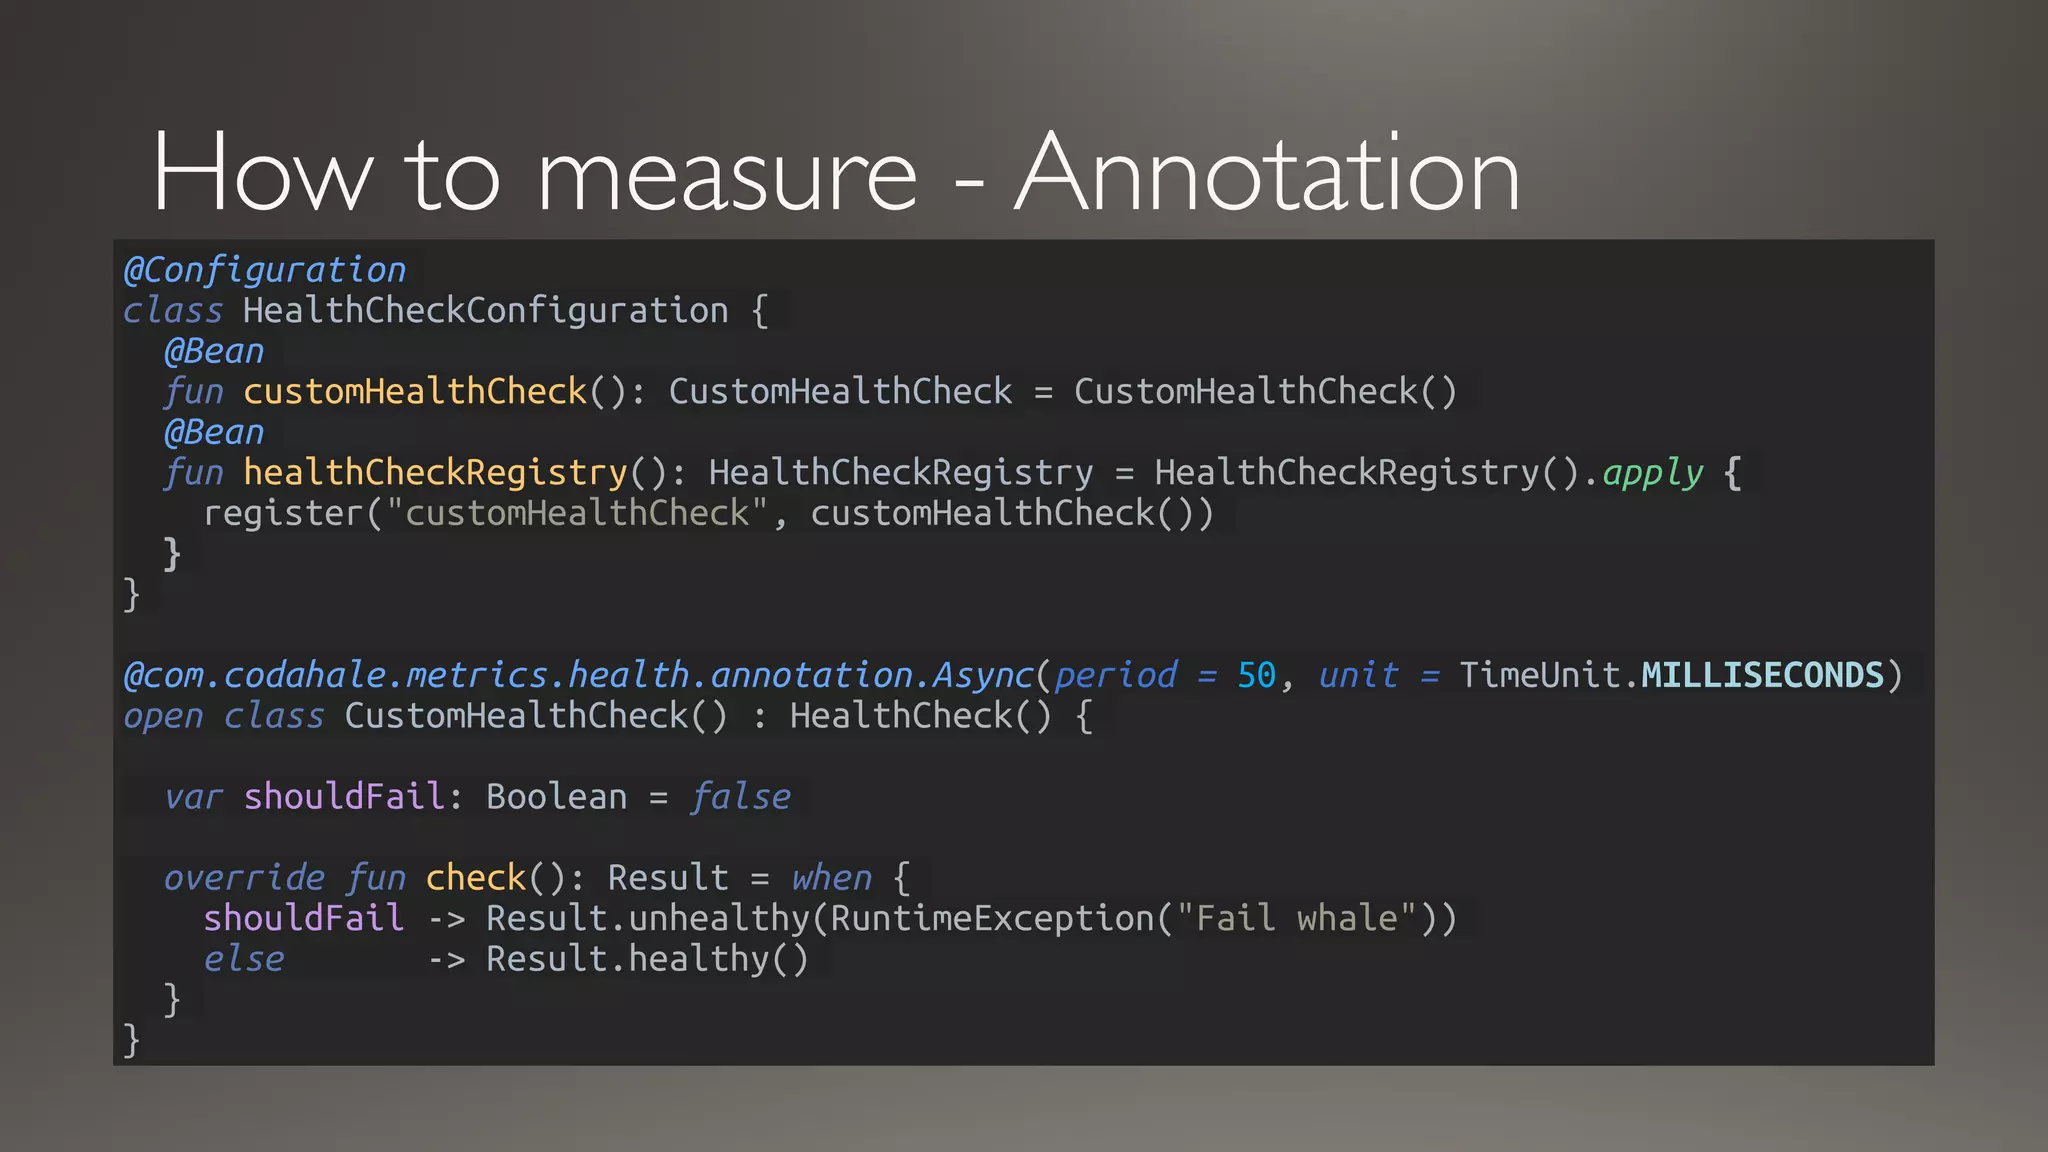


This document discusses metrics and measurements for monitoring systems. It describes the purpose of measurements as gathering quantifiable data to check system health and identify areas for improvement. It outlines the typical flow of collecting measures from applications and services, storing them, and reporting them to dashboards. It provides examples of common metric types like counts, timers, gauges, and histograms. Finally, it explains how to implement measurements directly in code or using annotations.