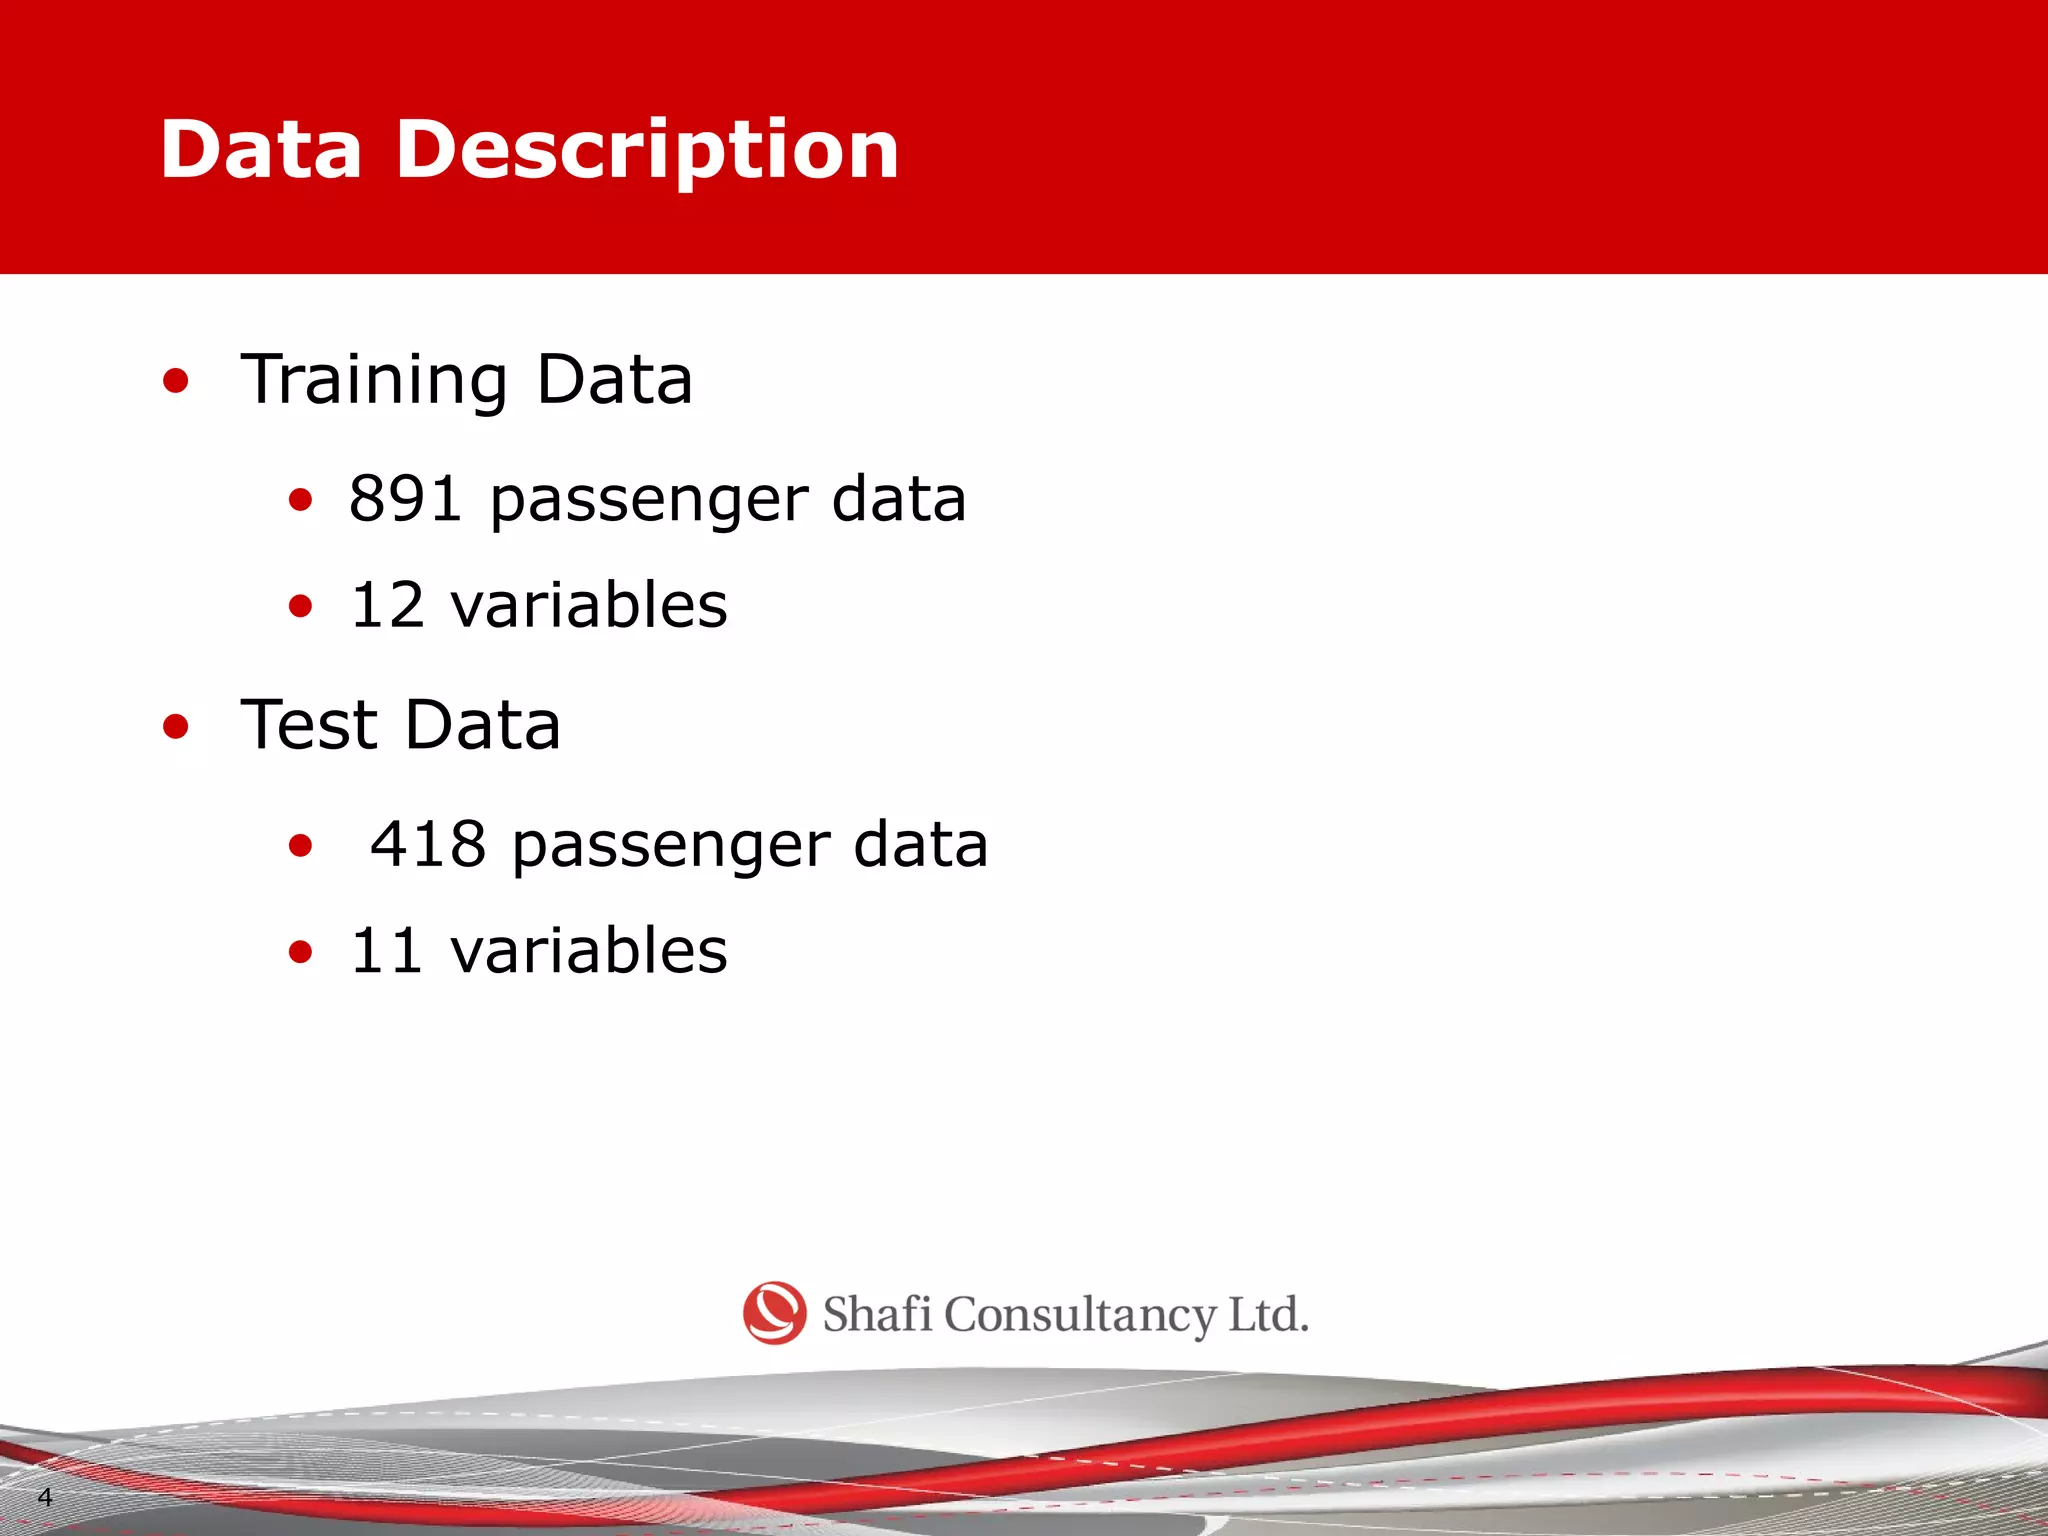
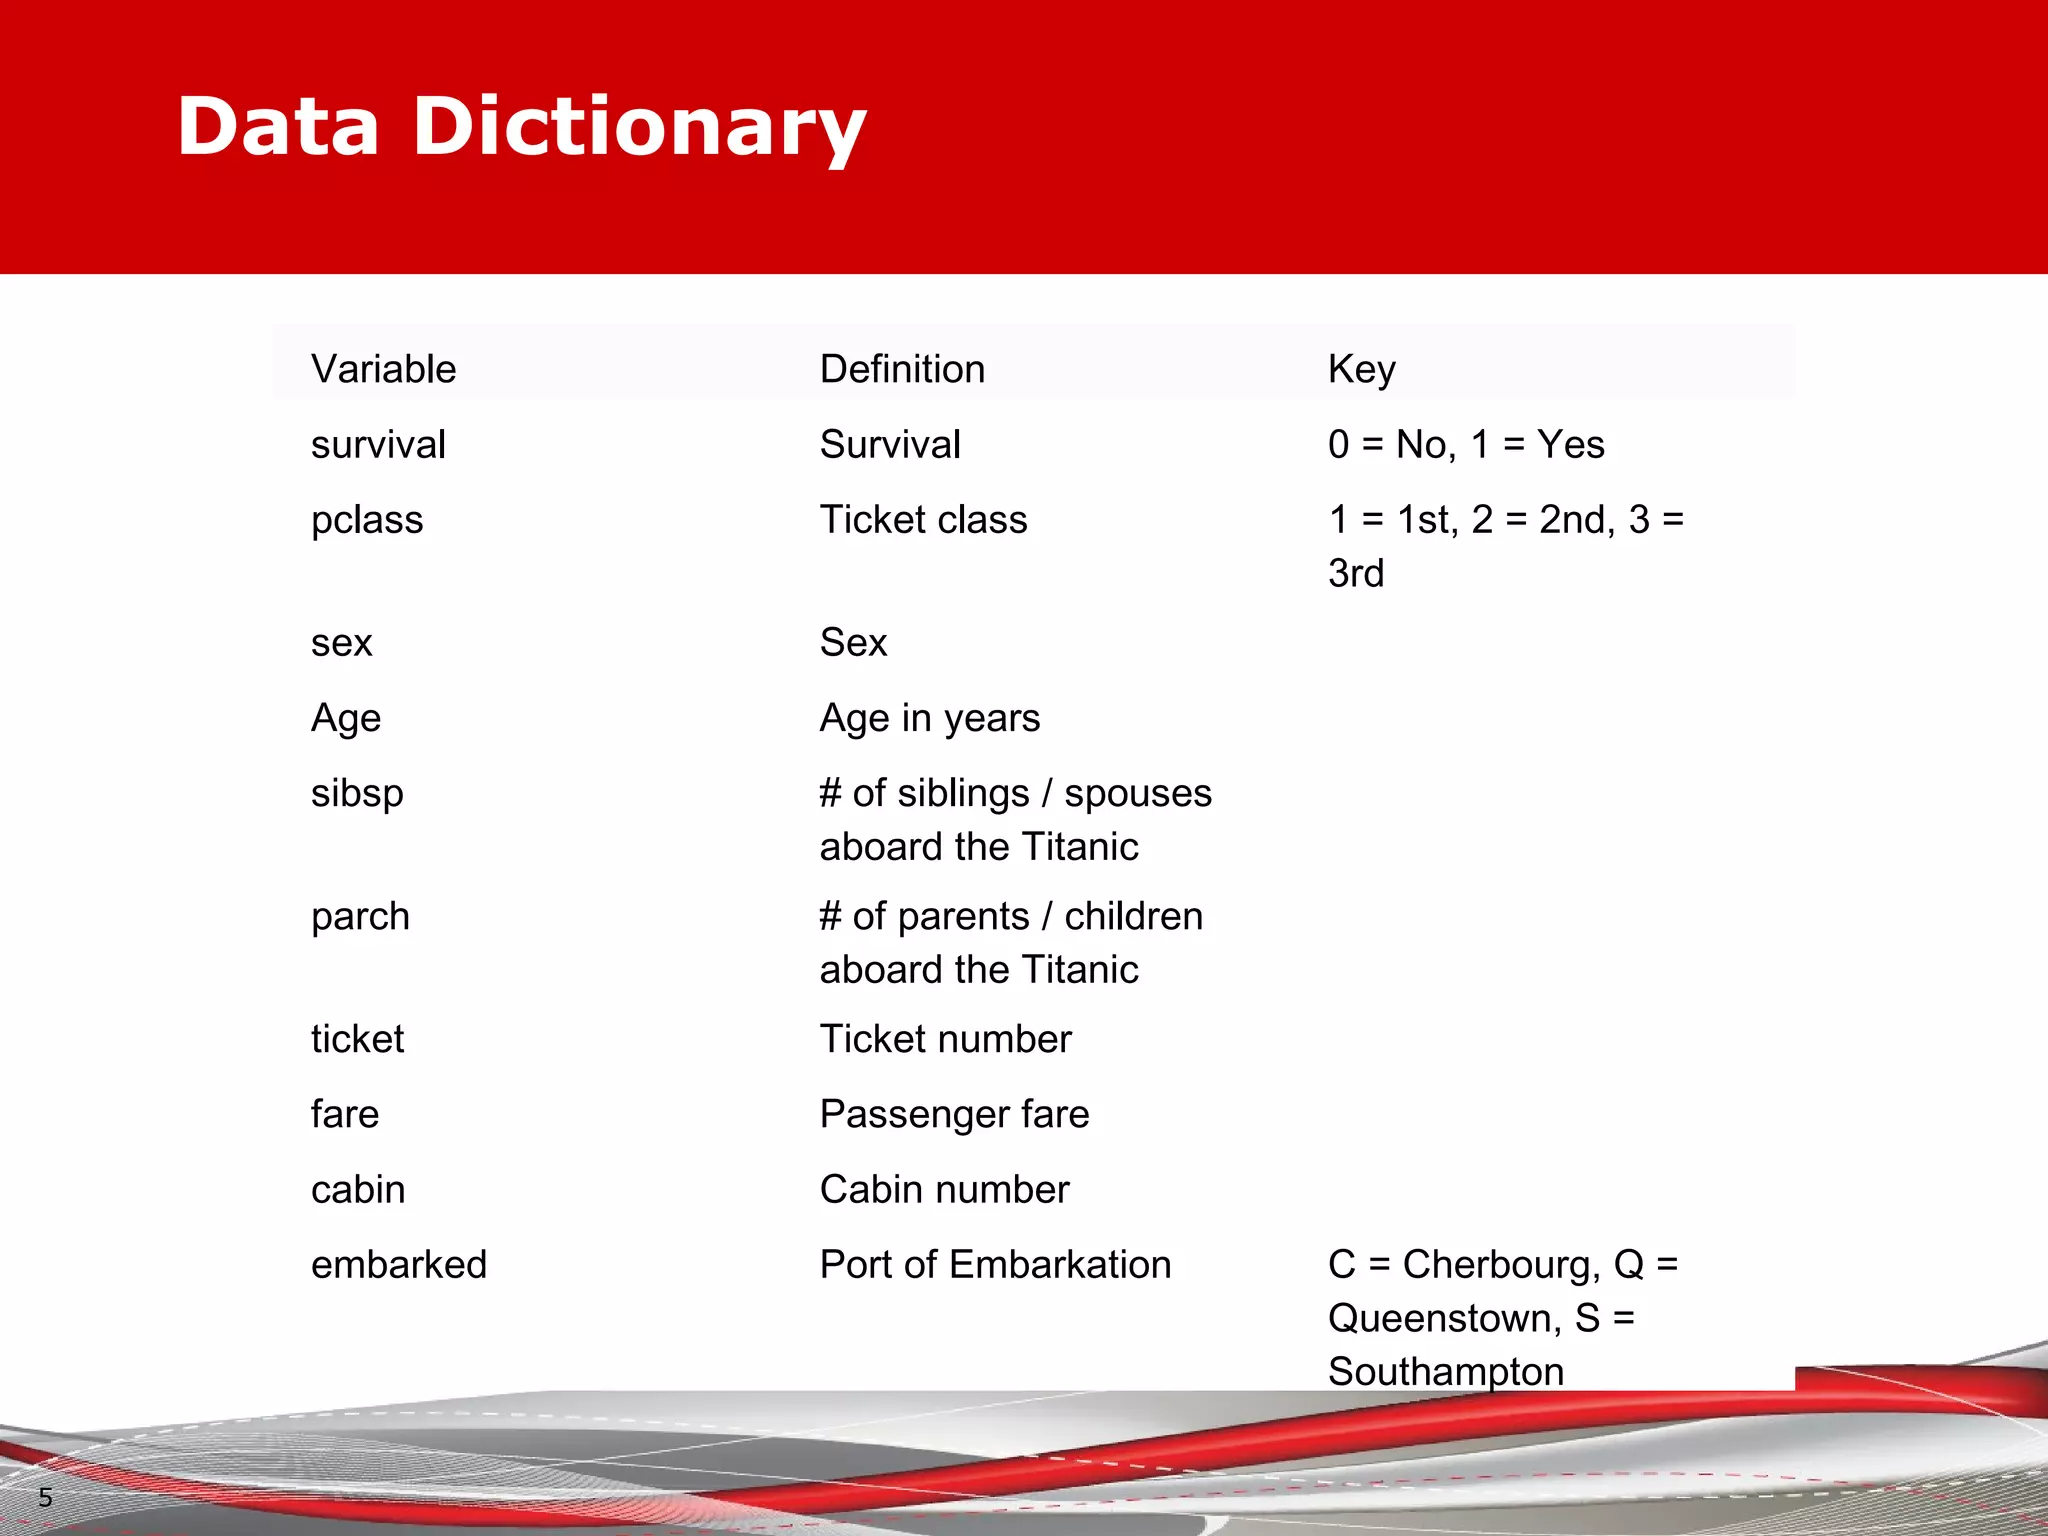
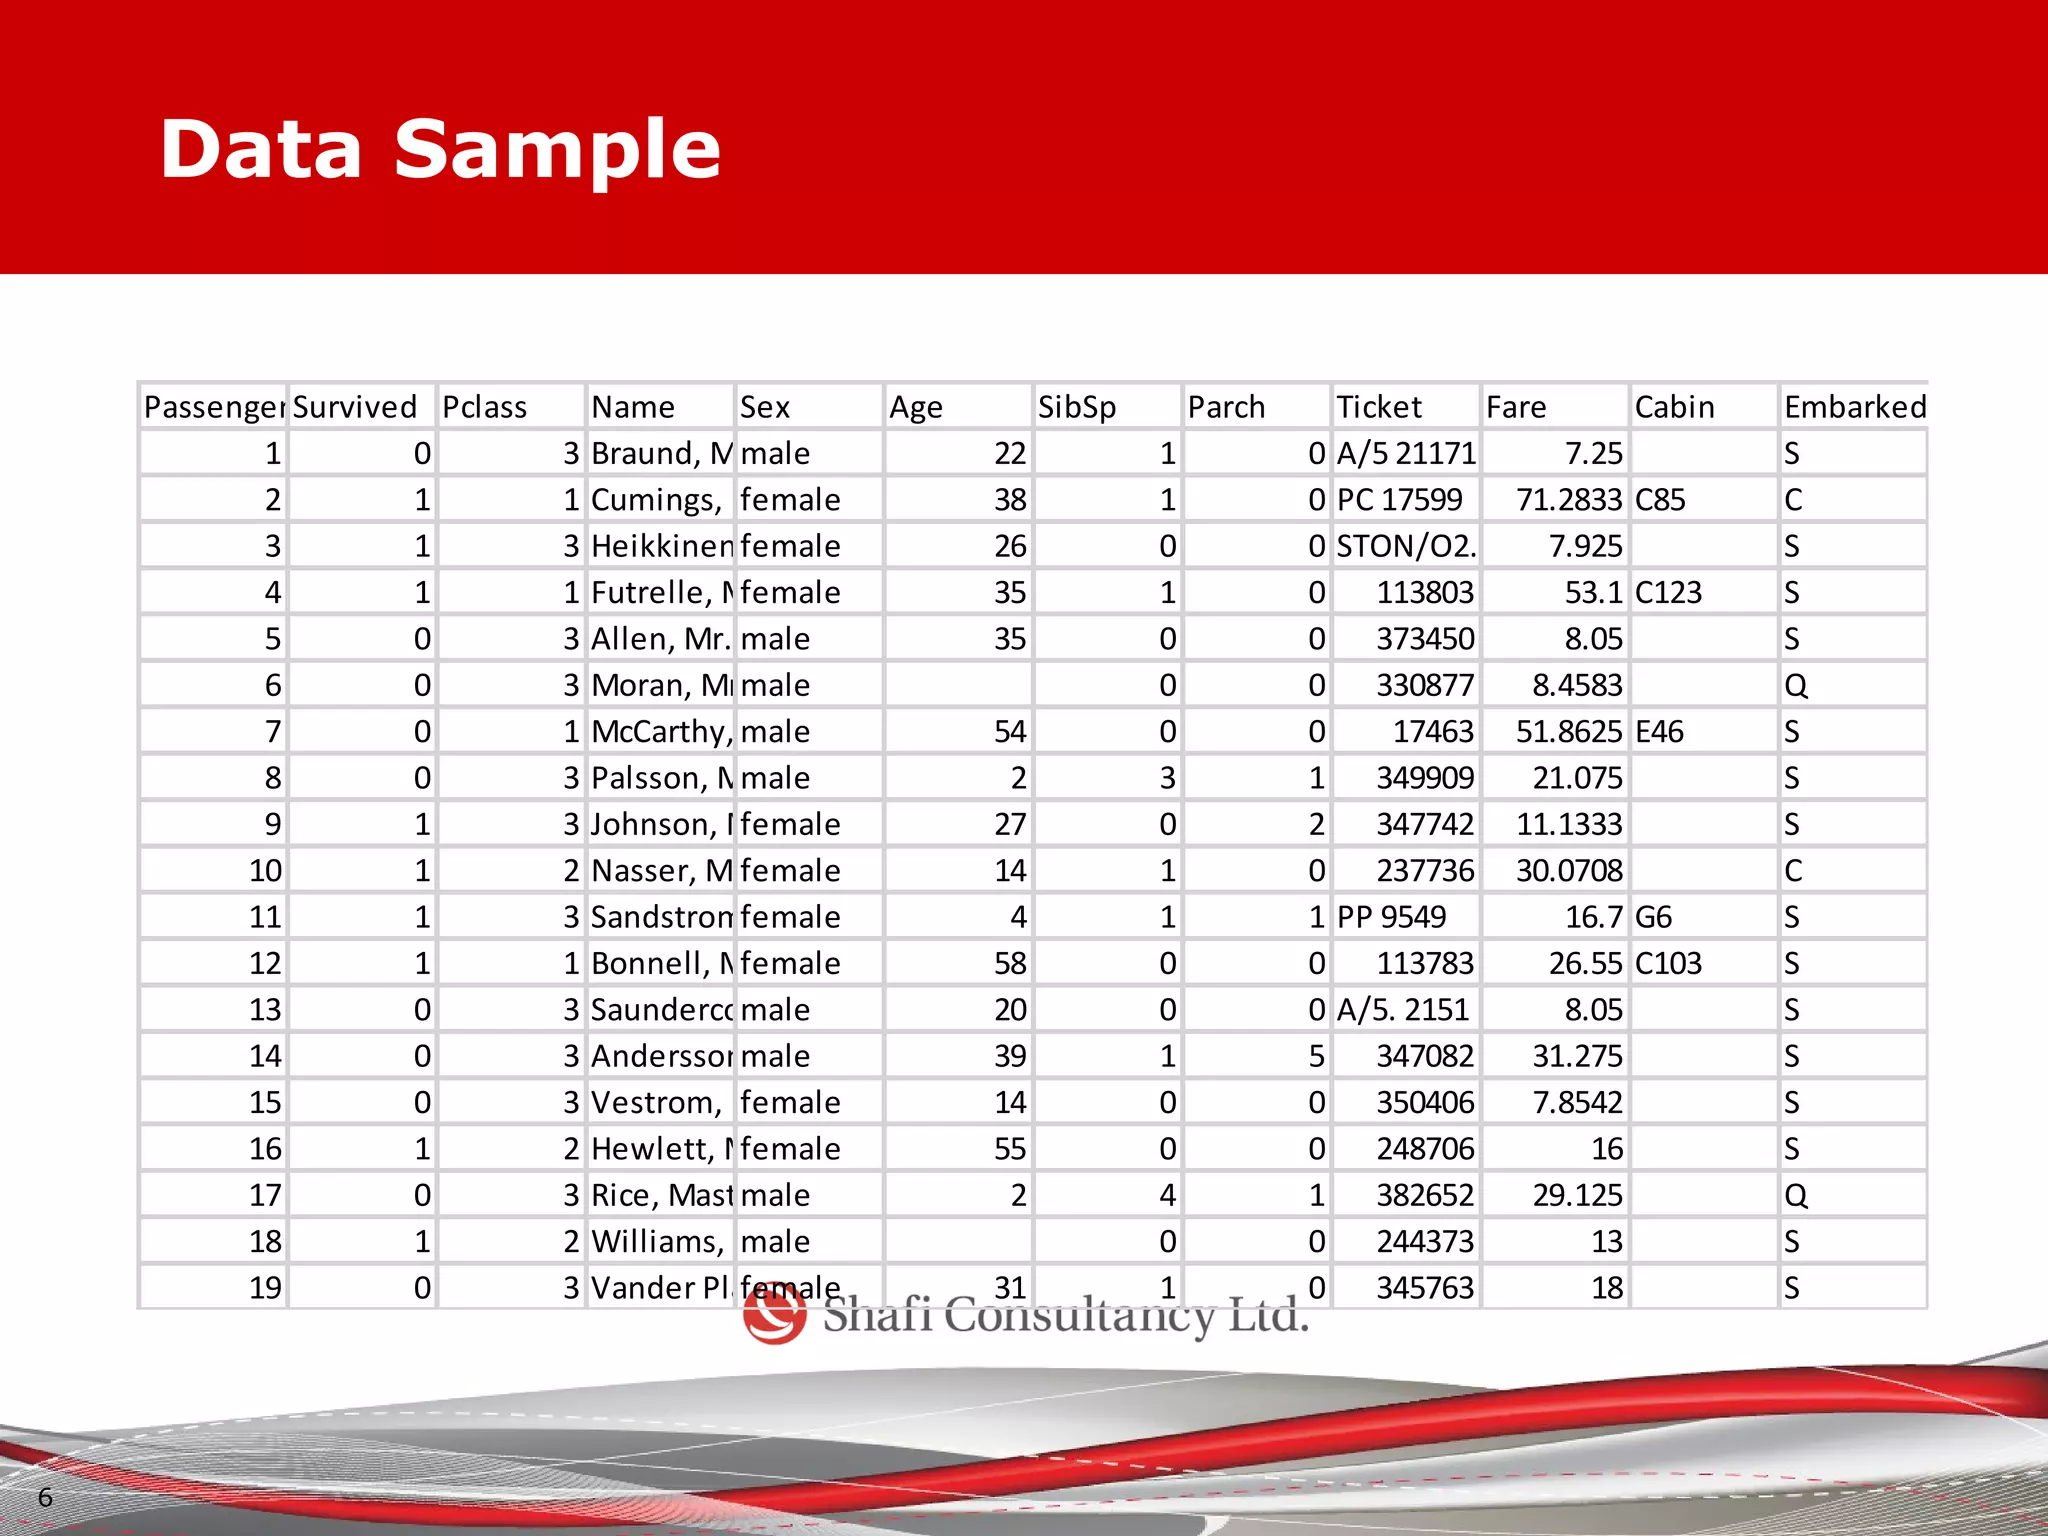
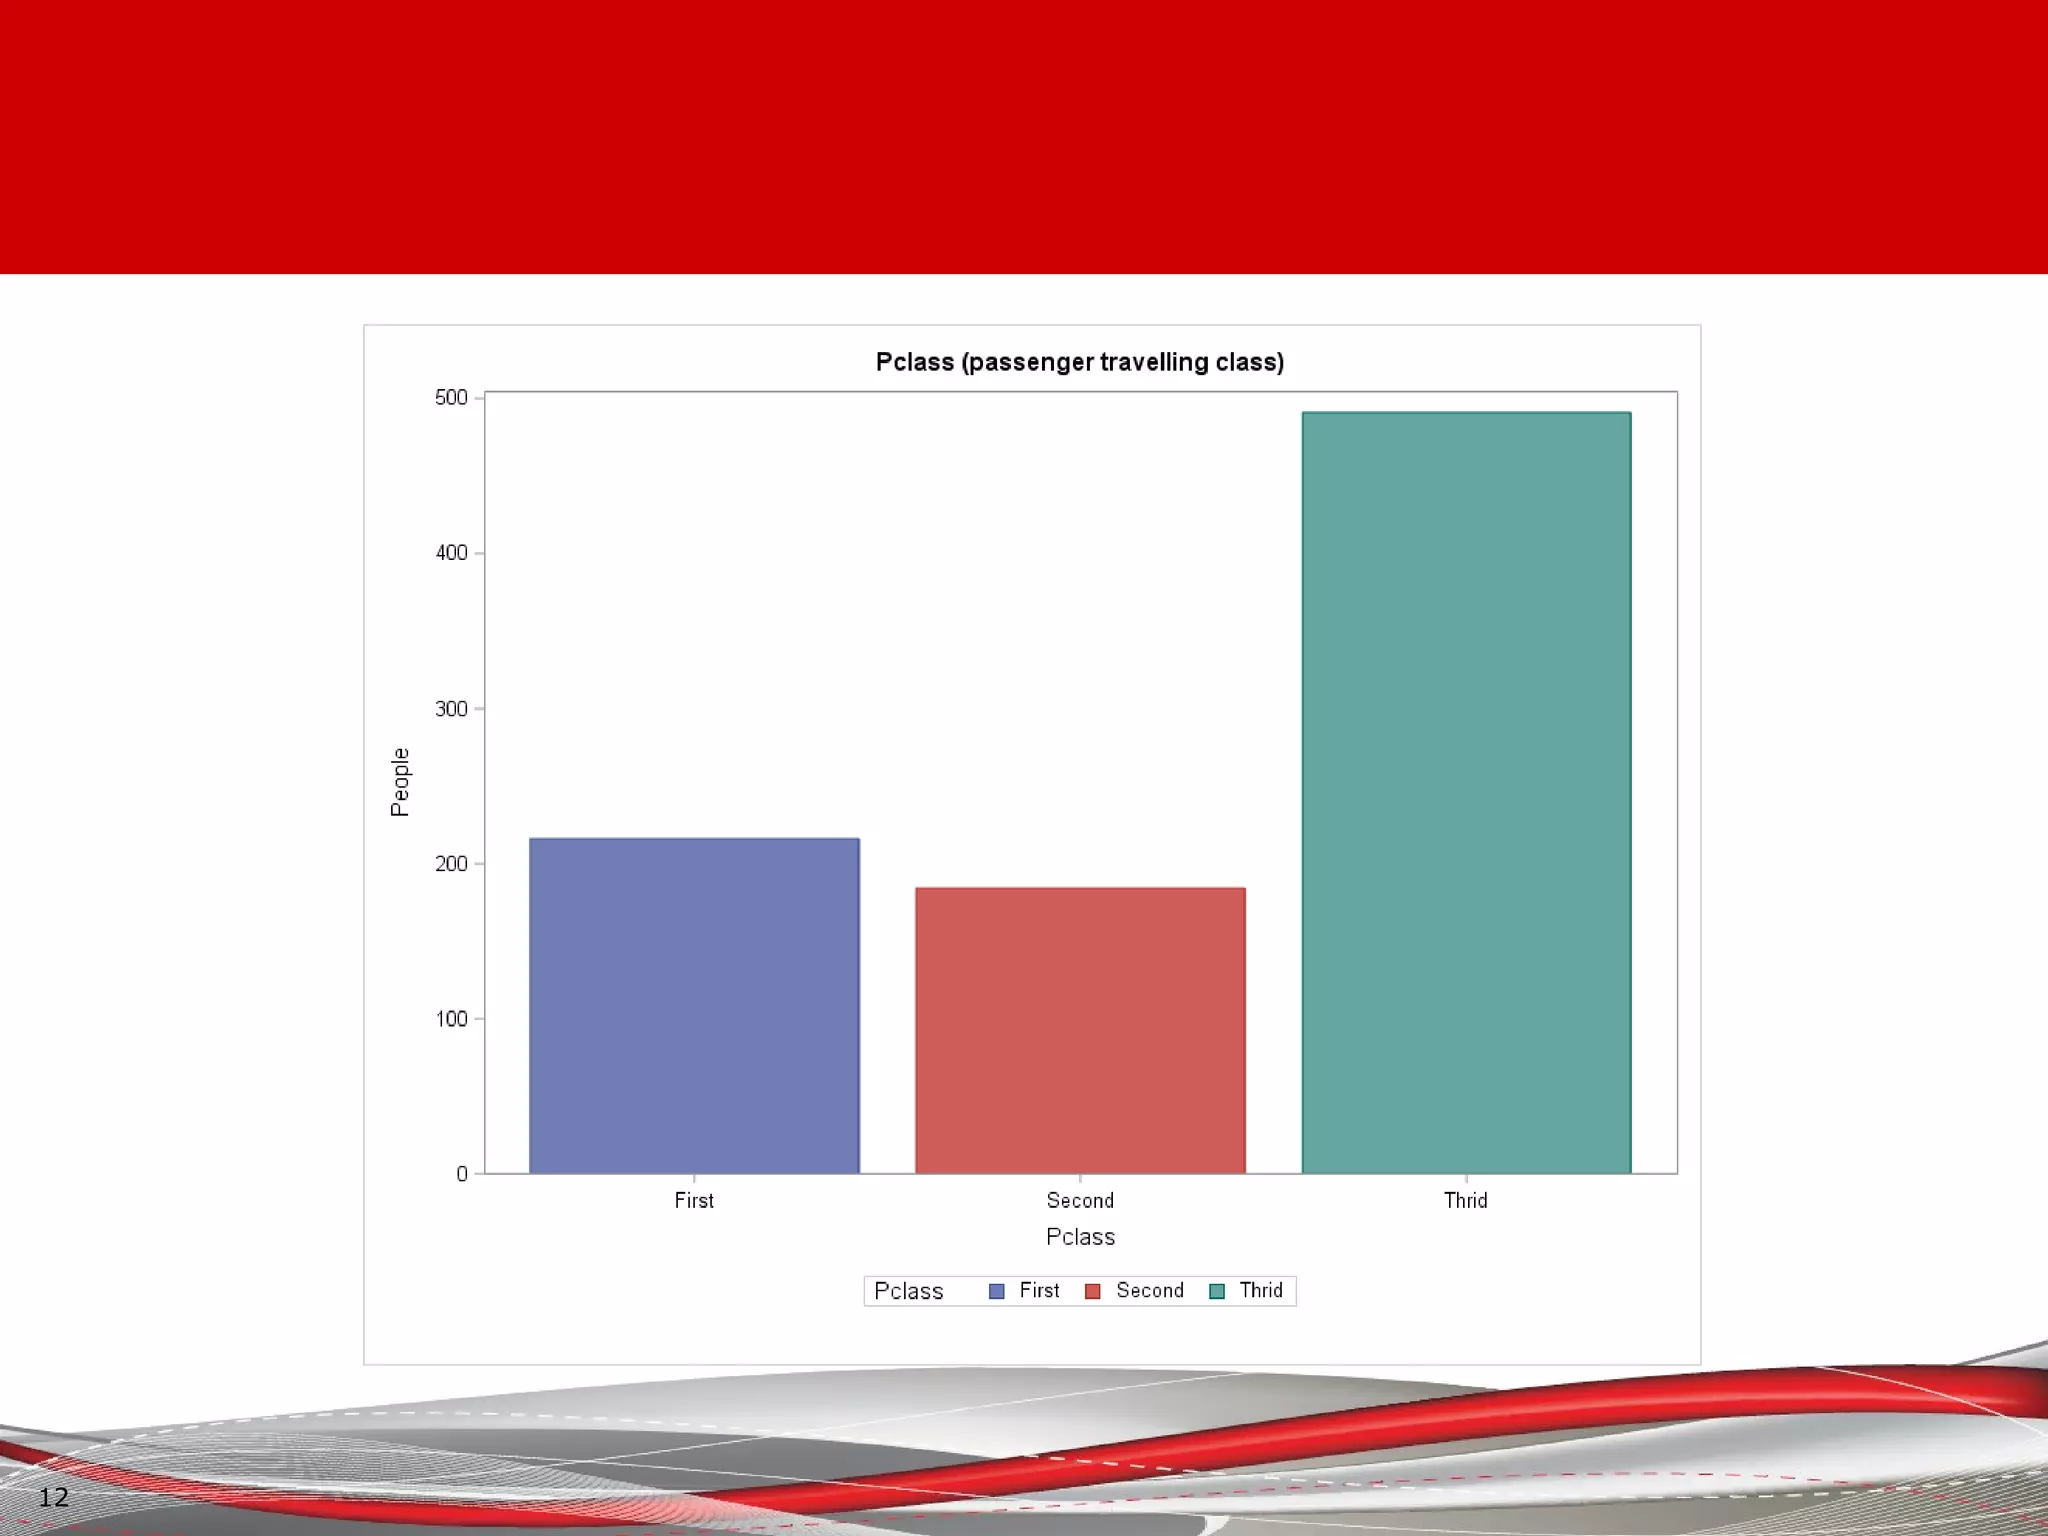
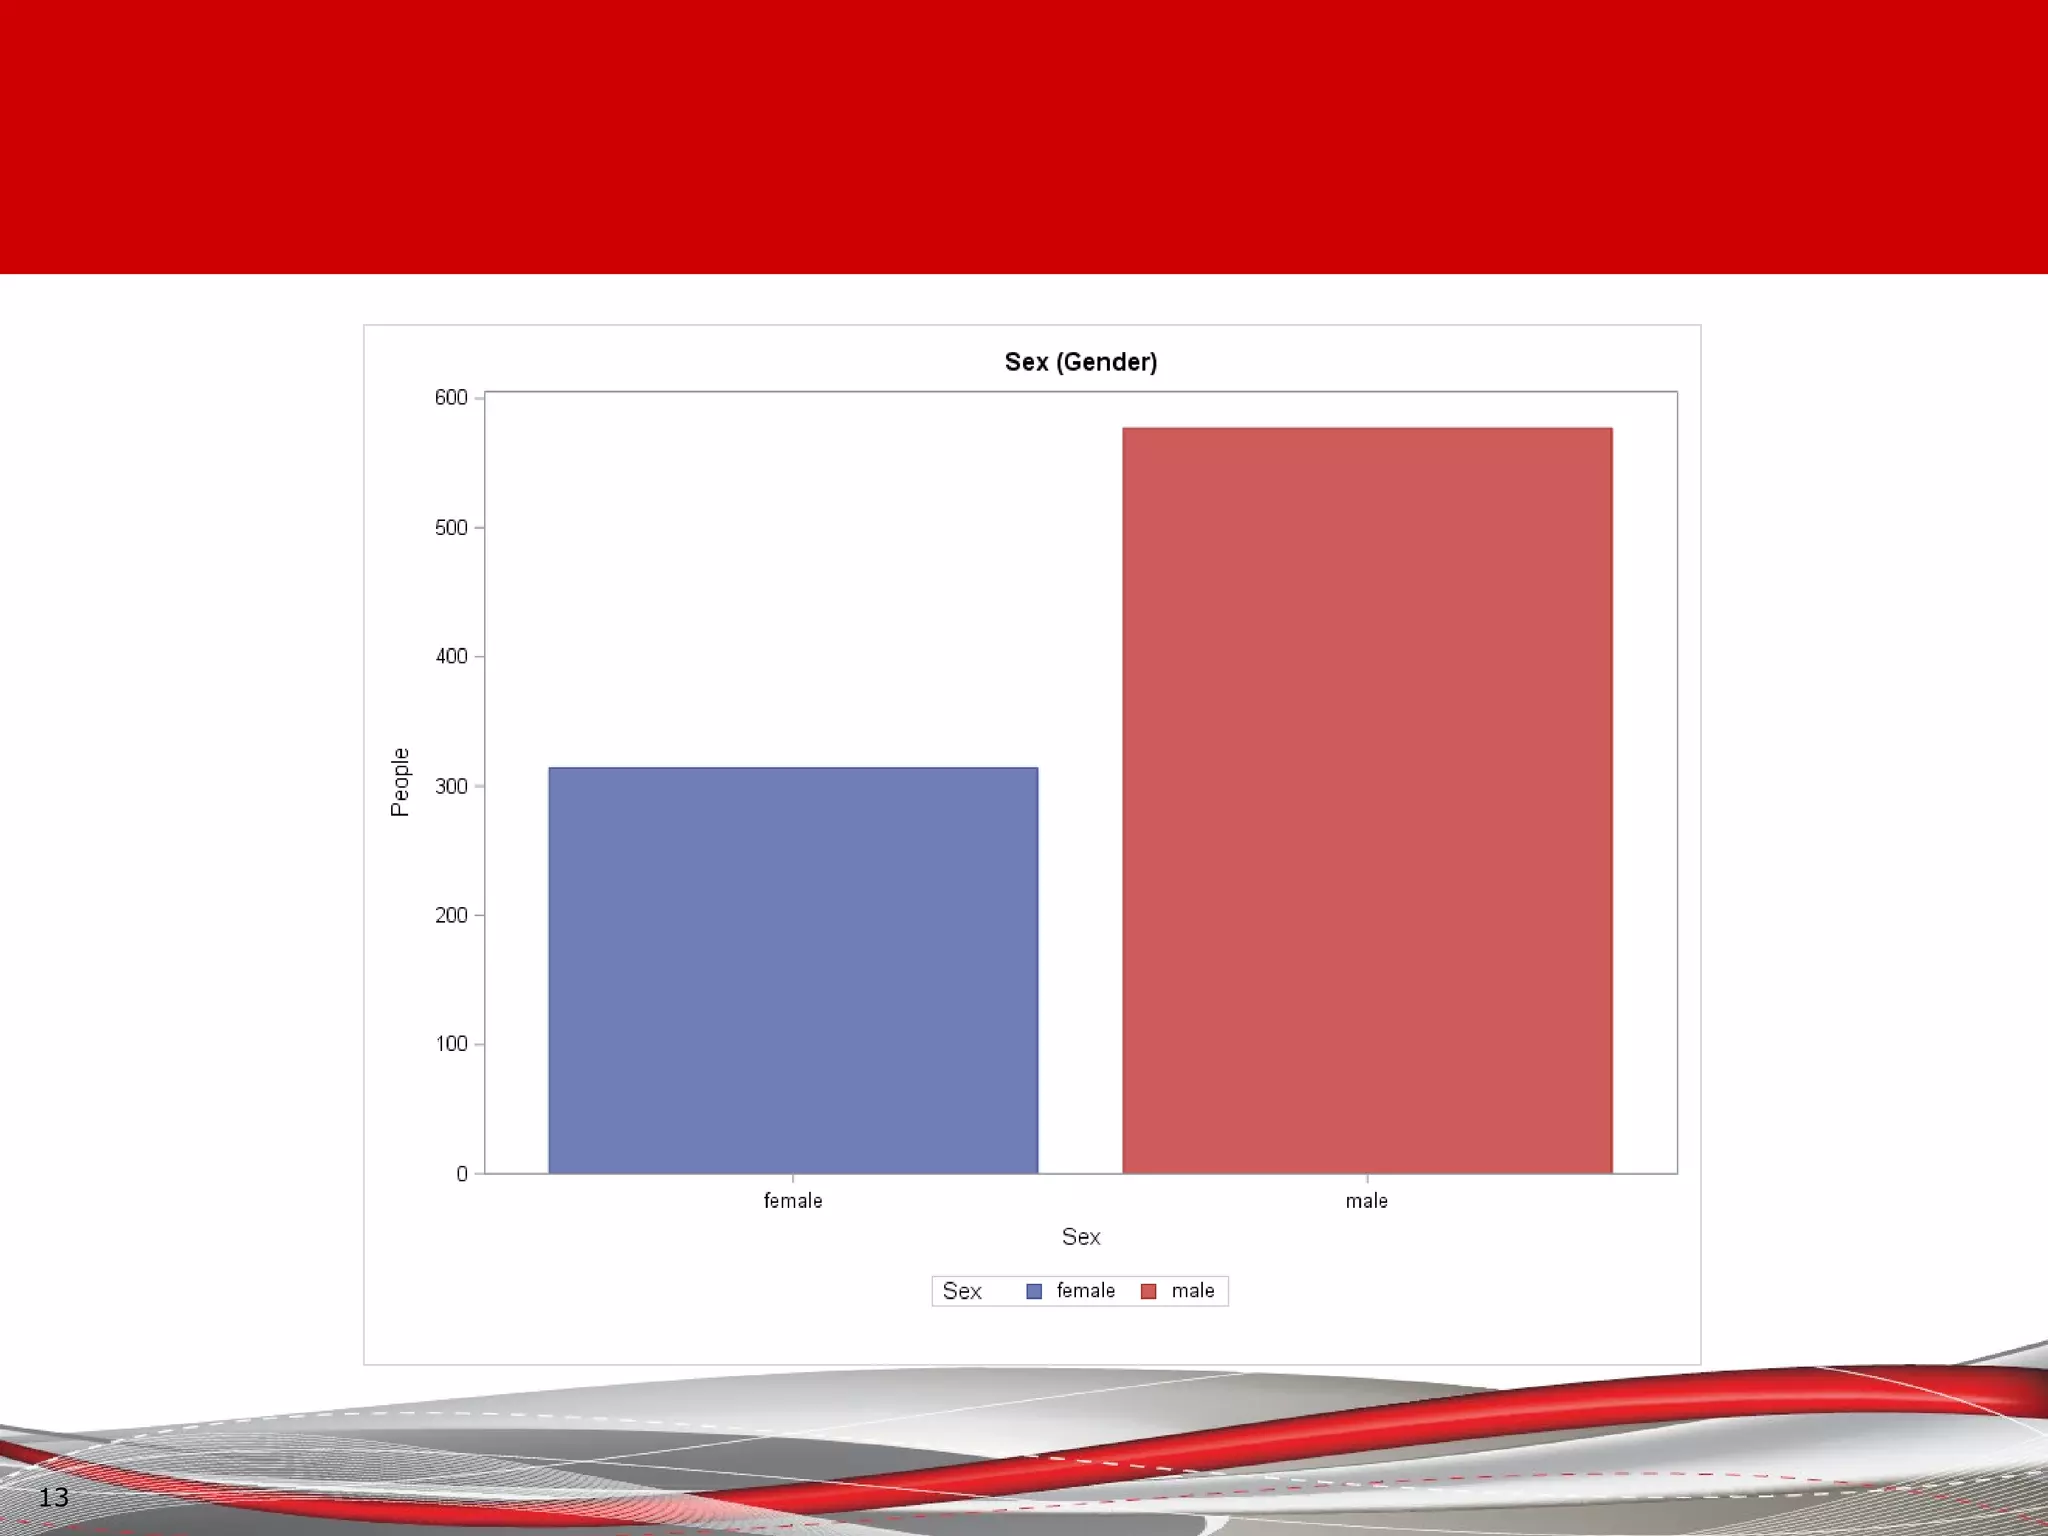
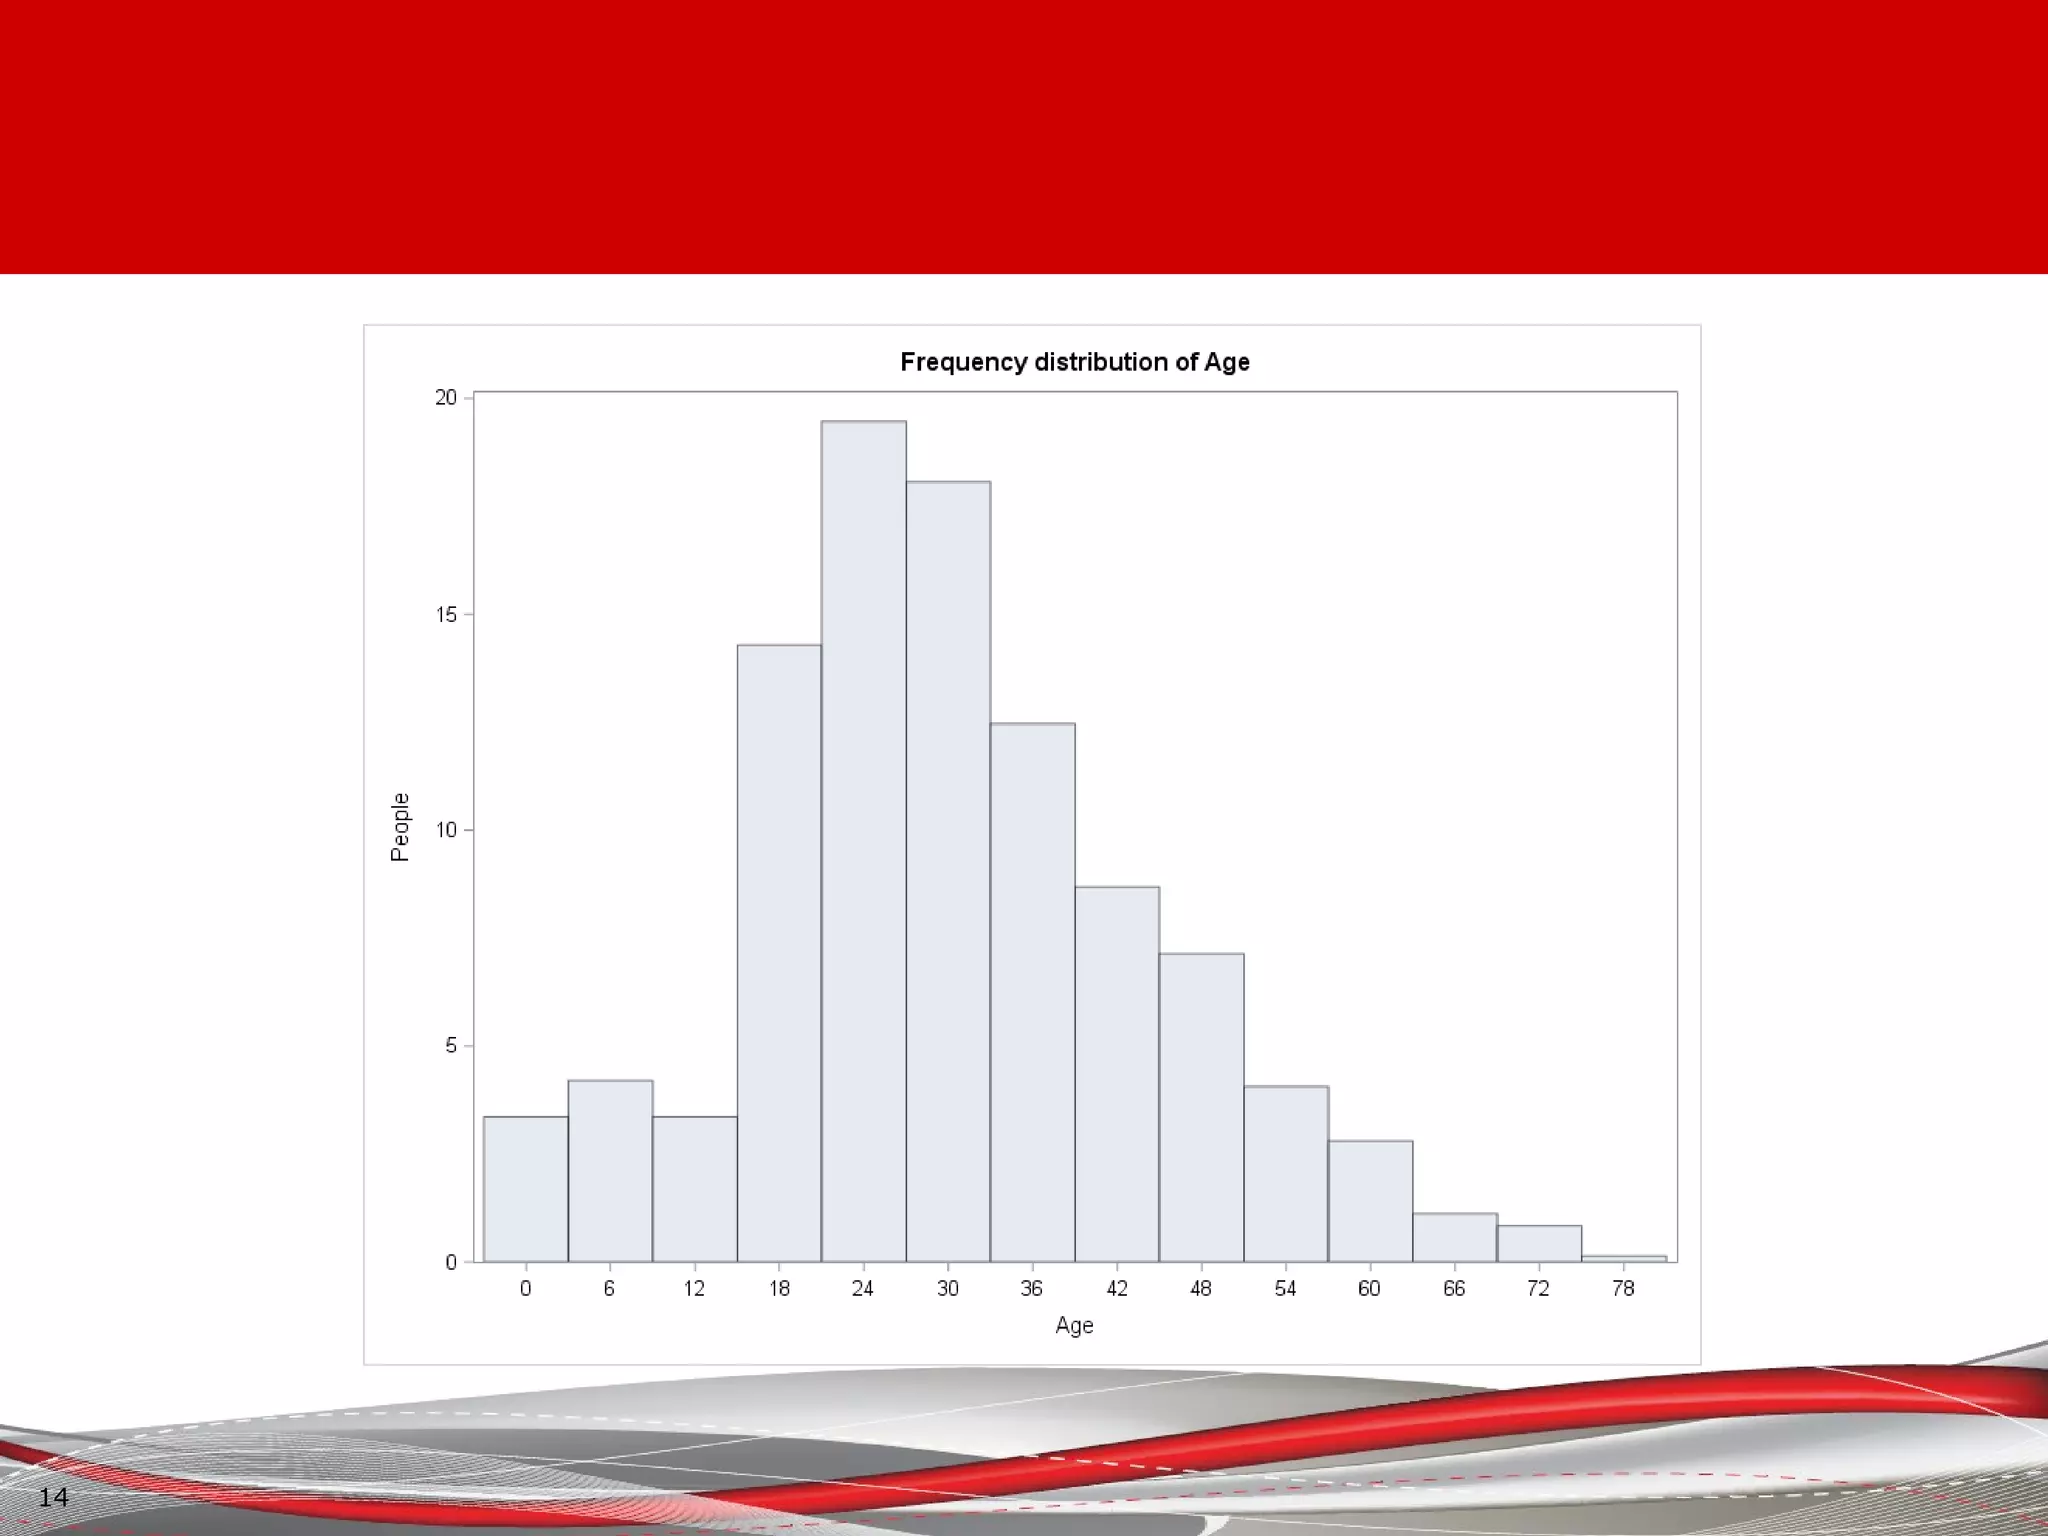
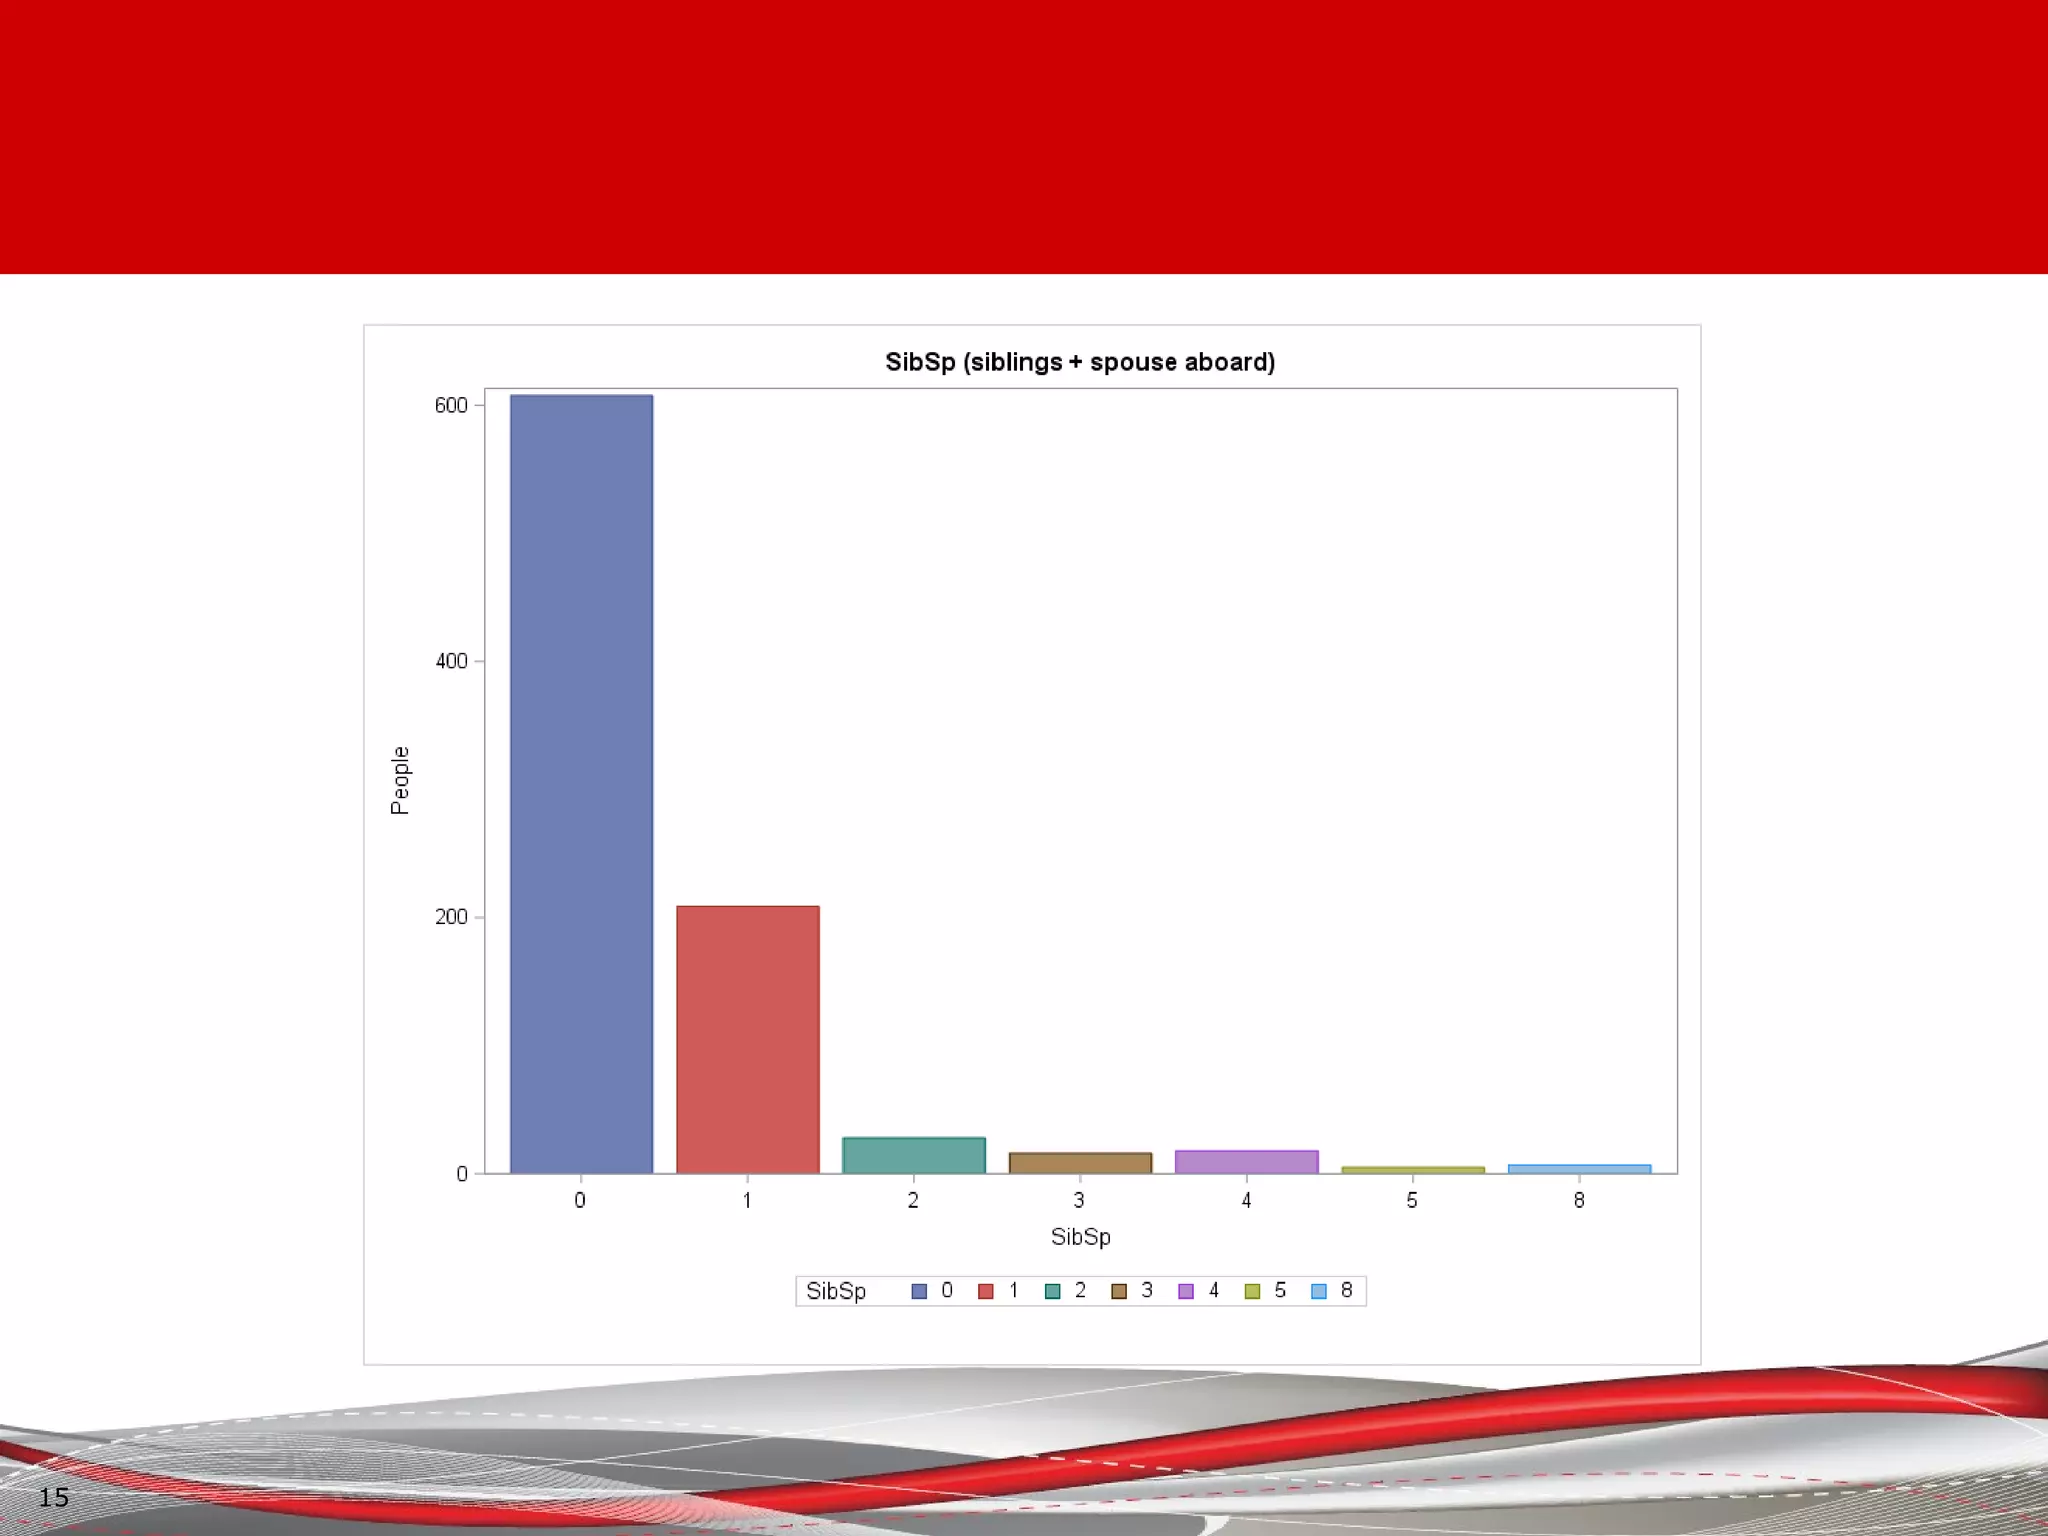
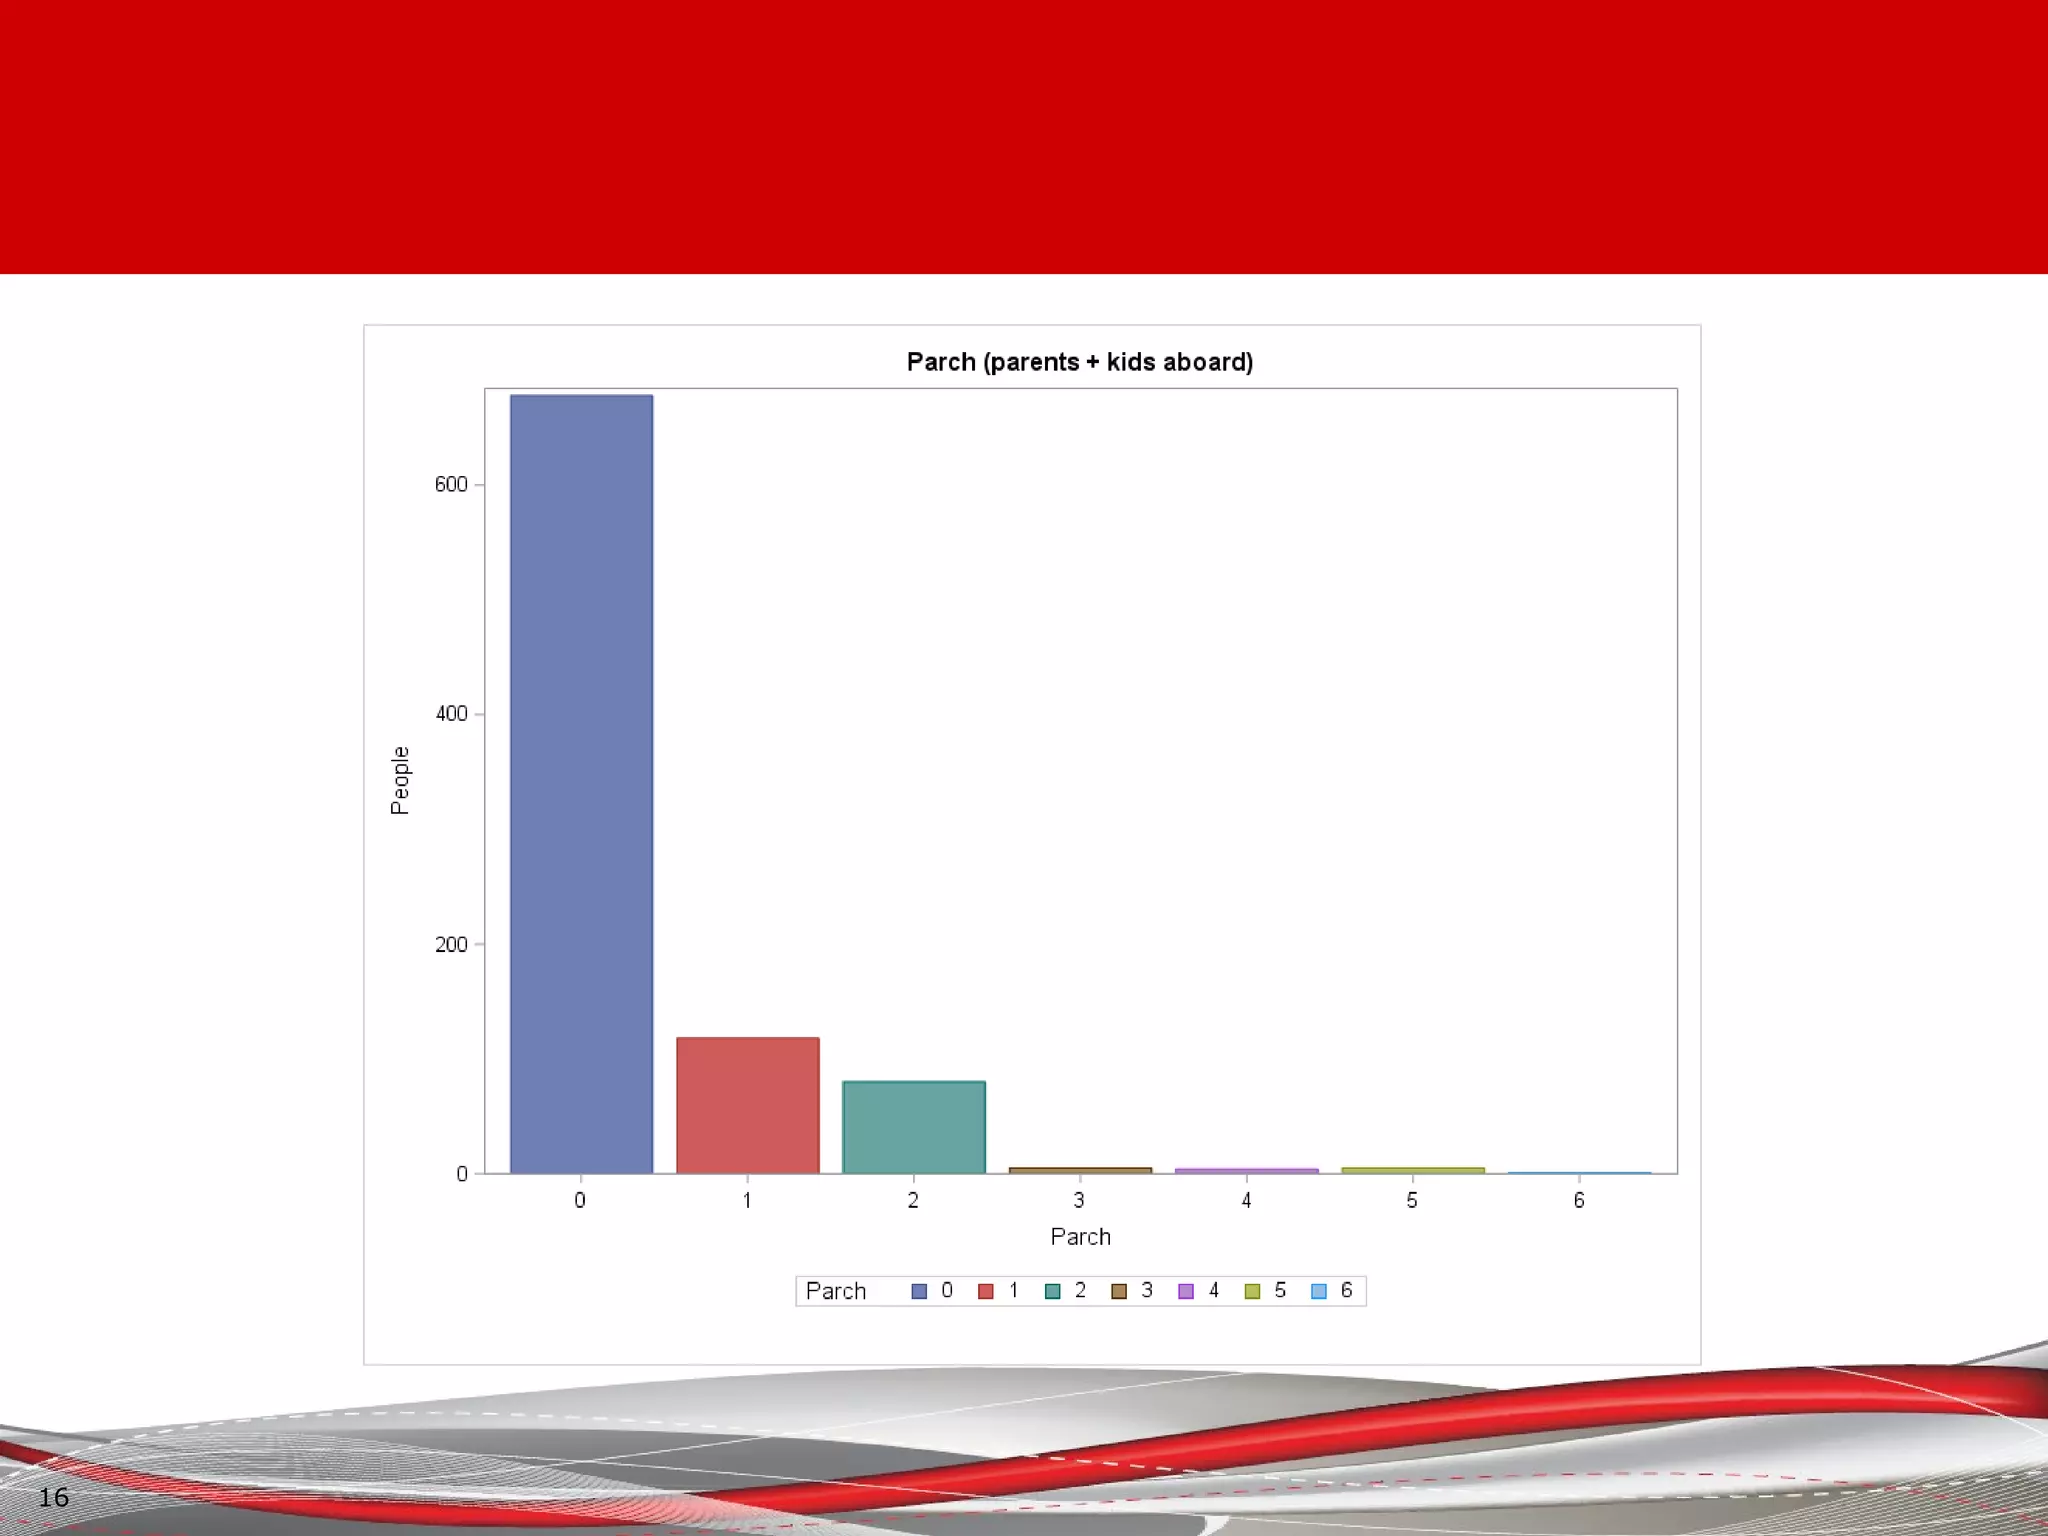
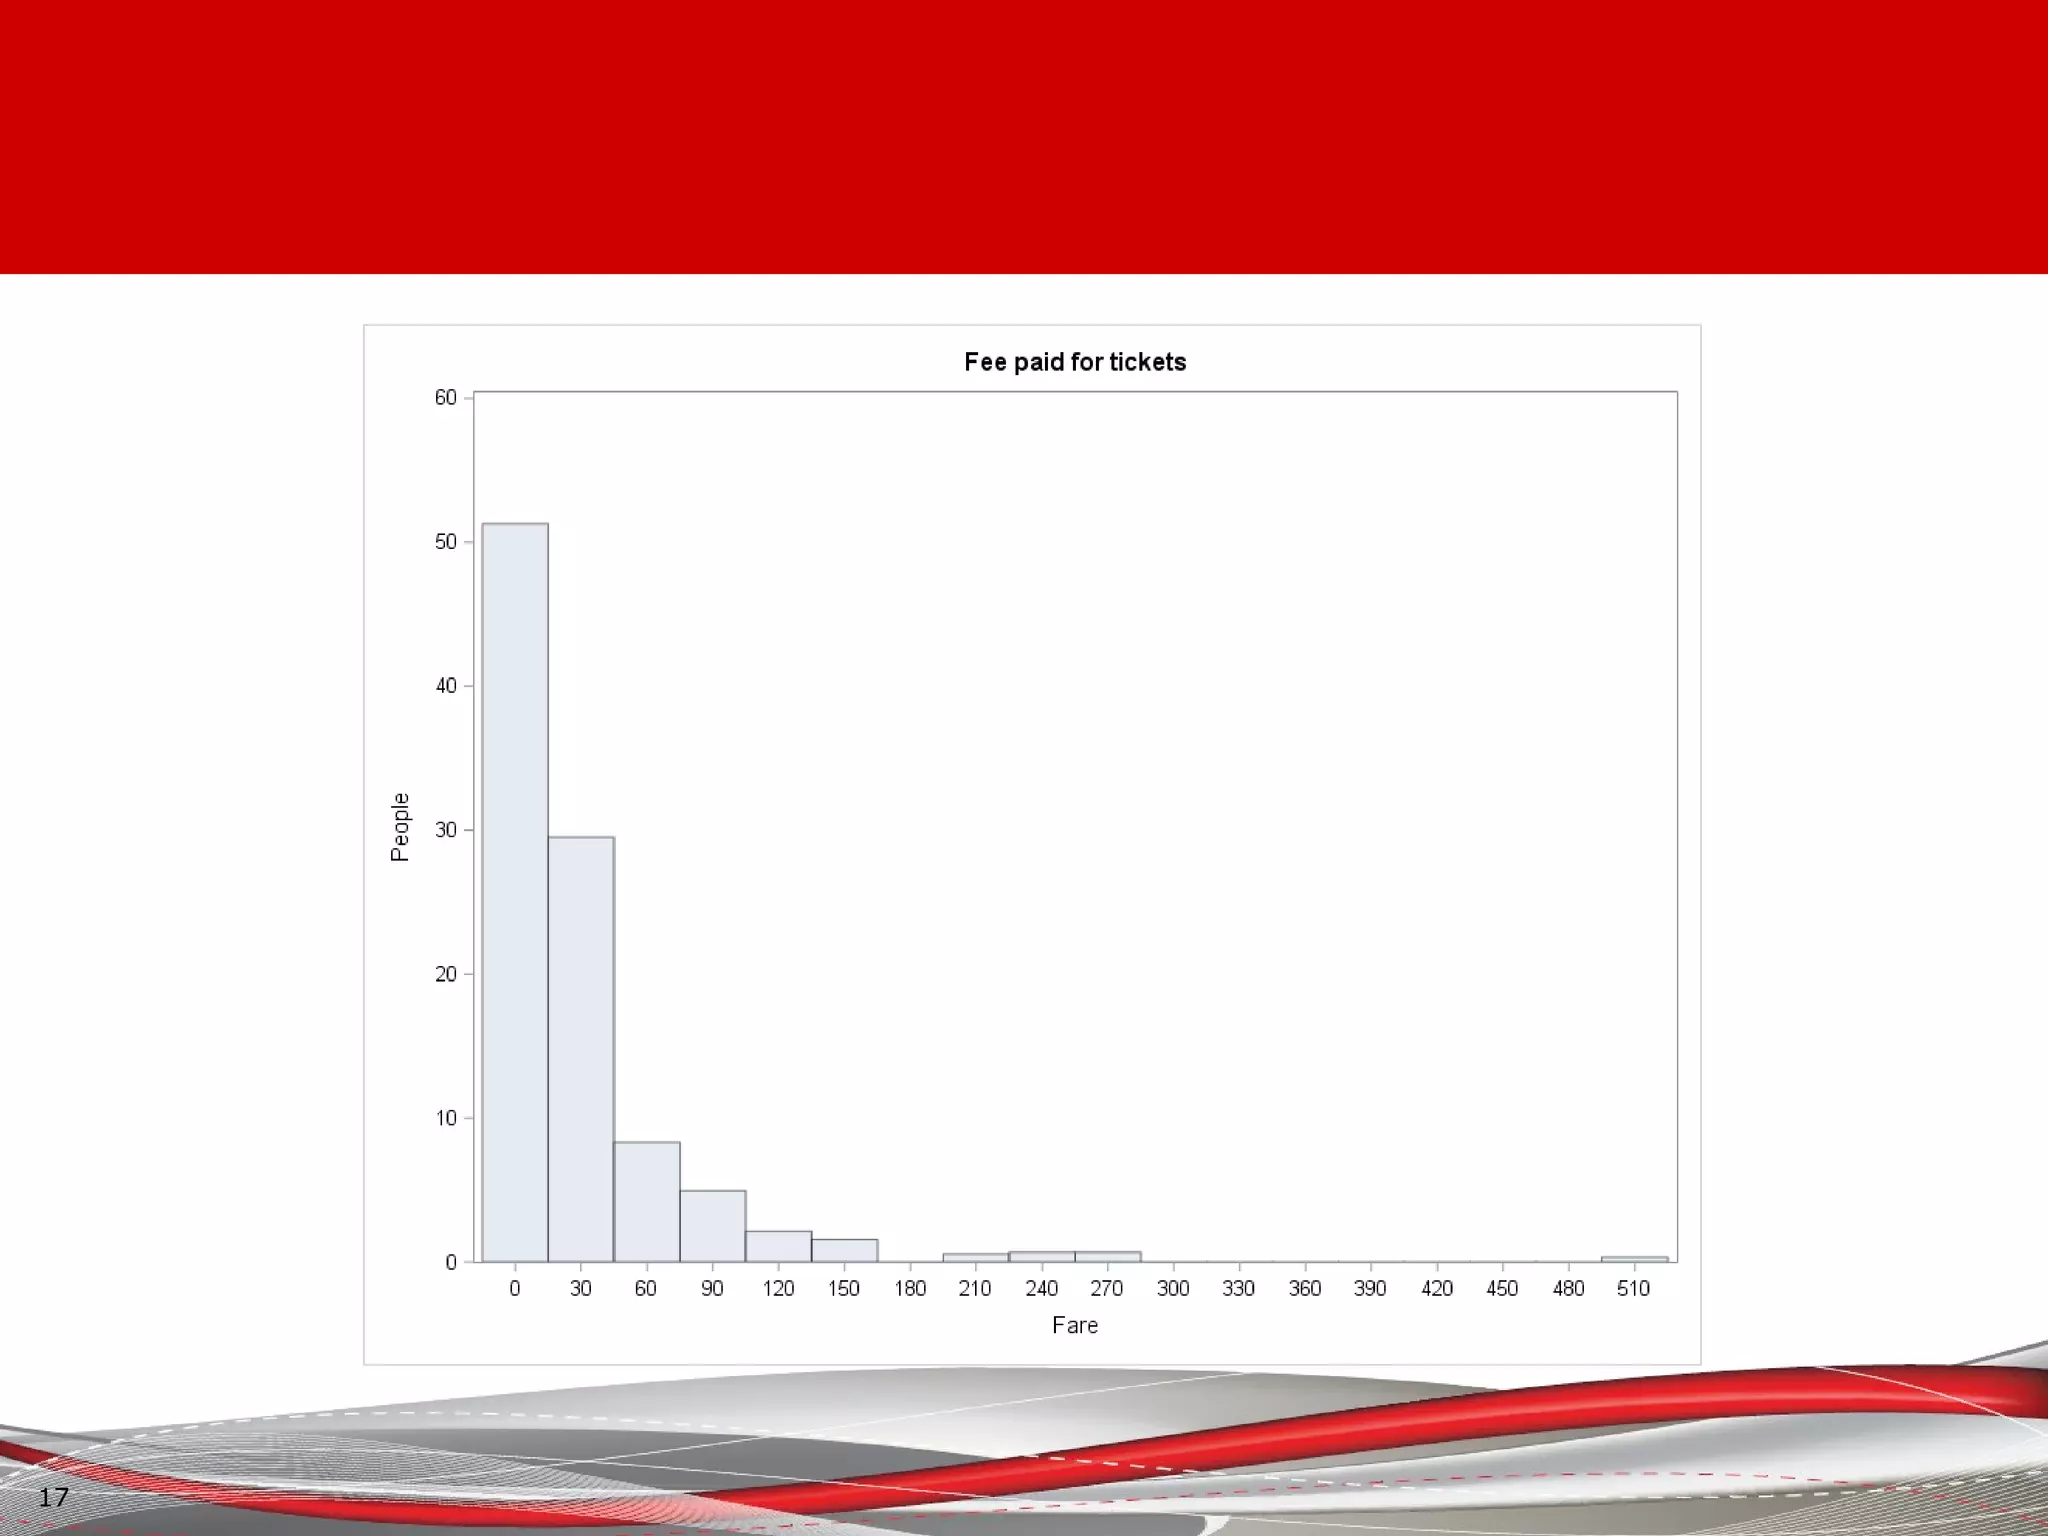
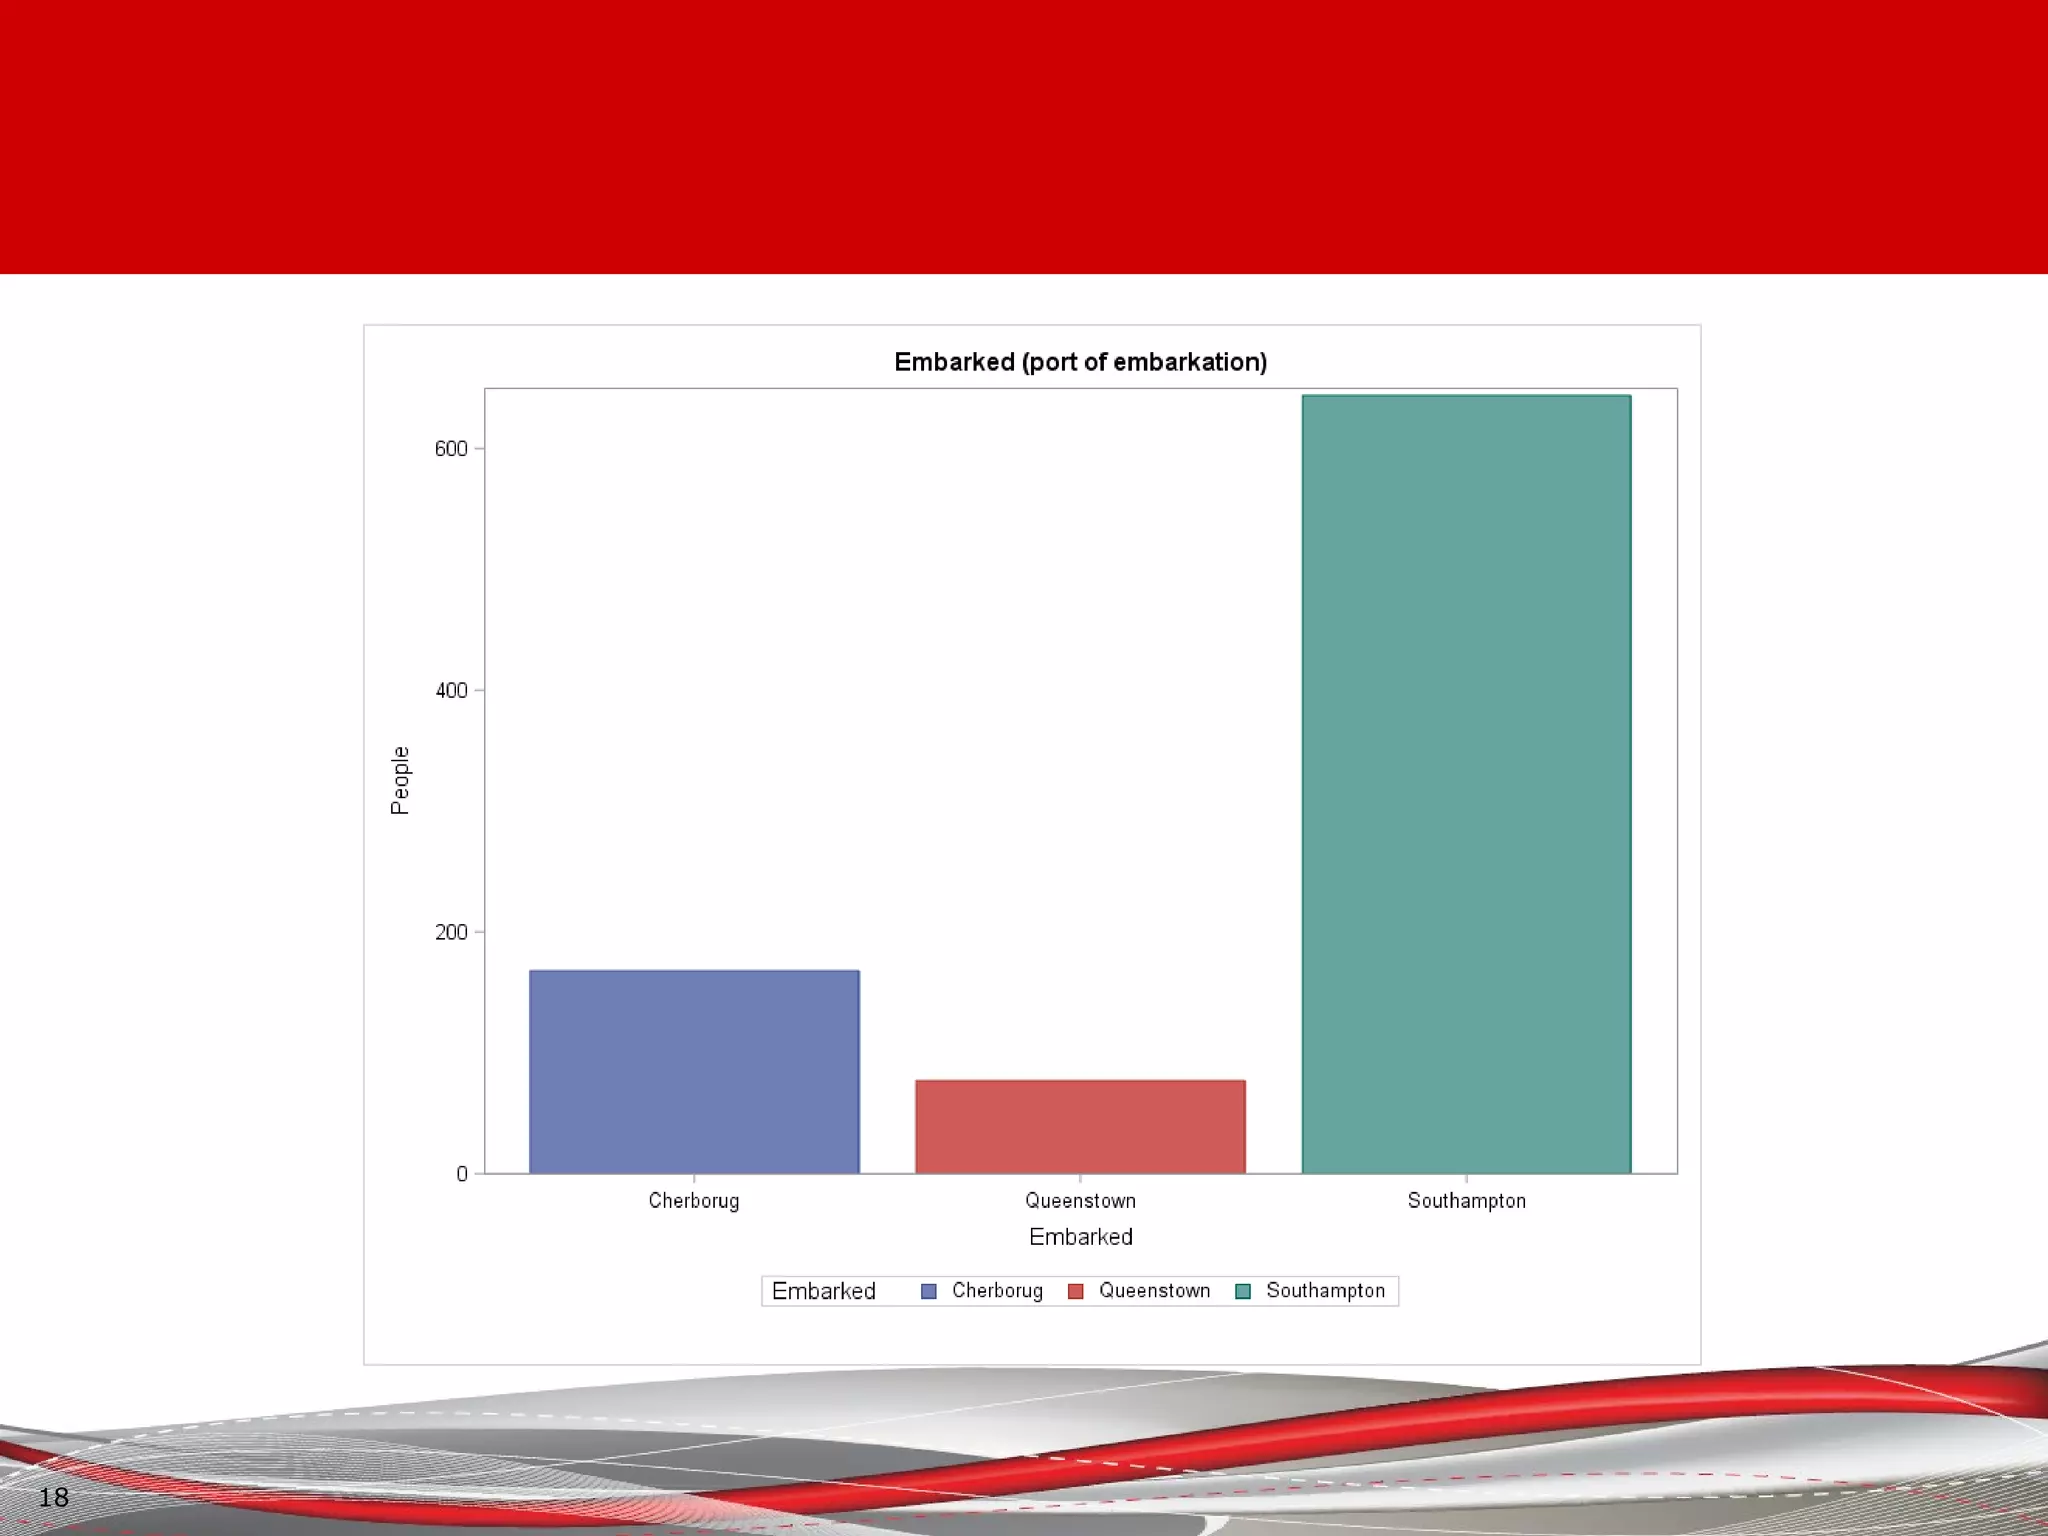
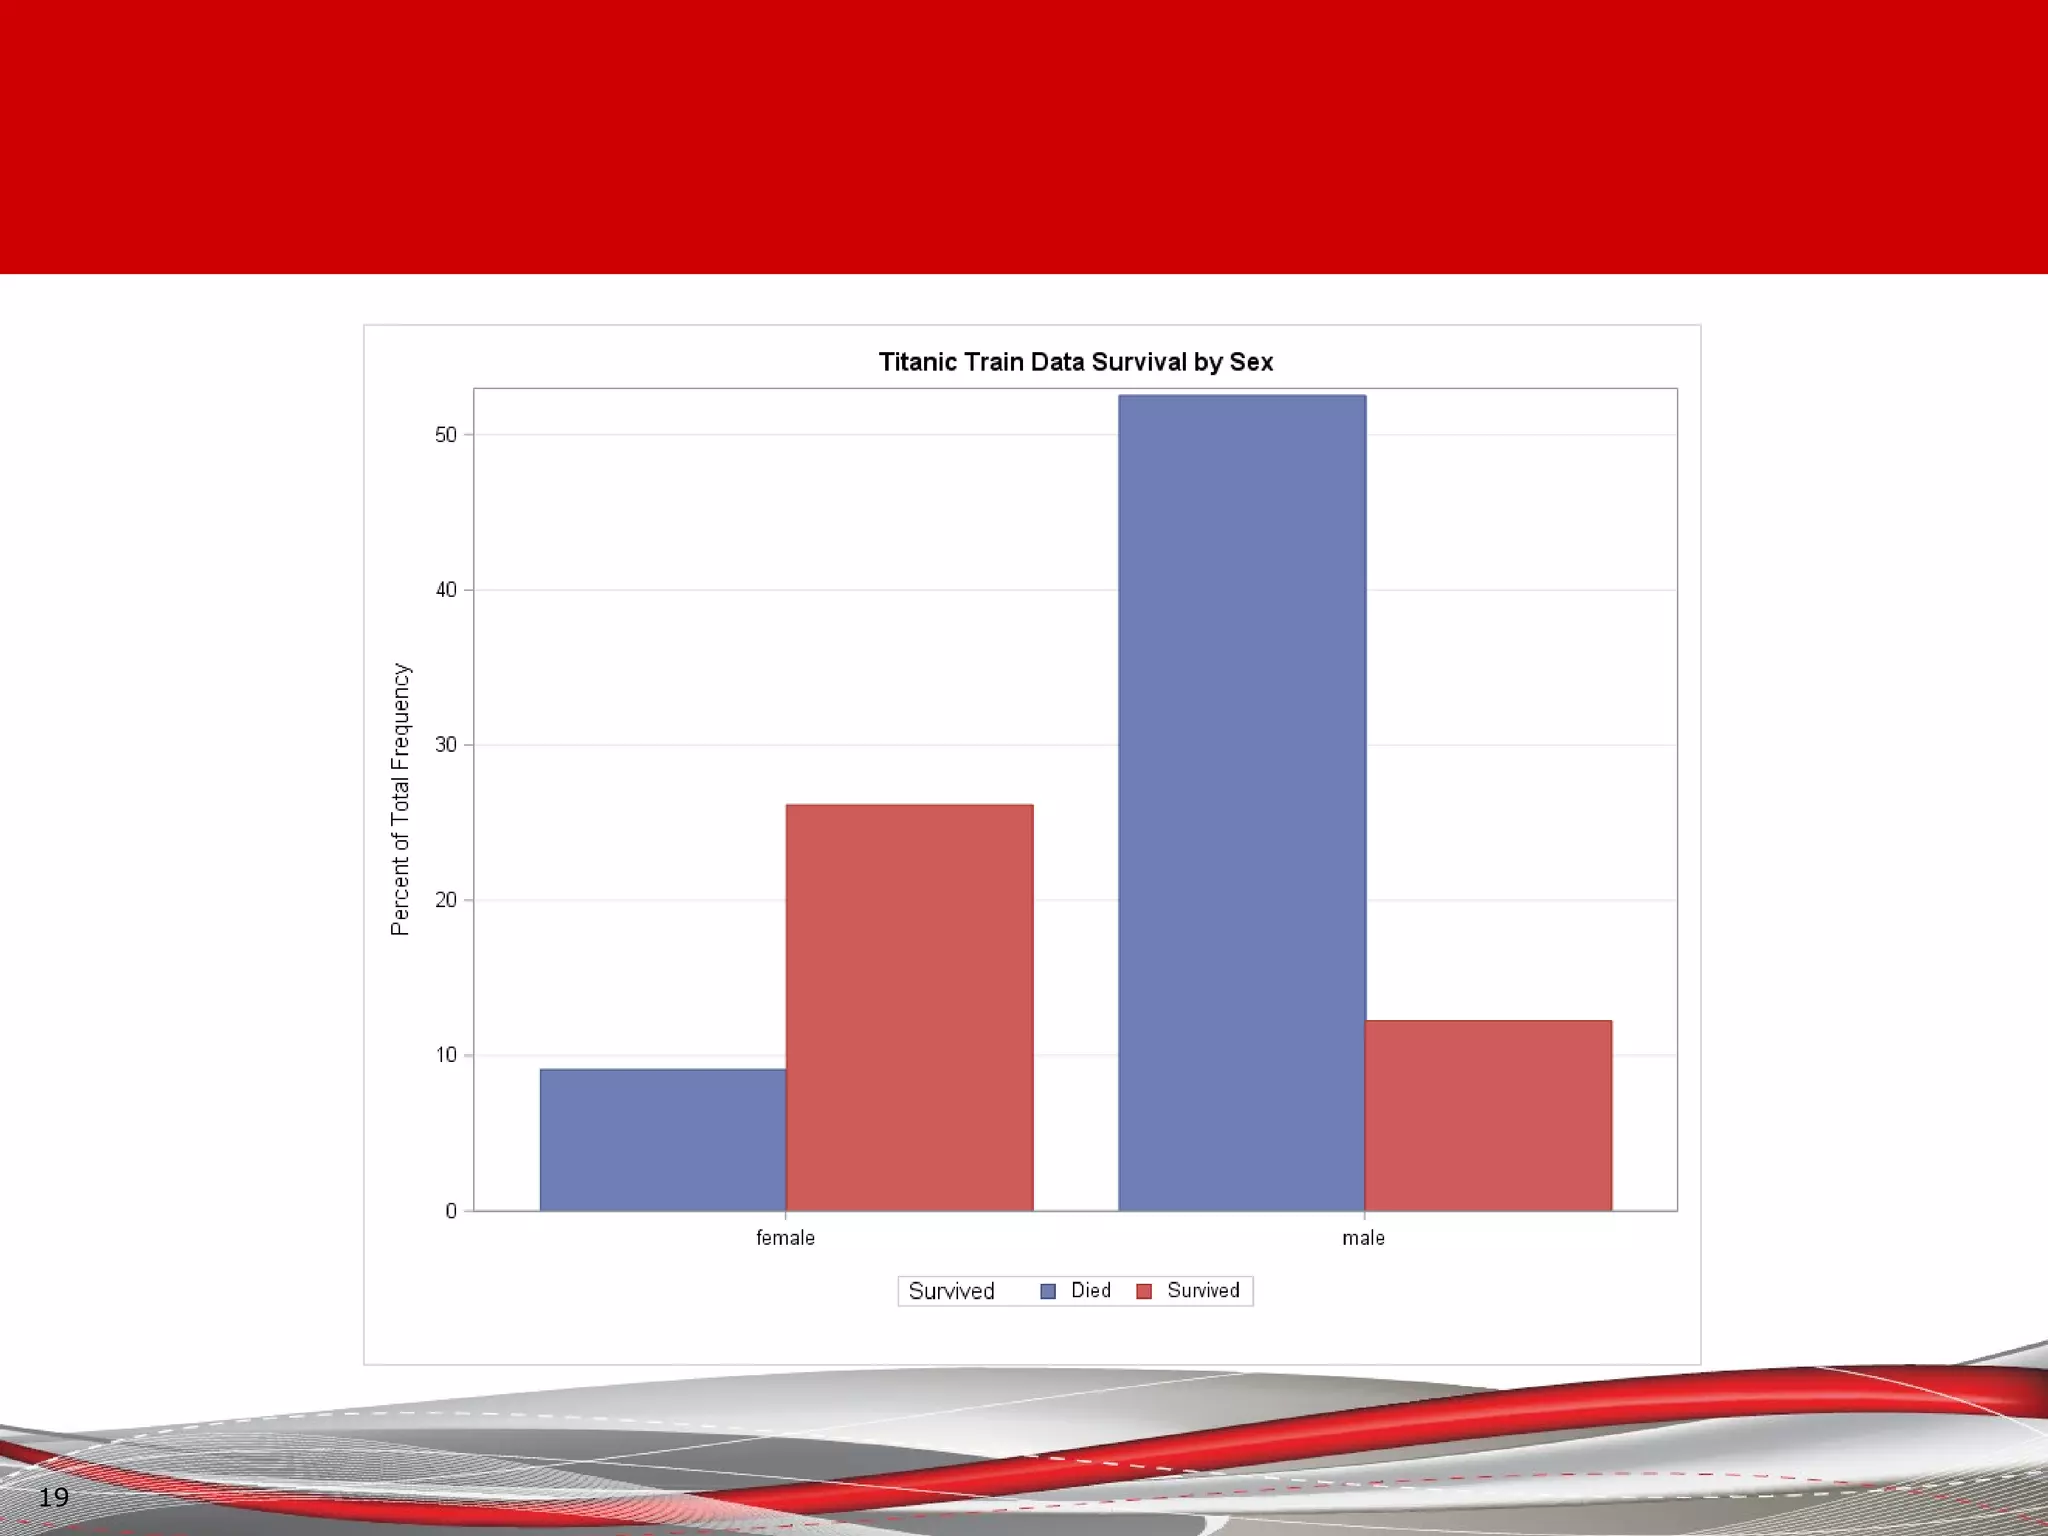
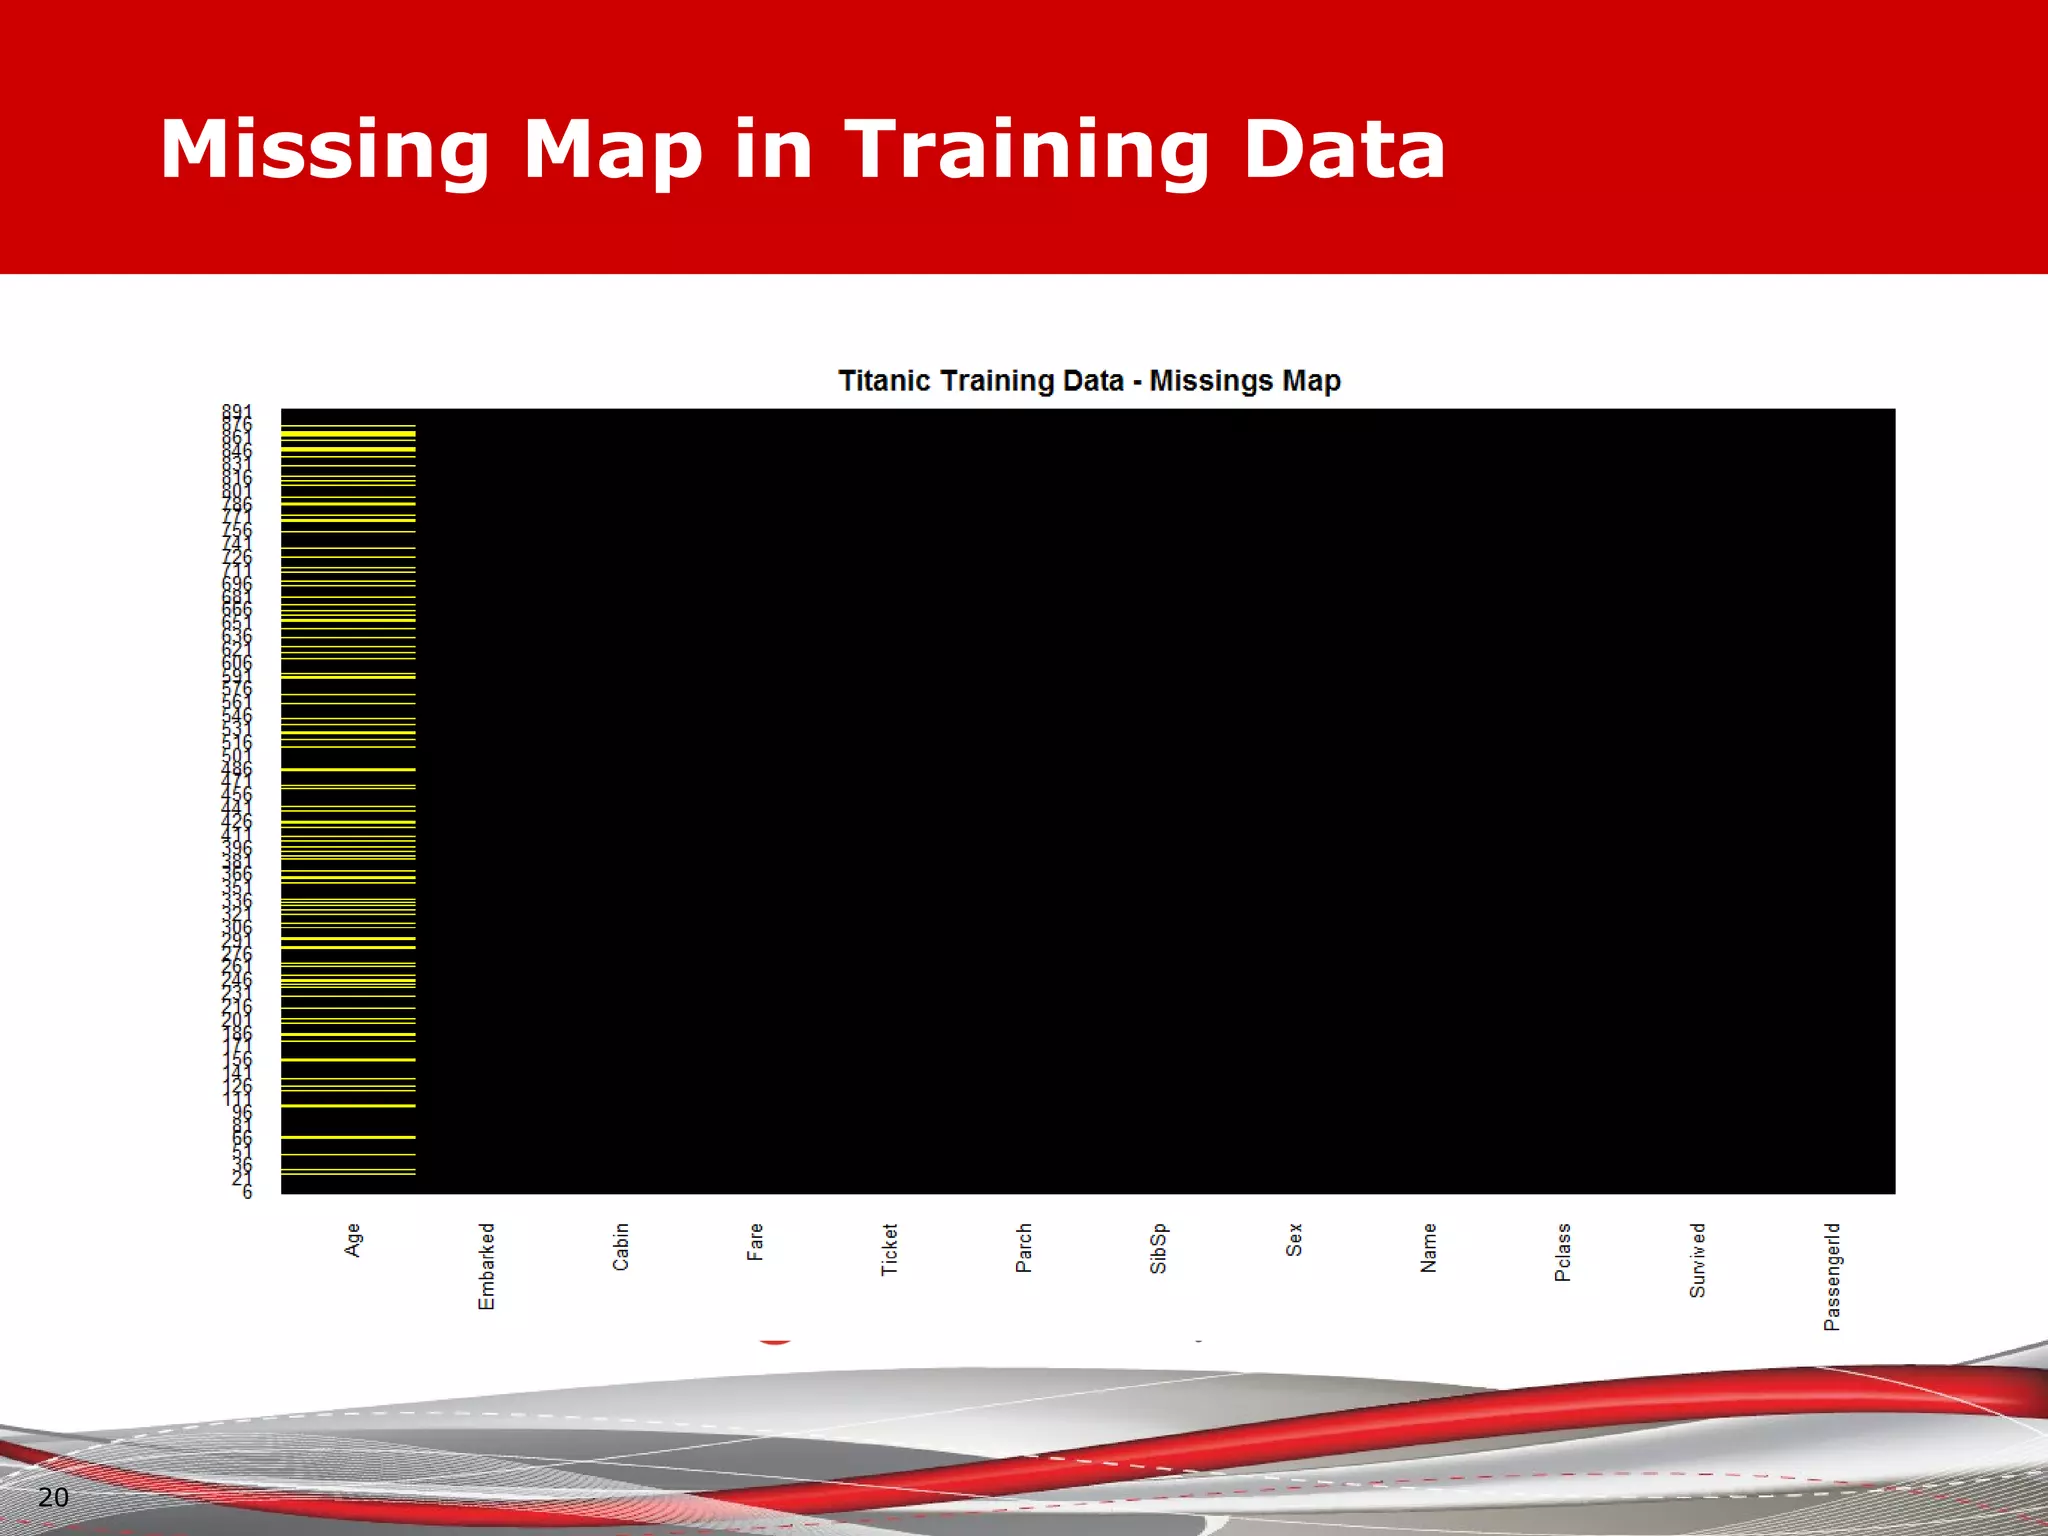
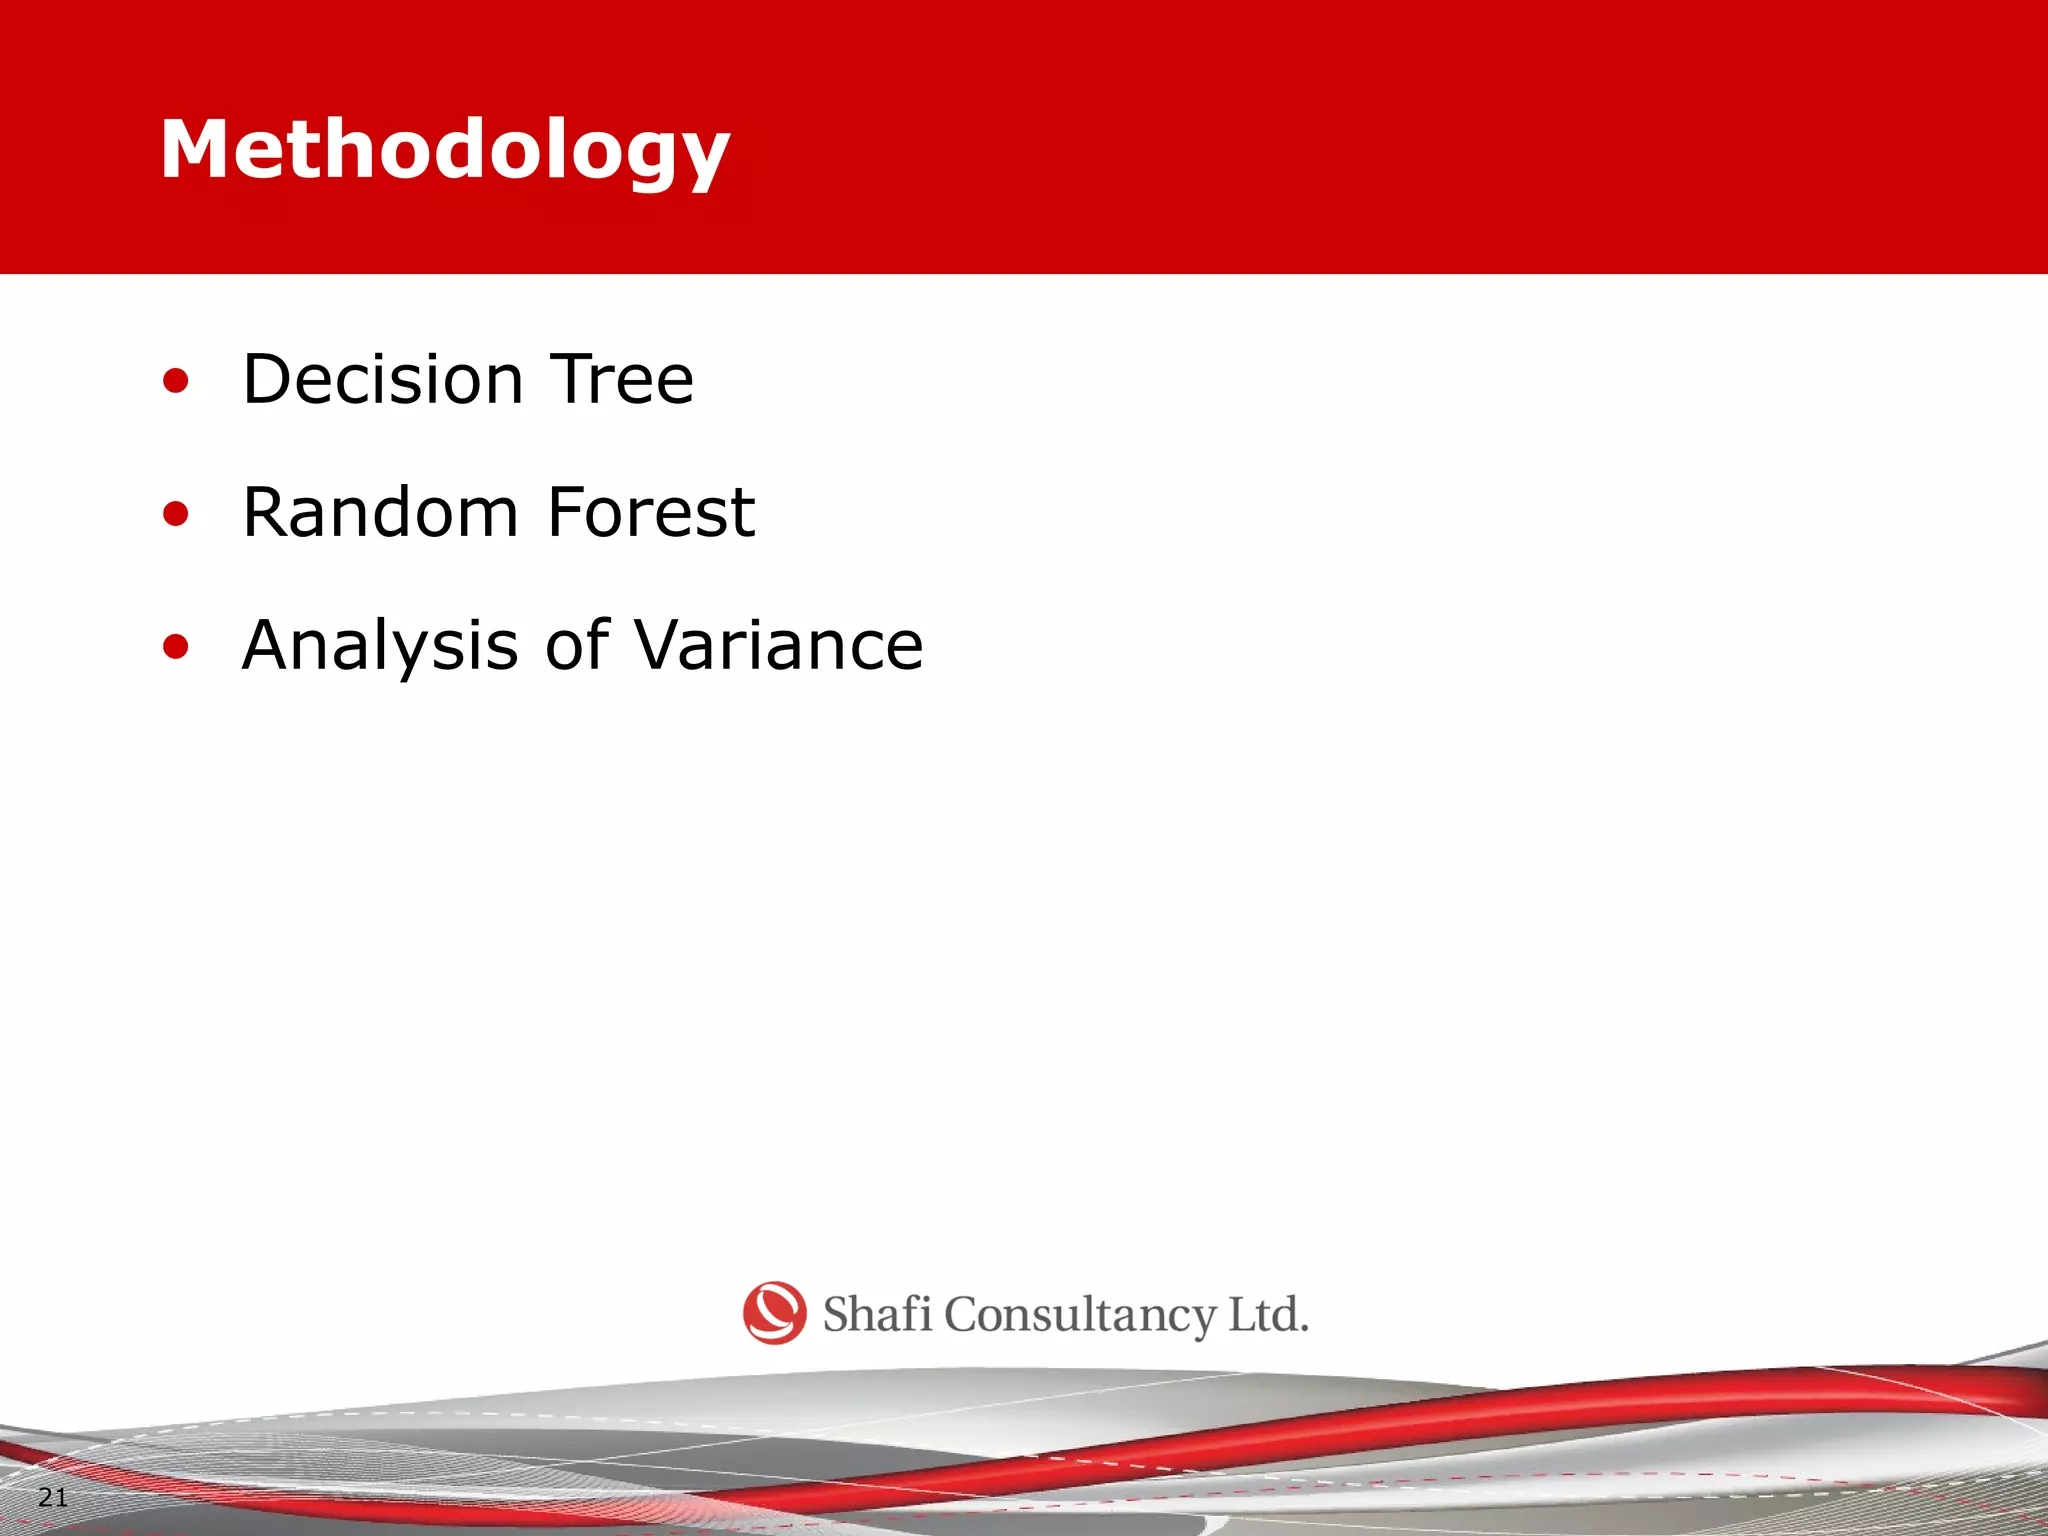
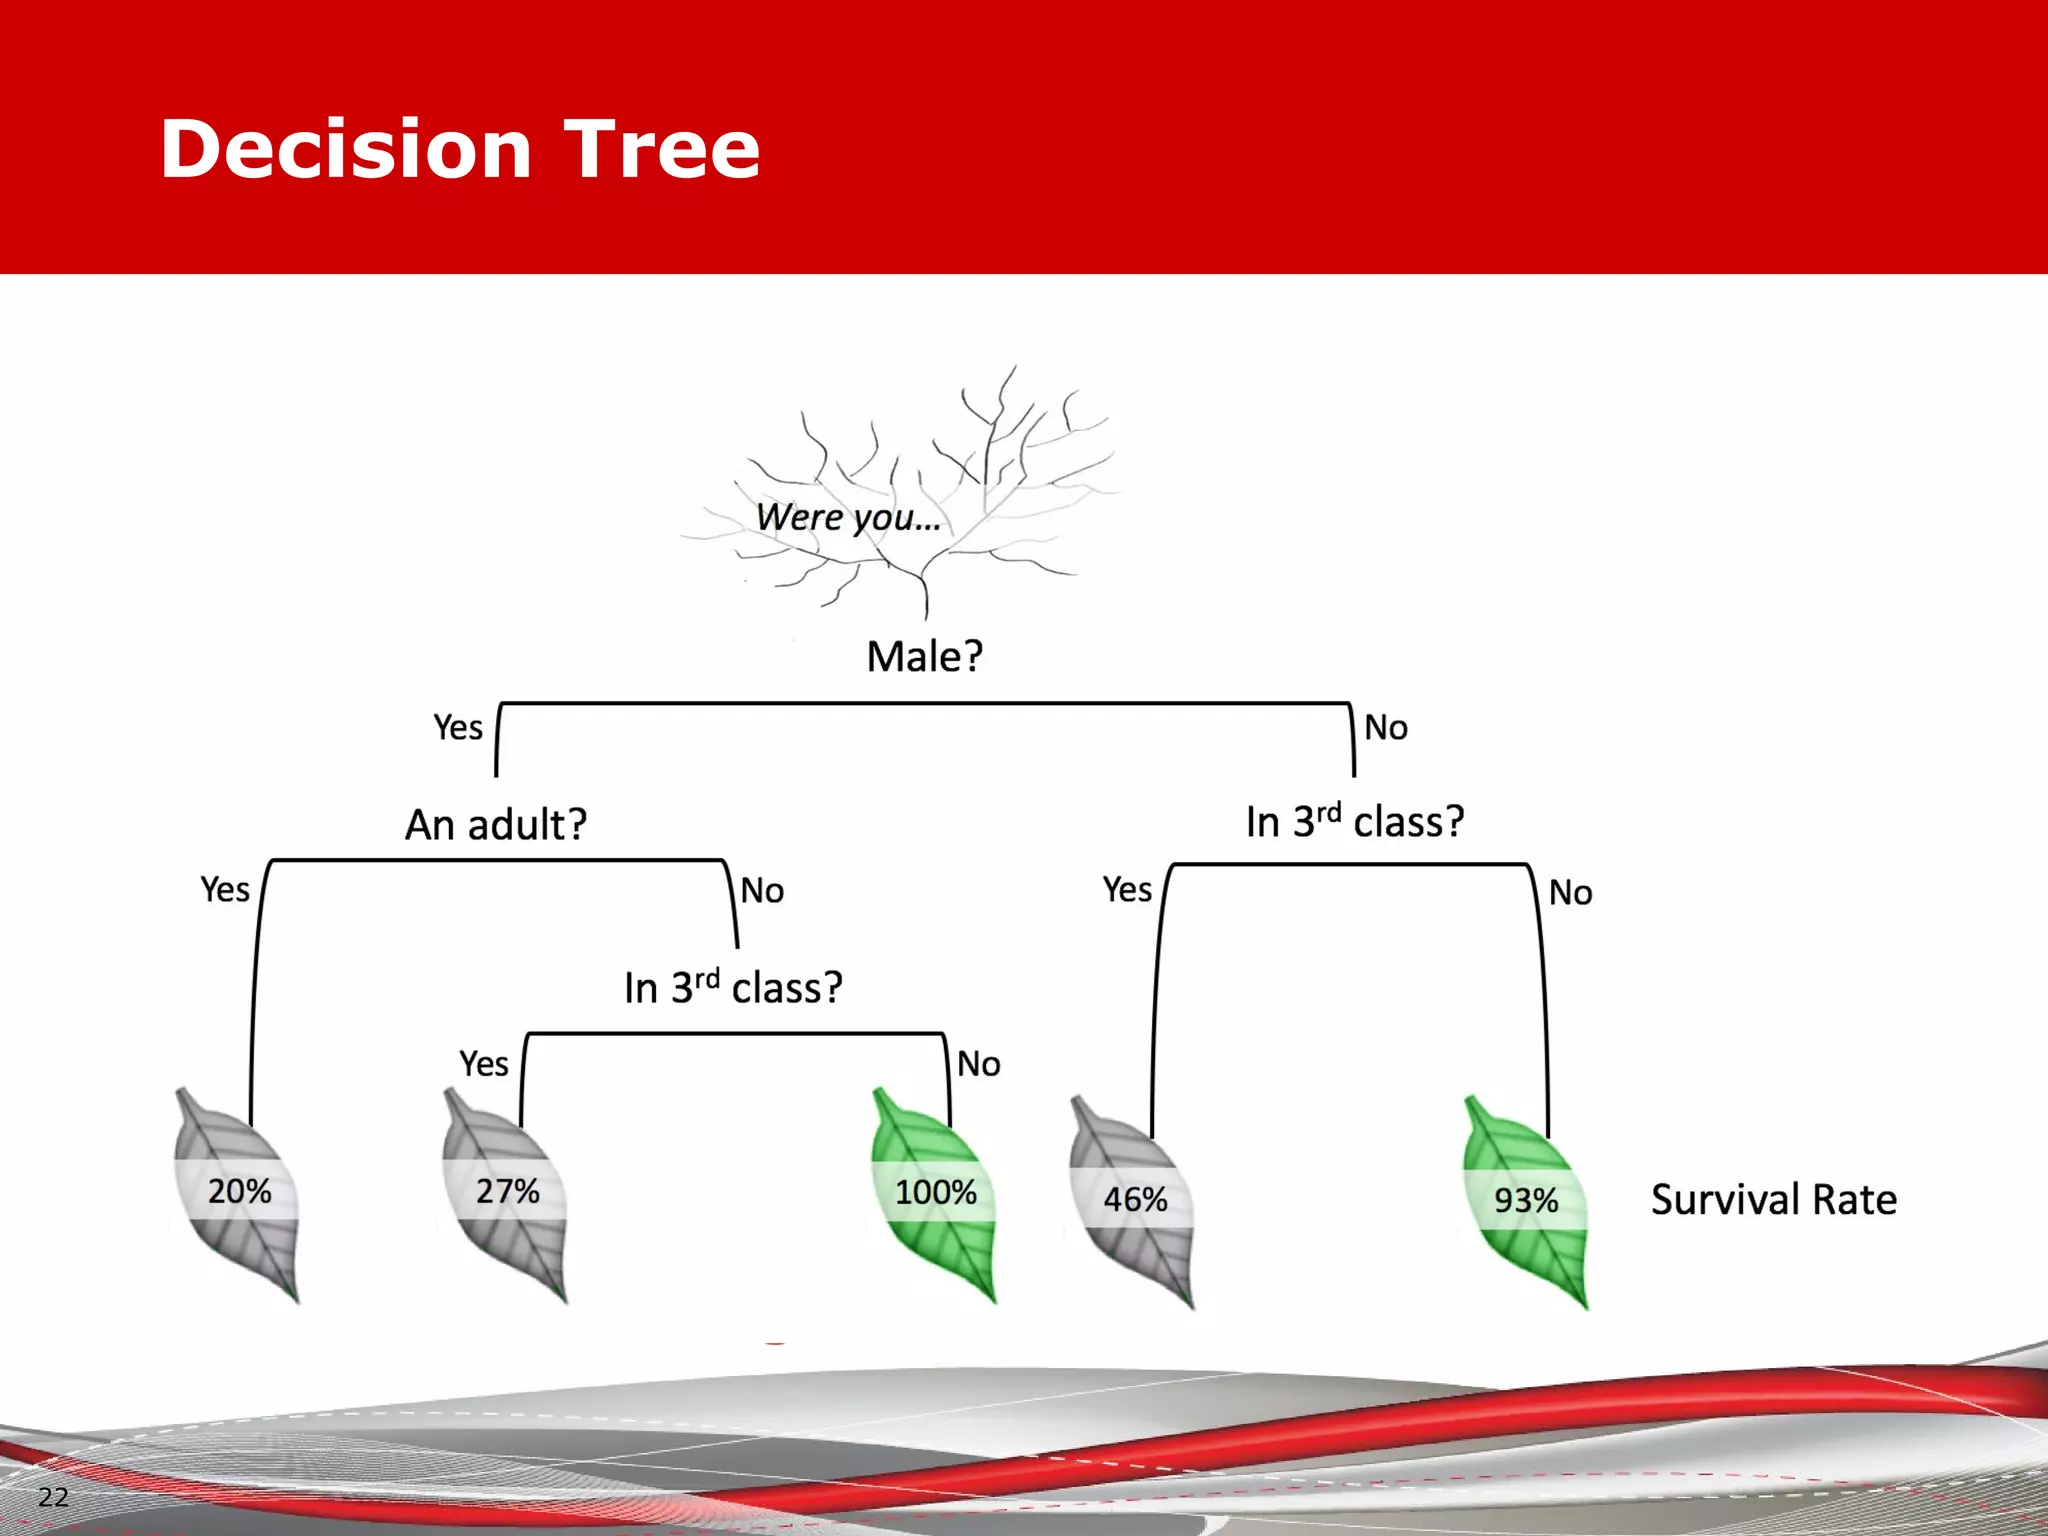
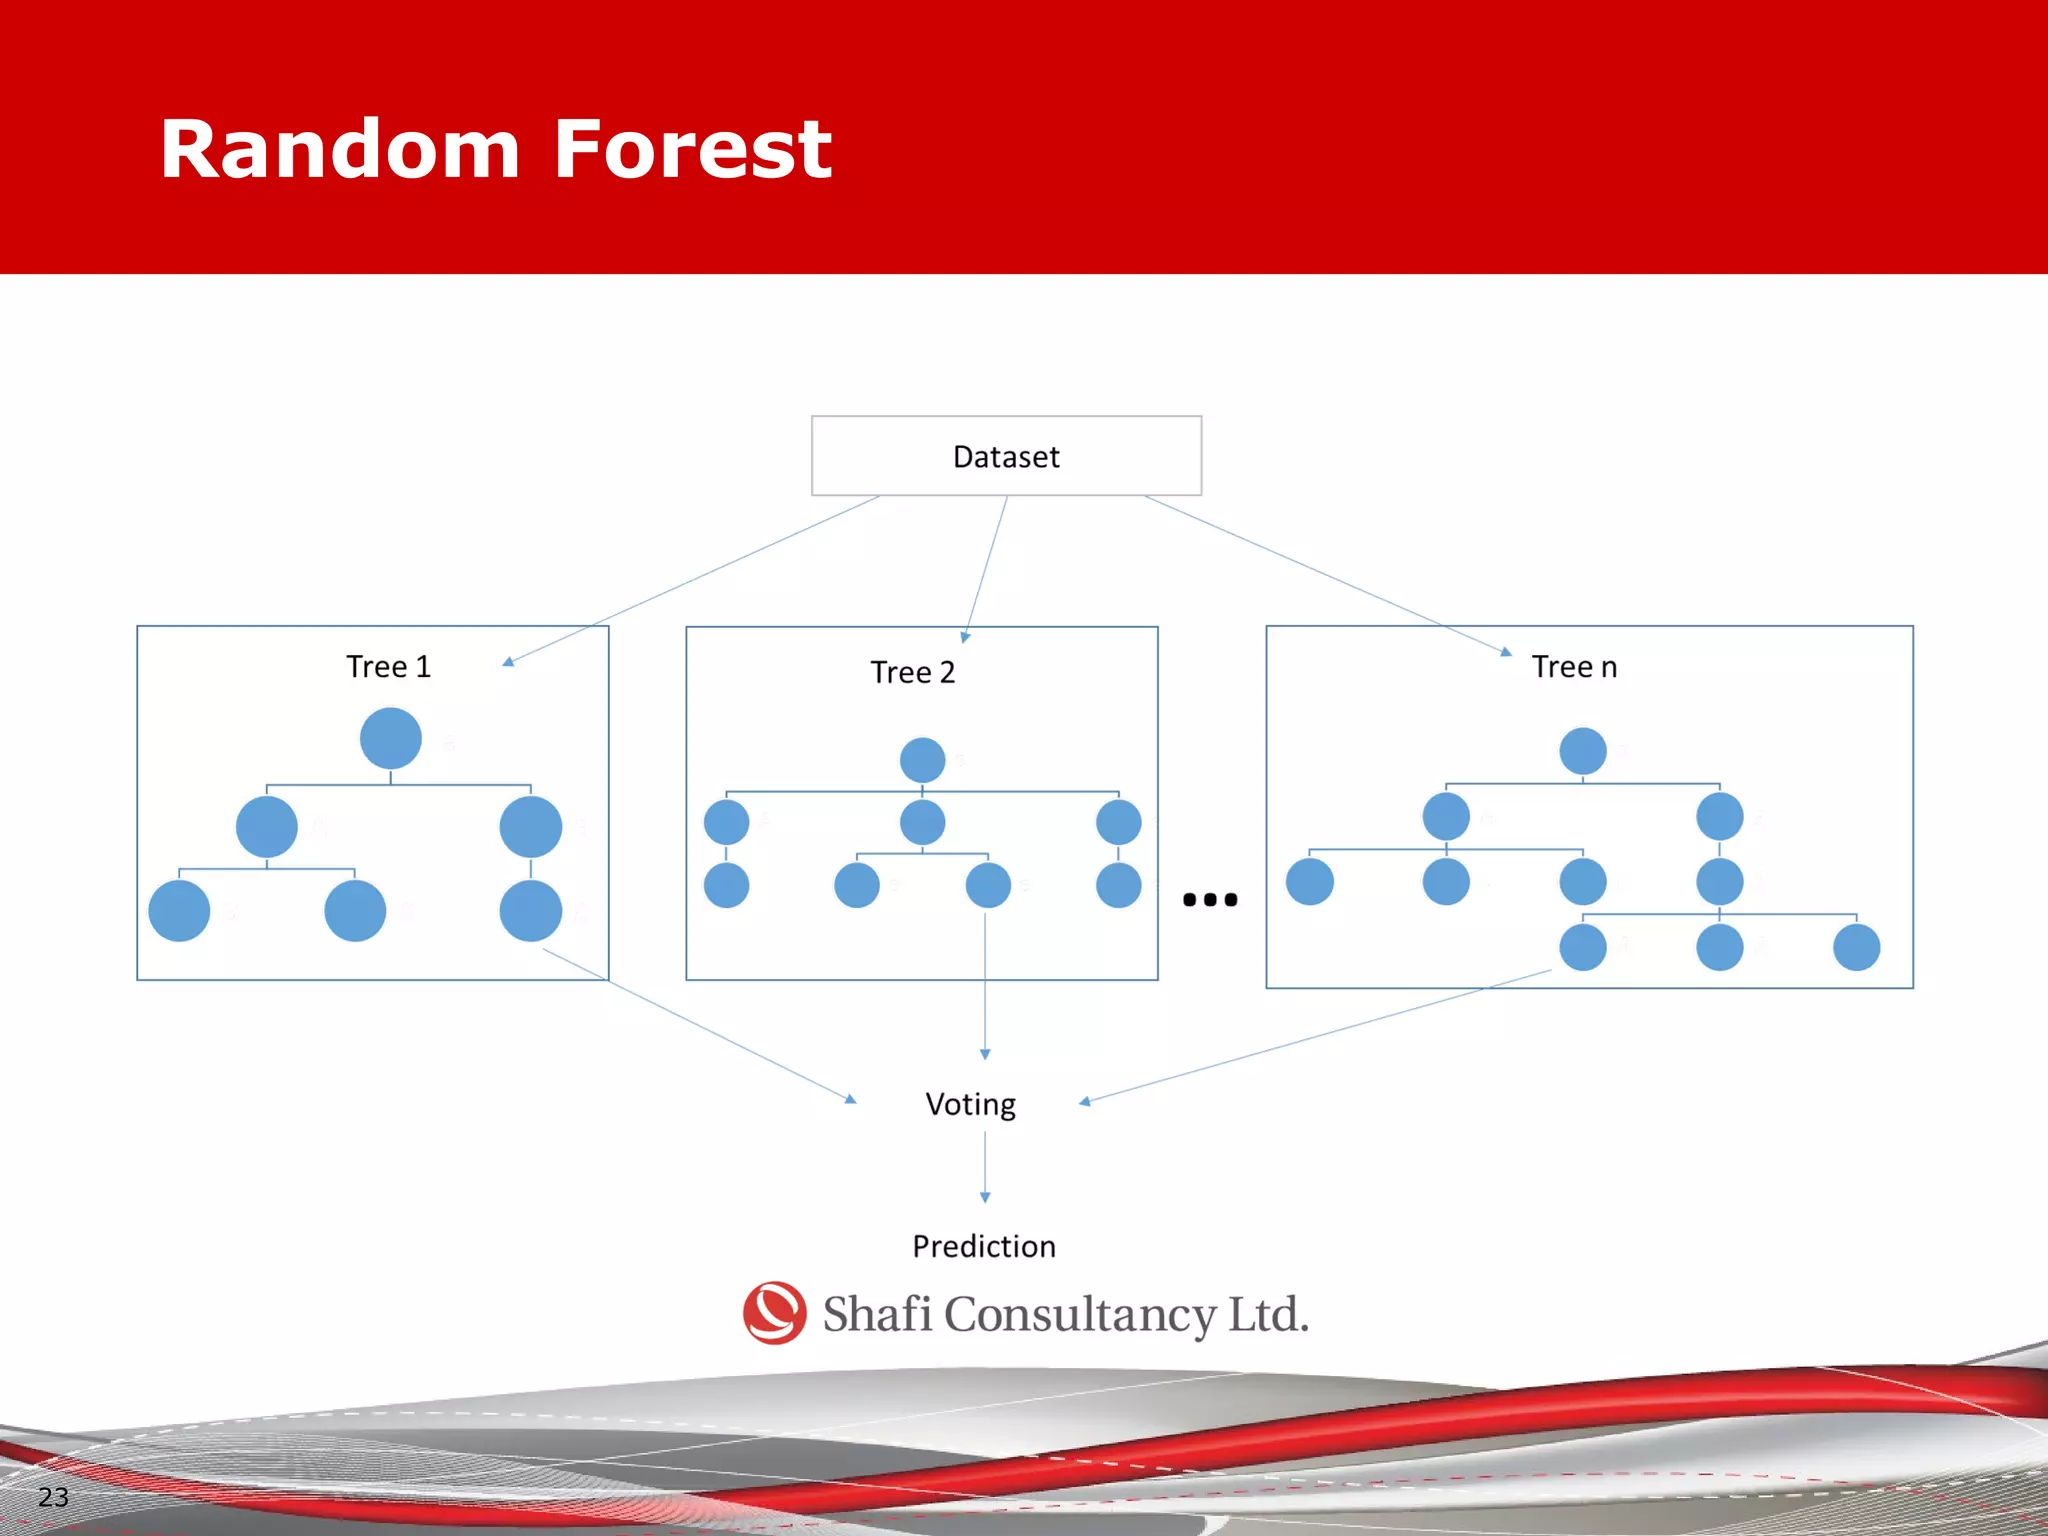
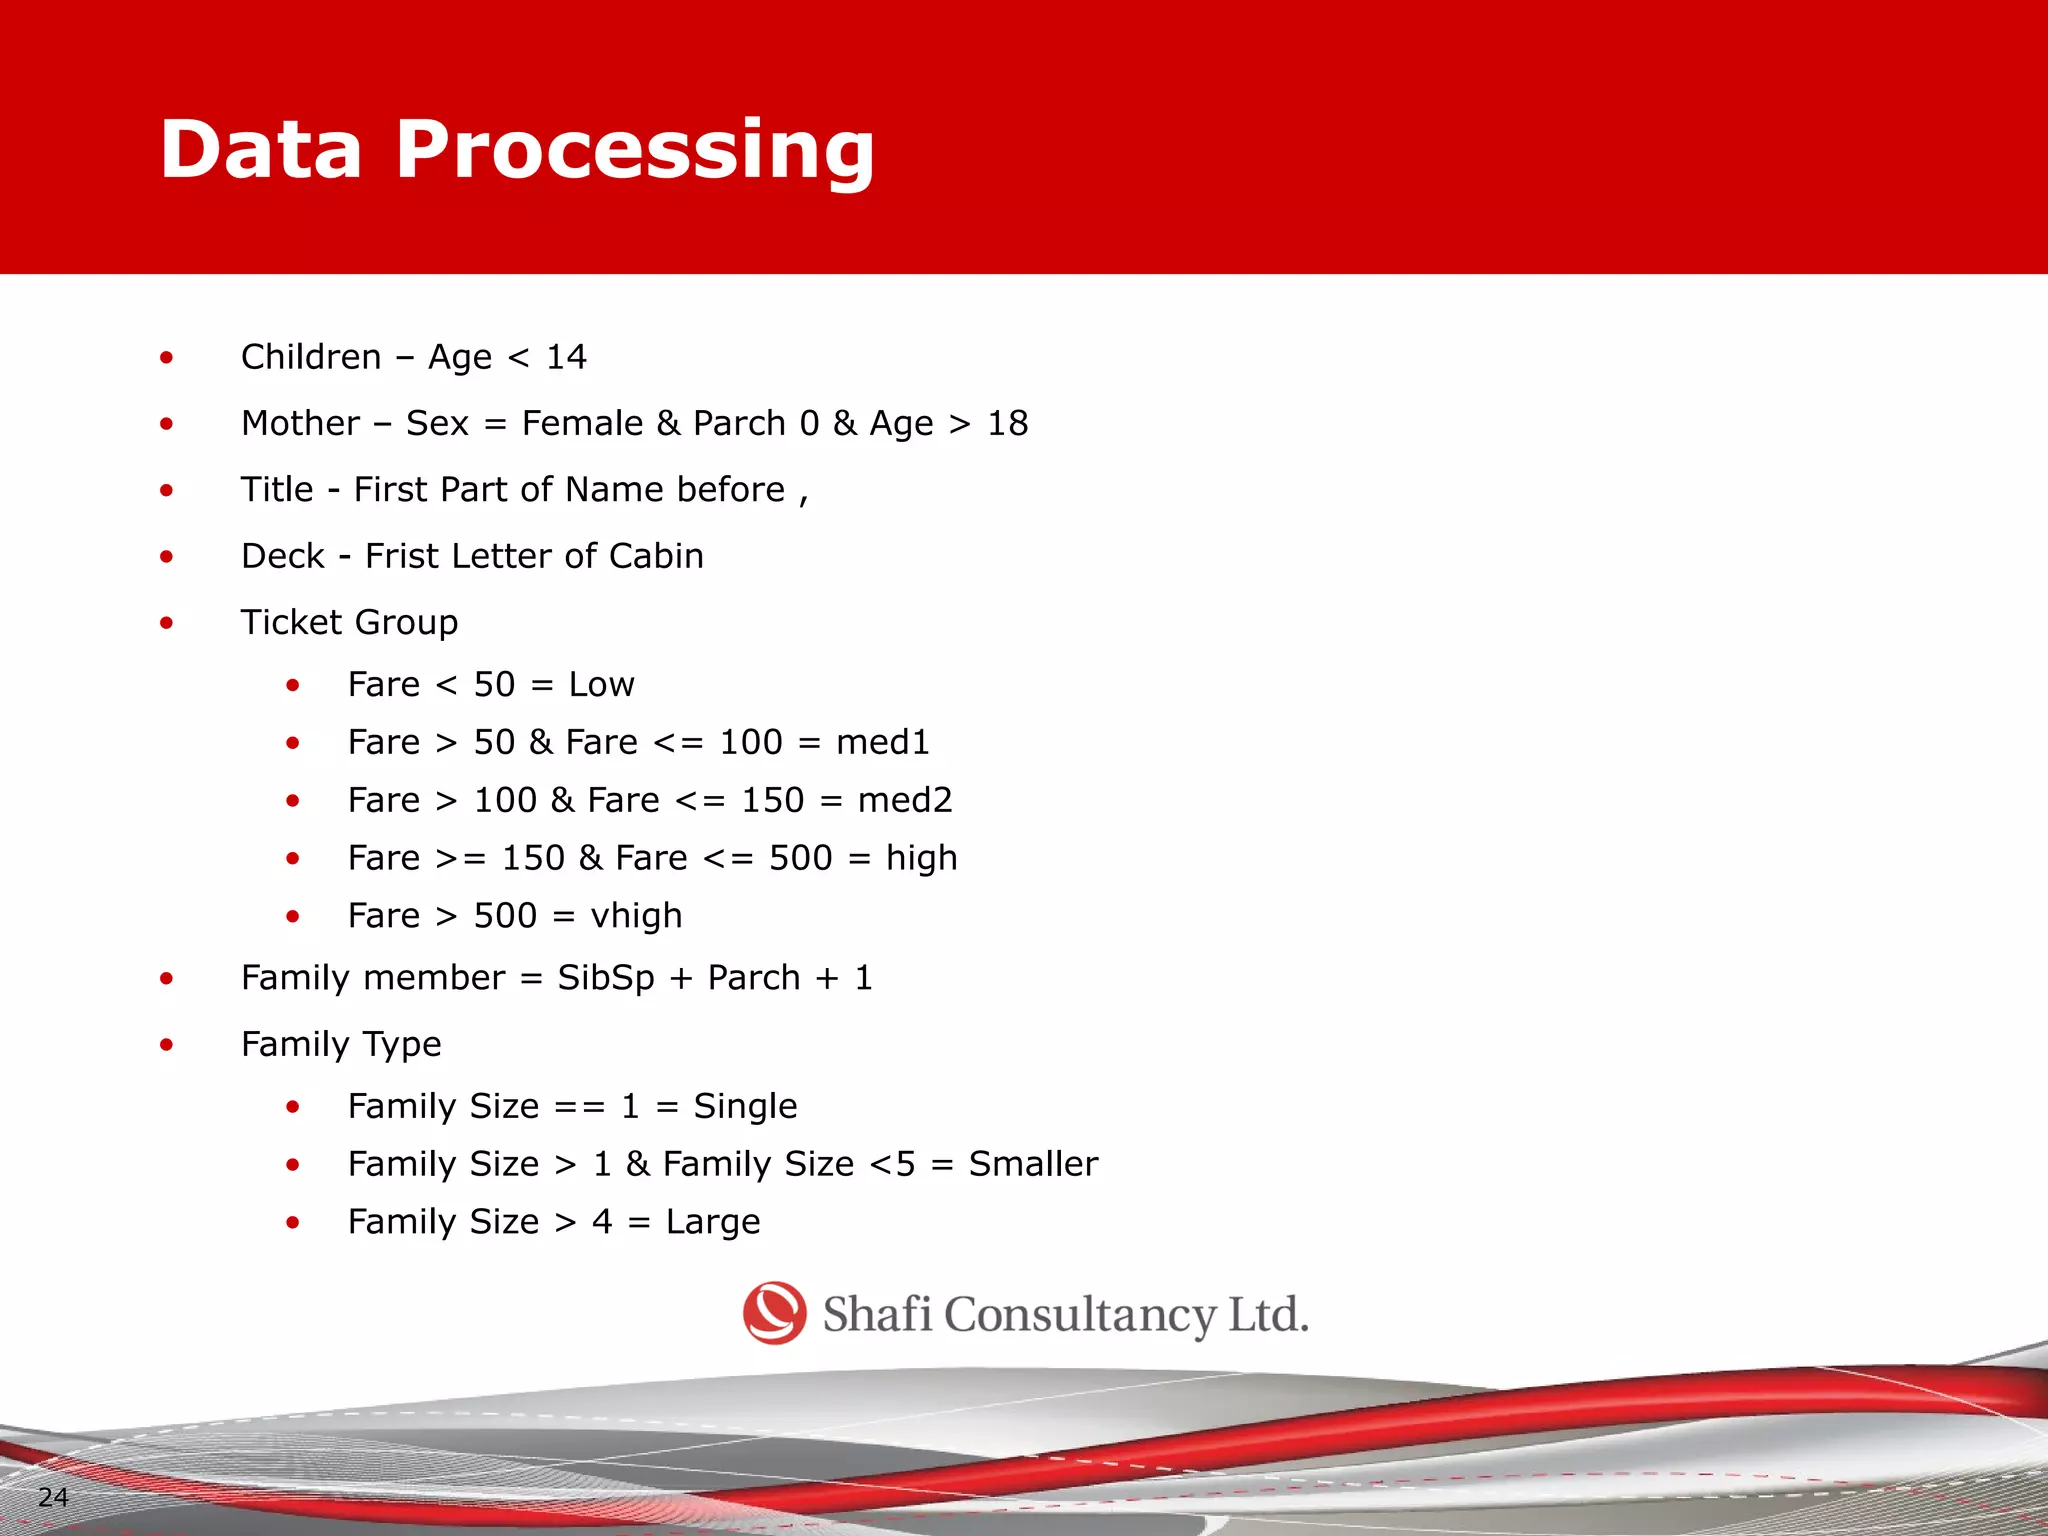
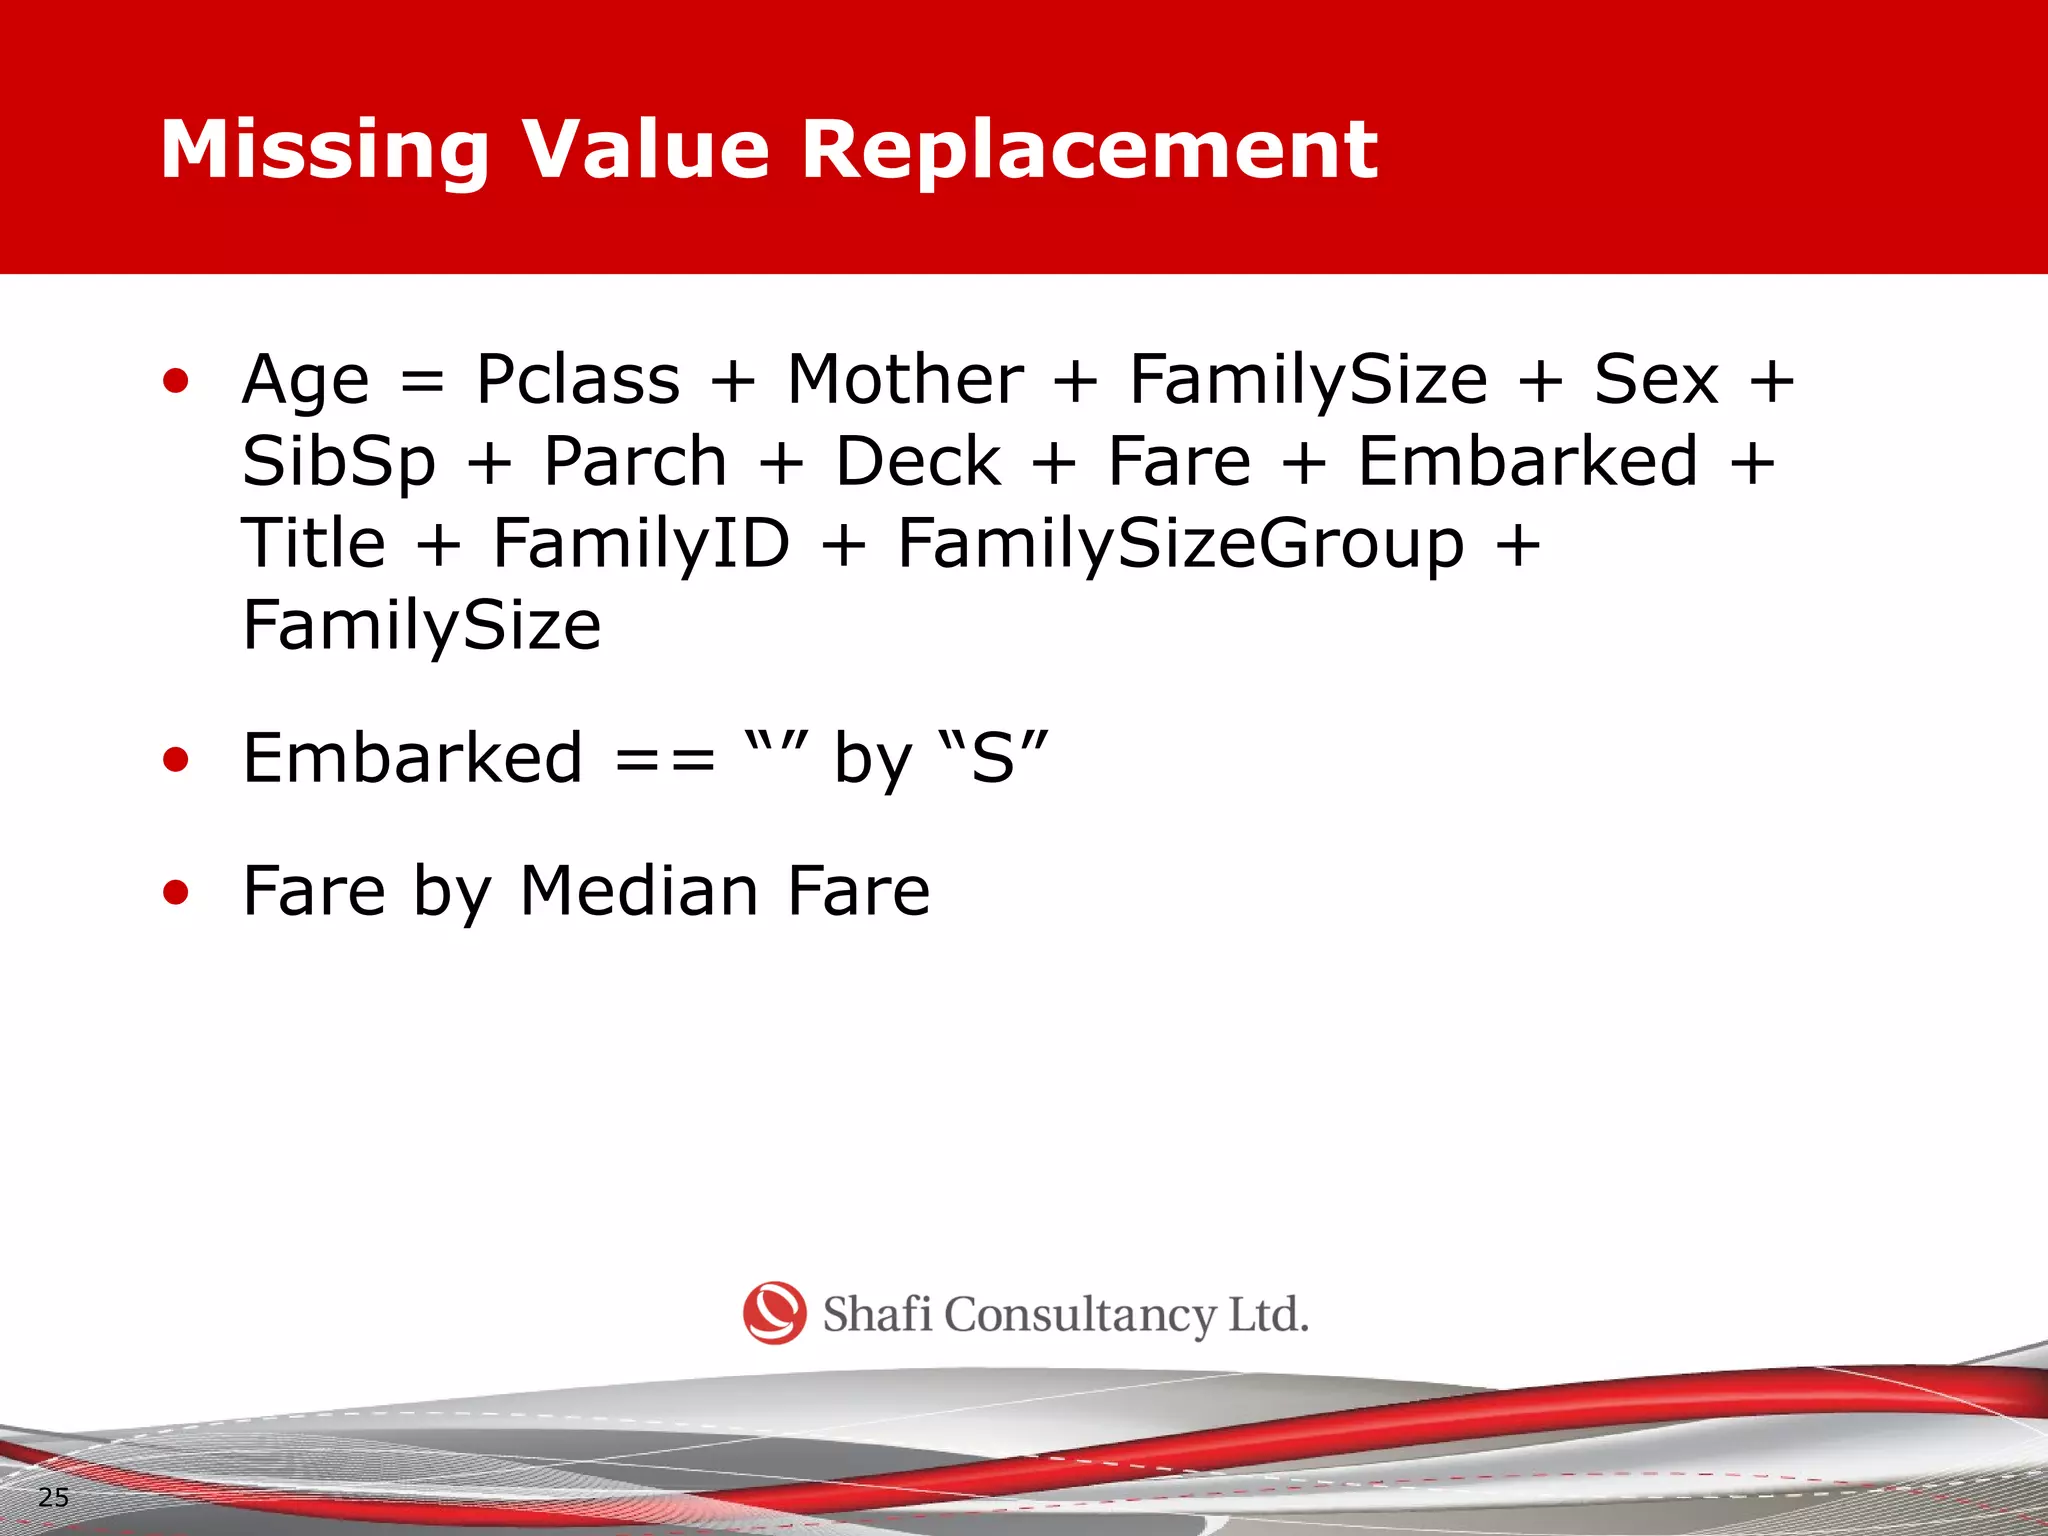
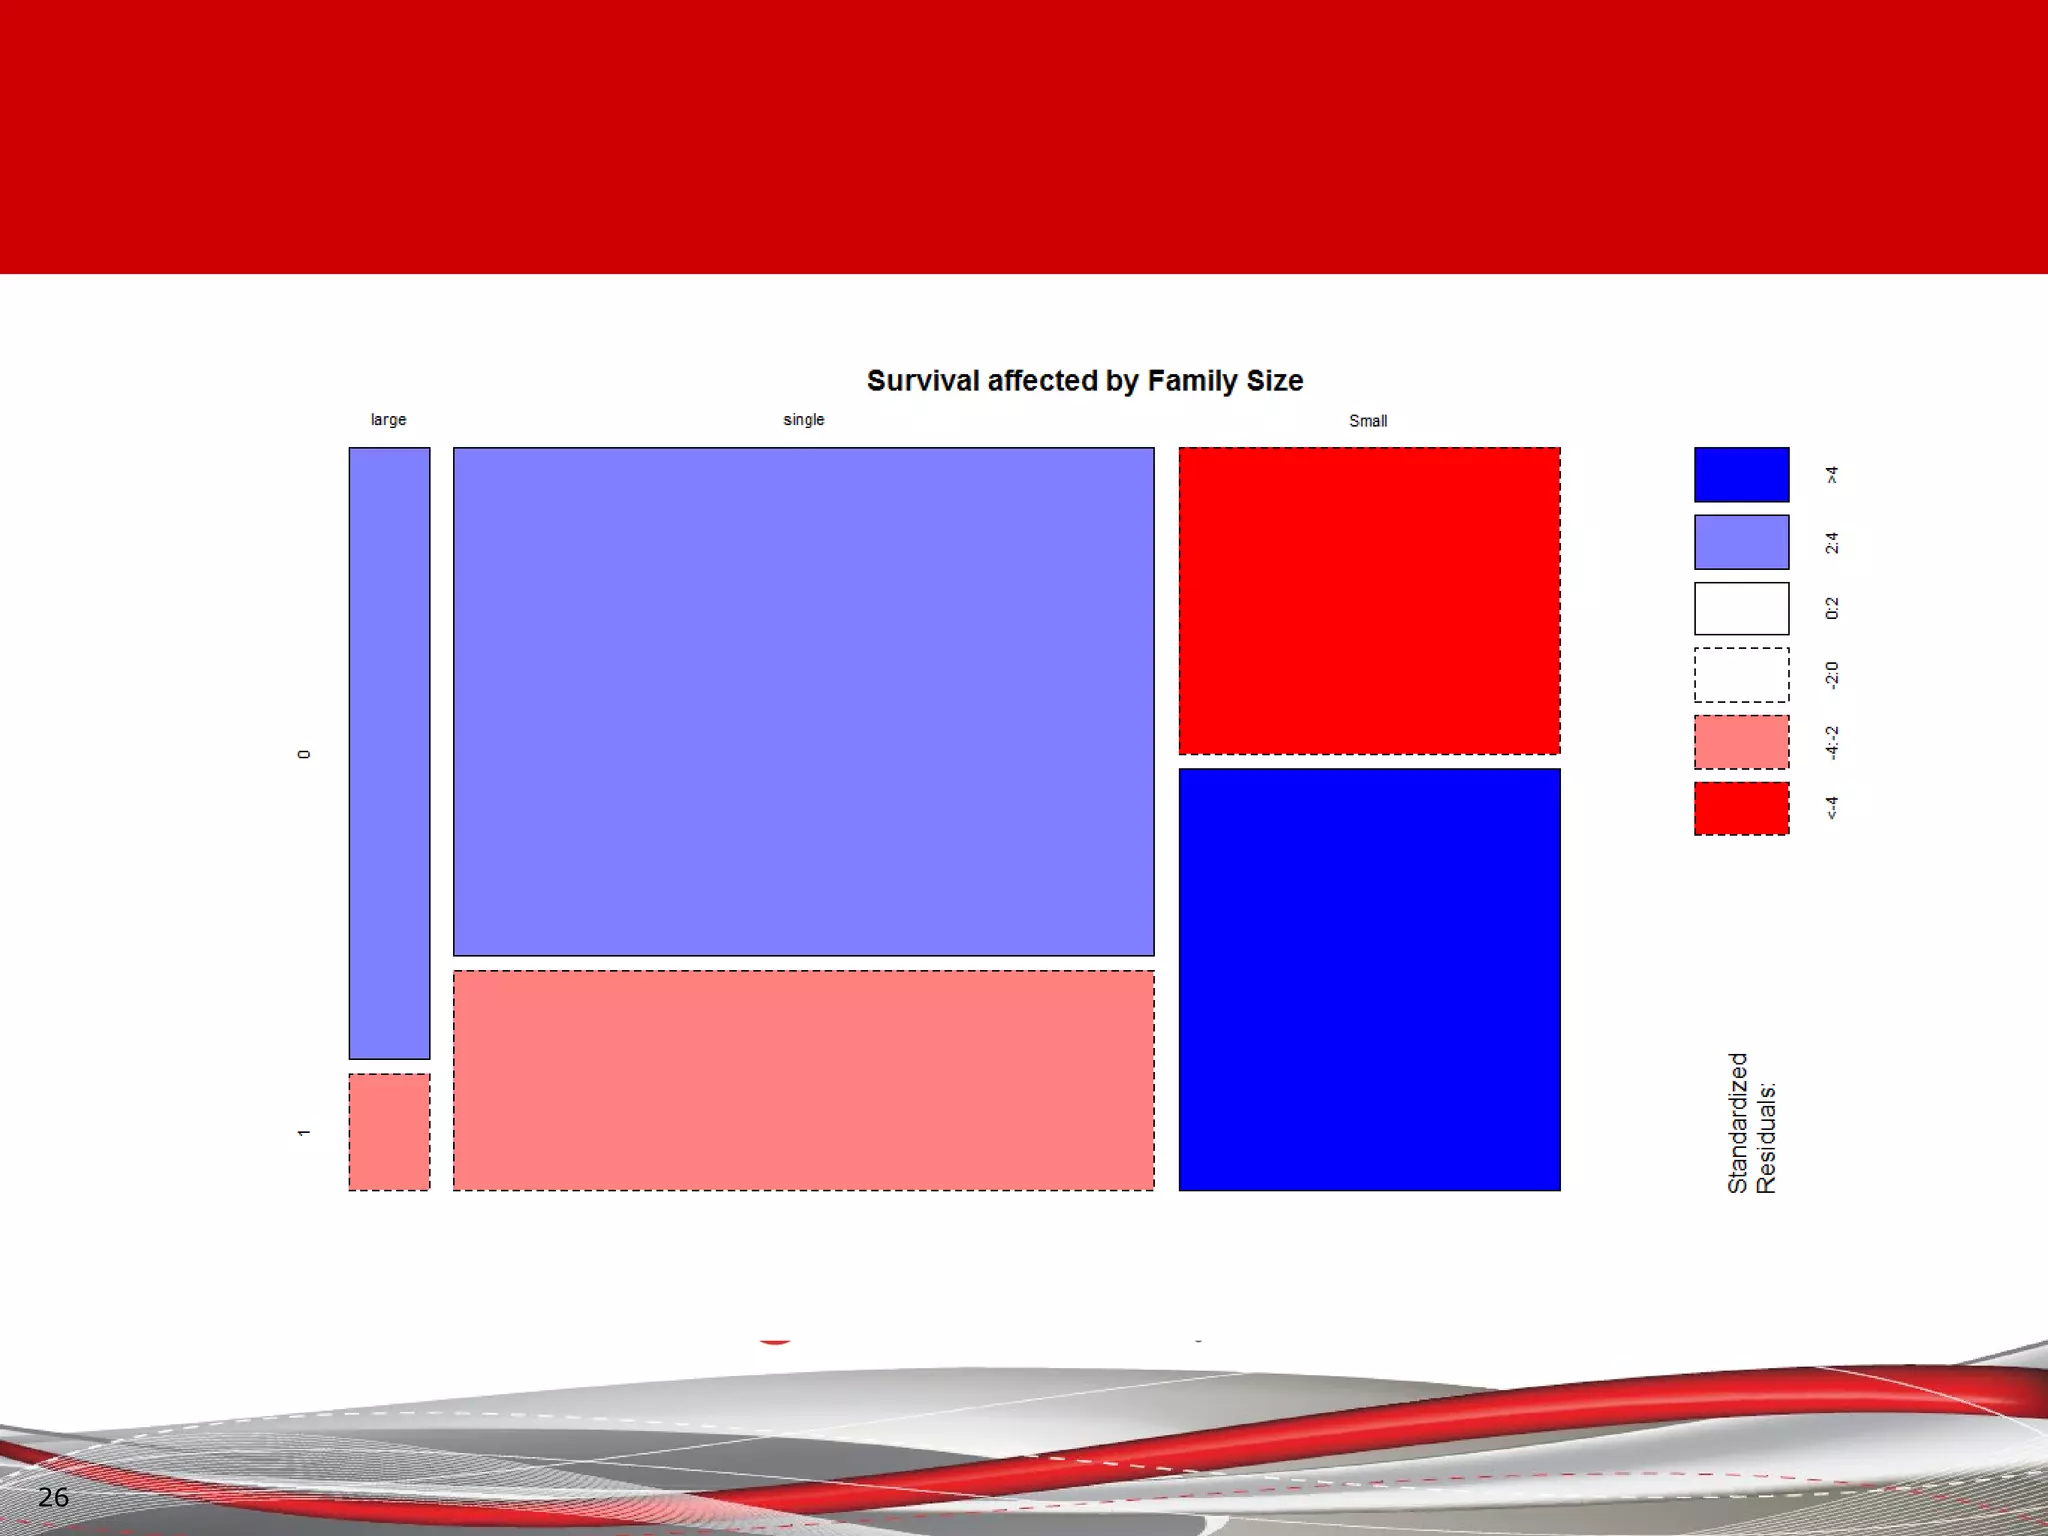
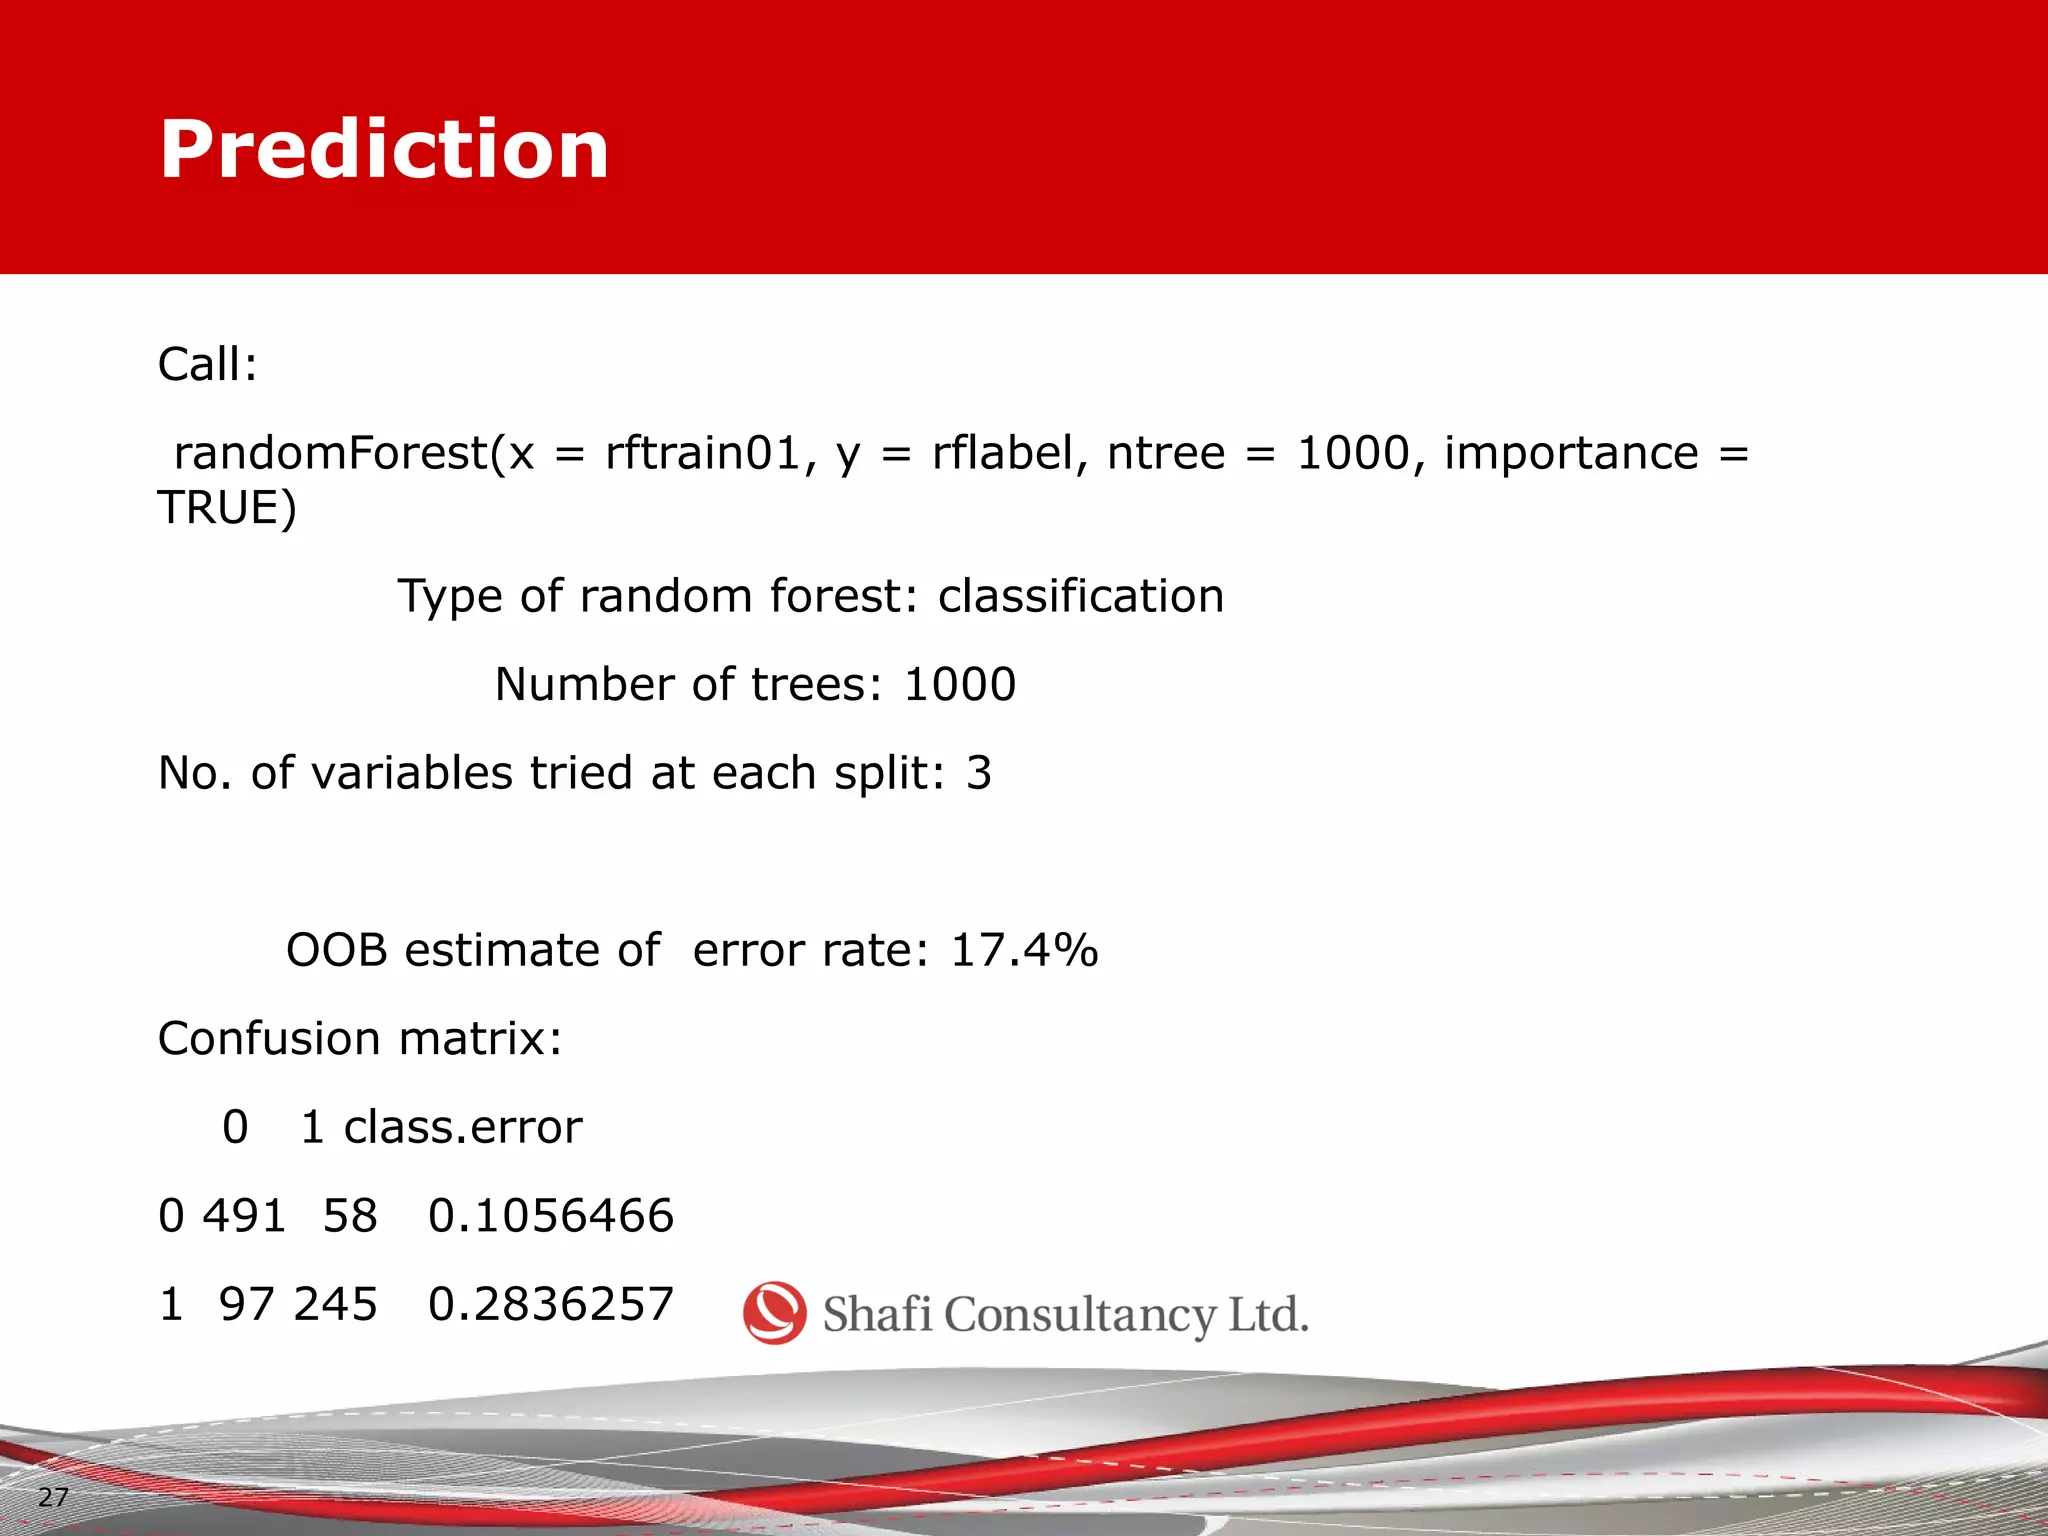
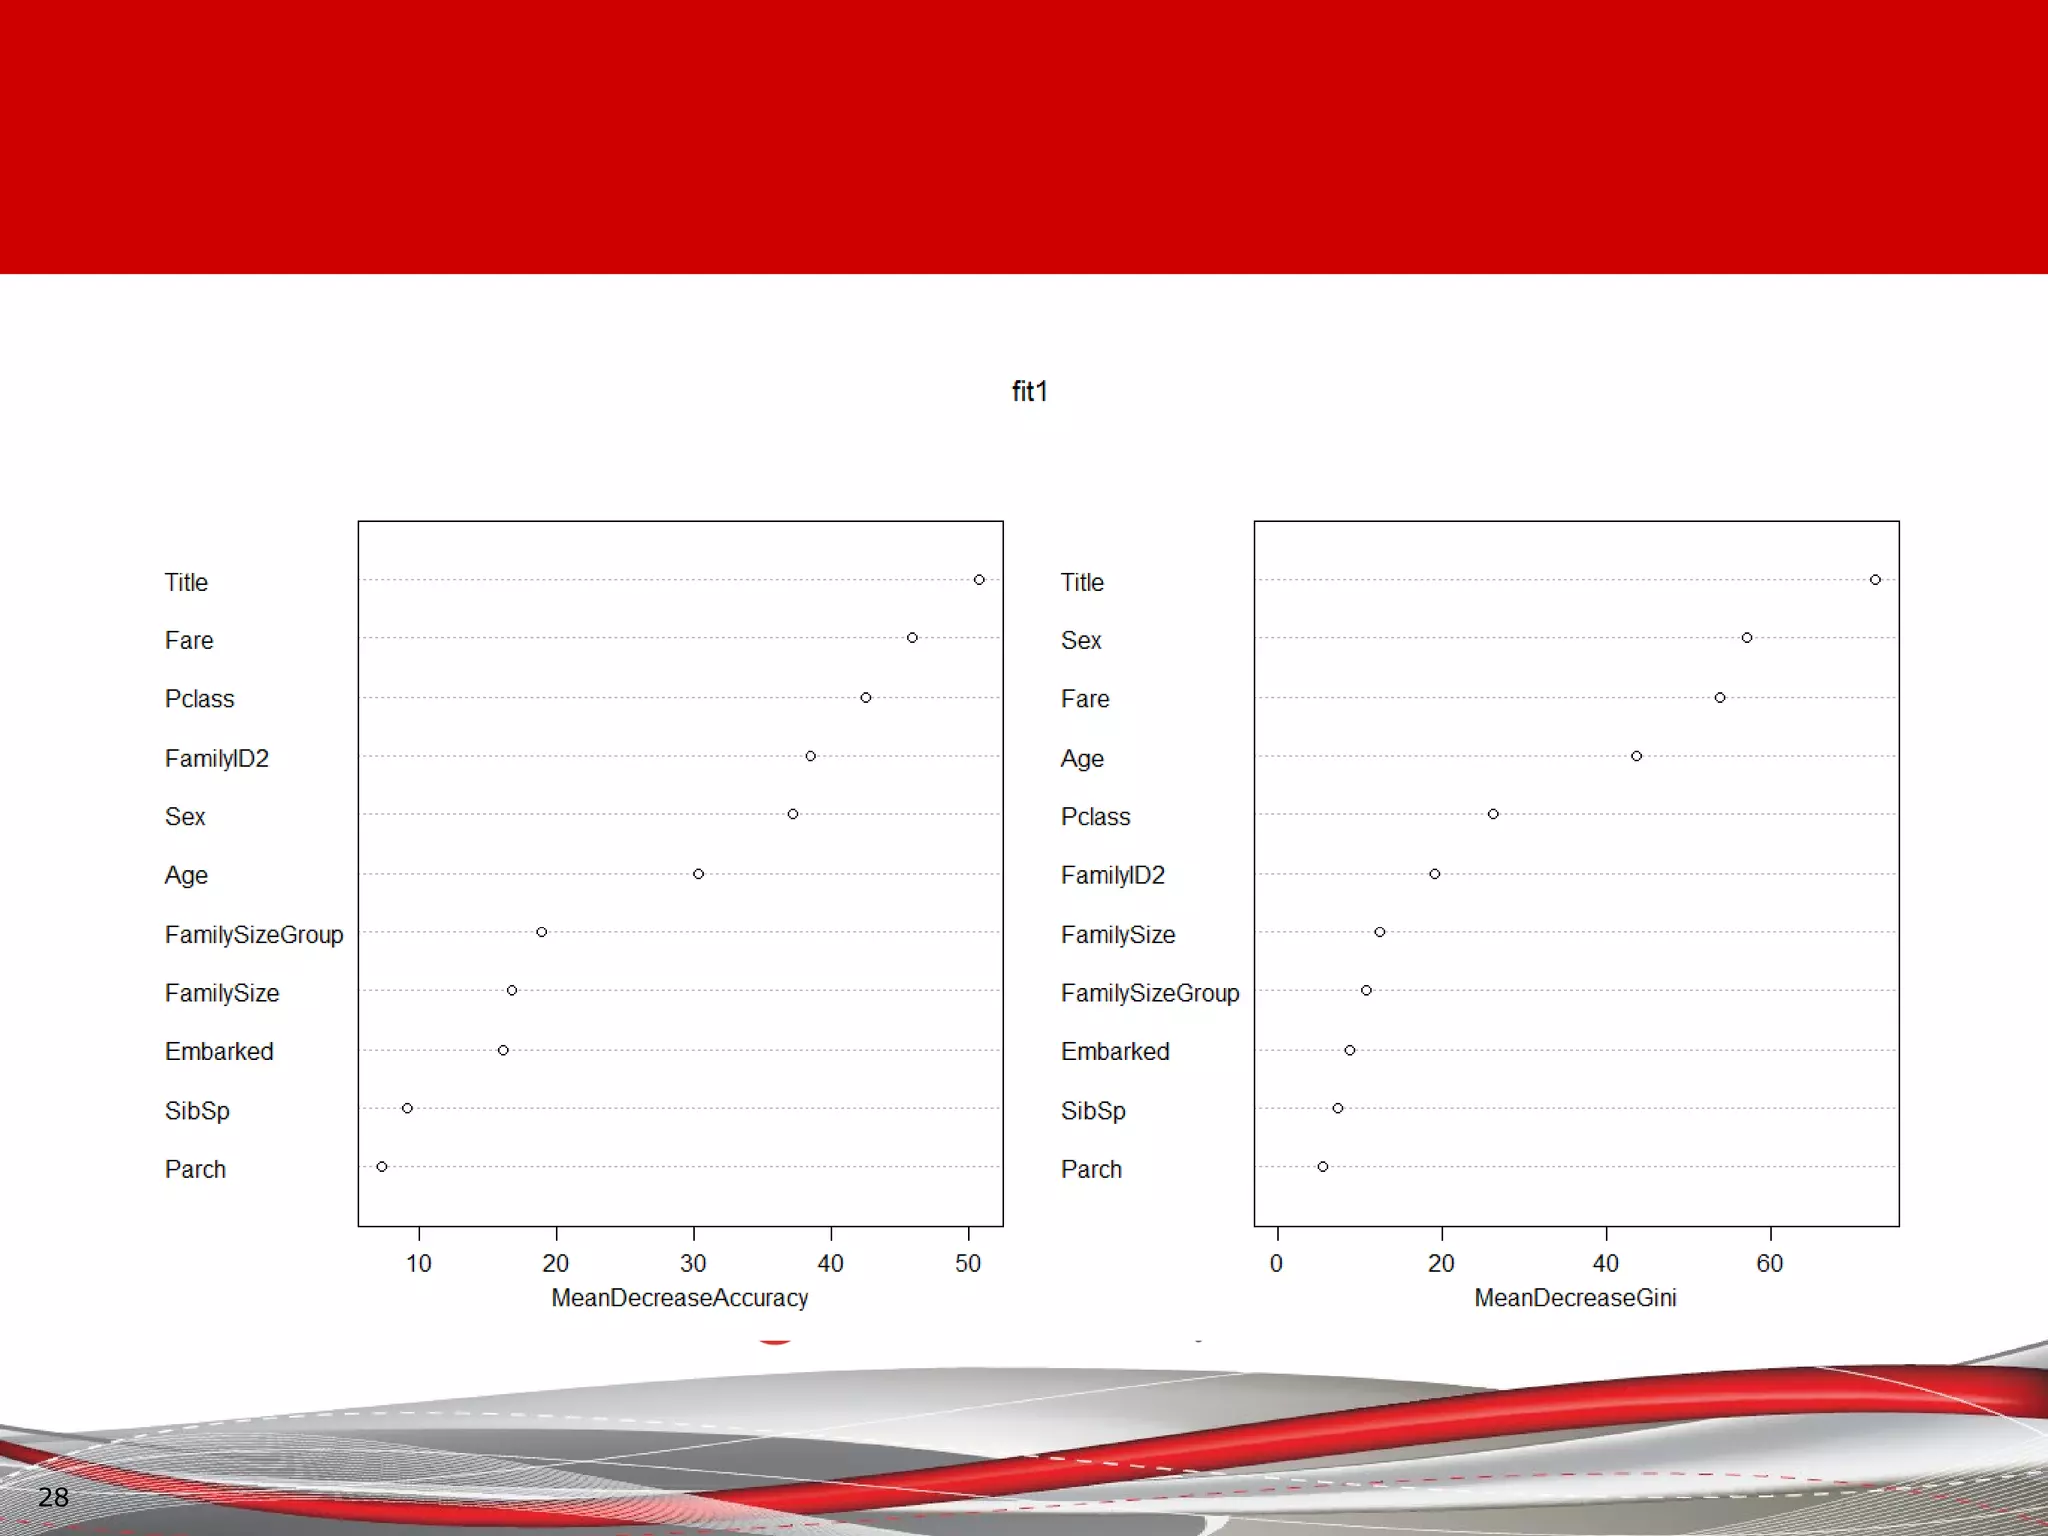
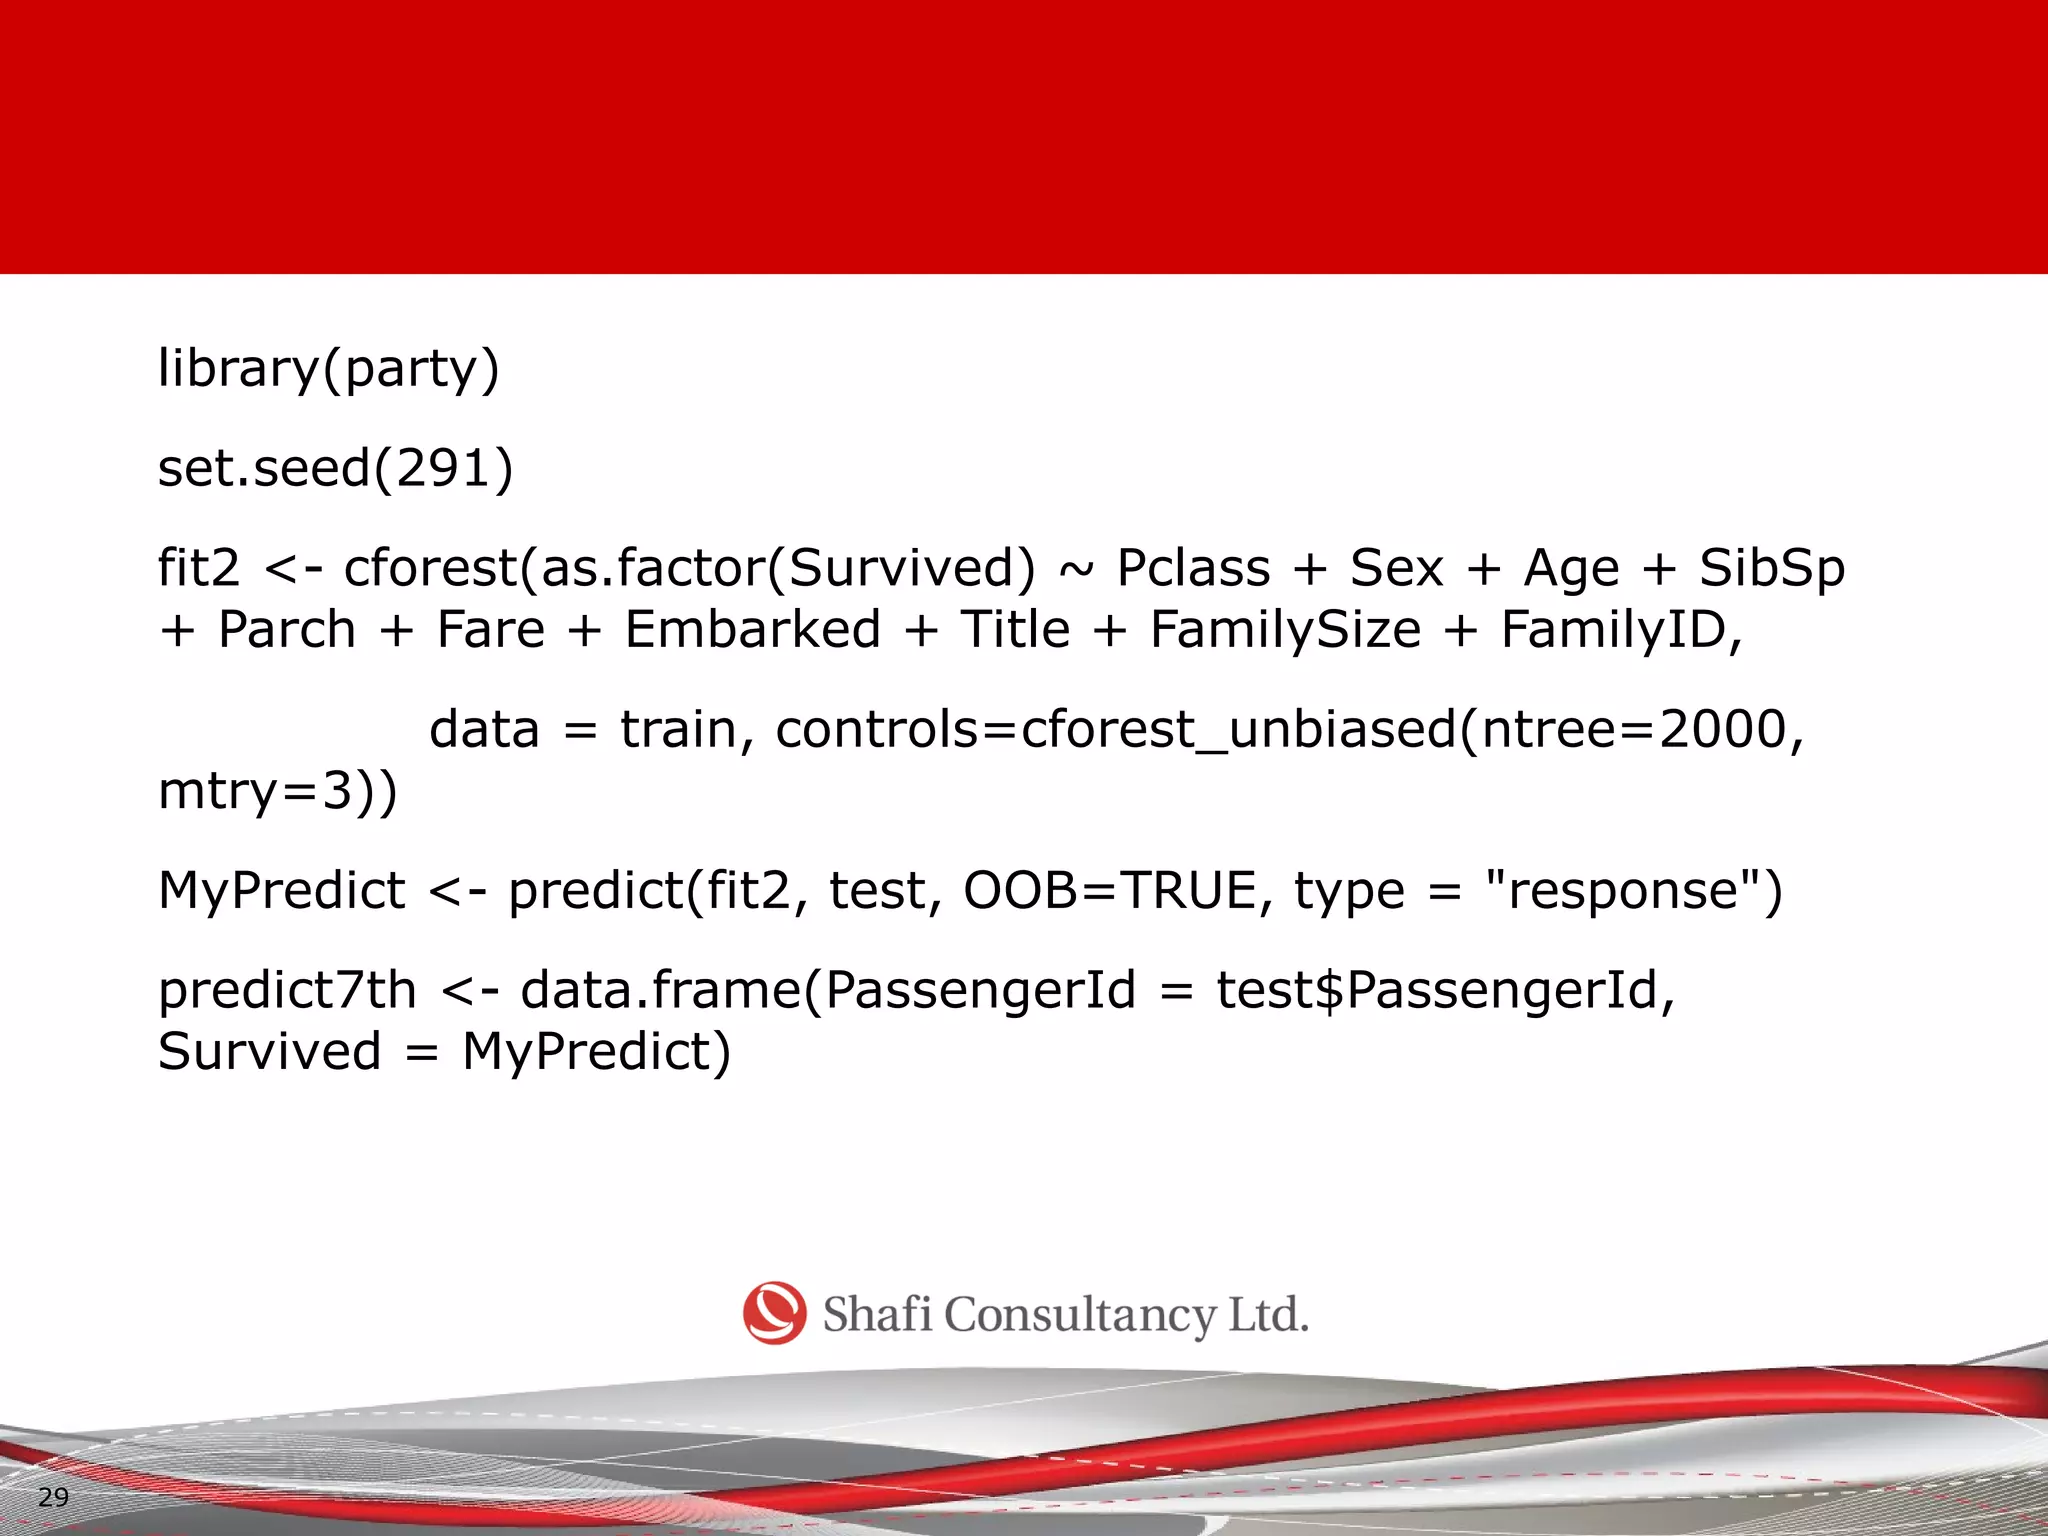
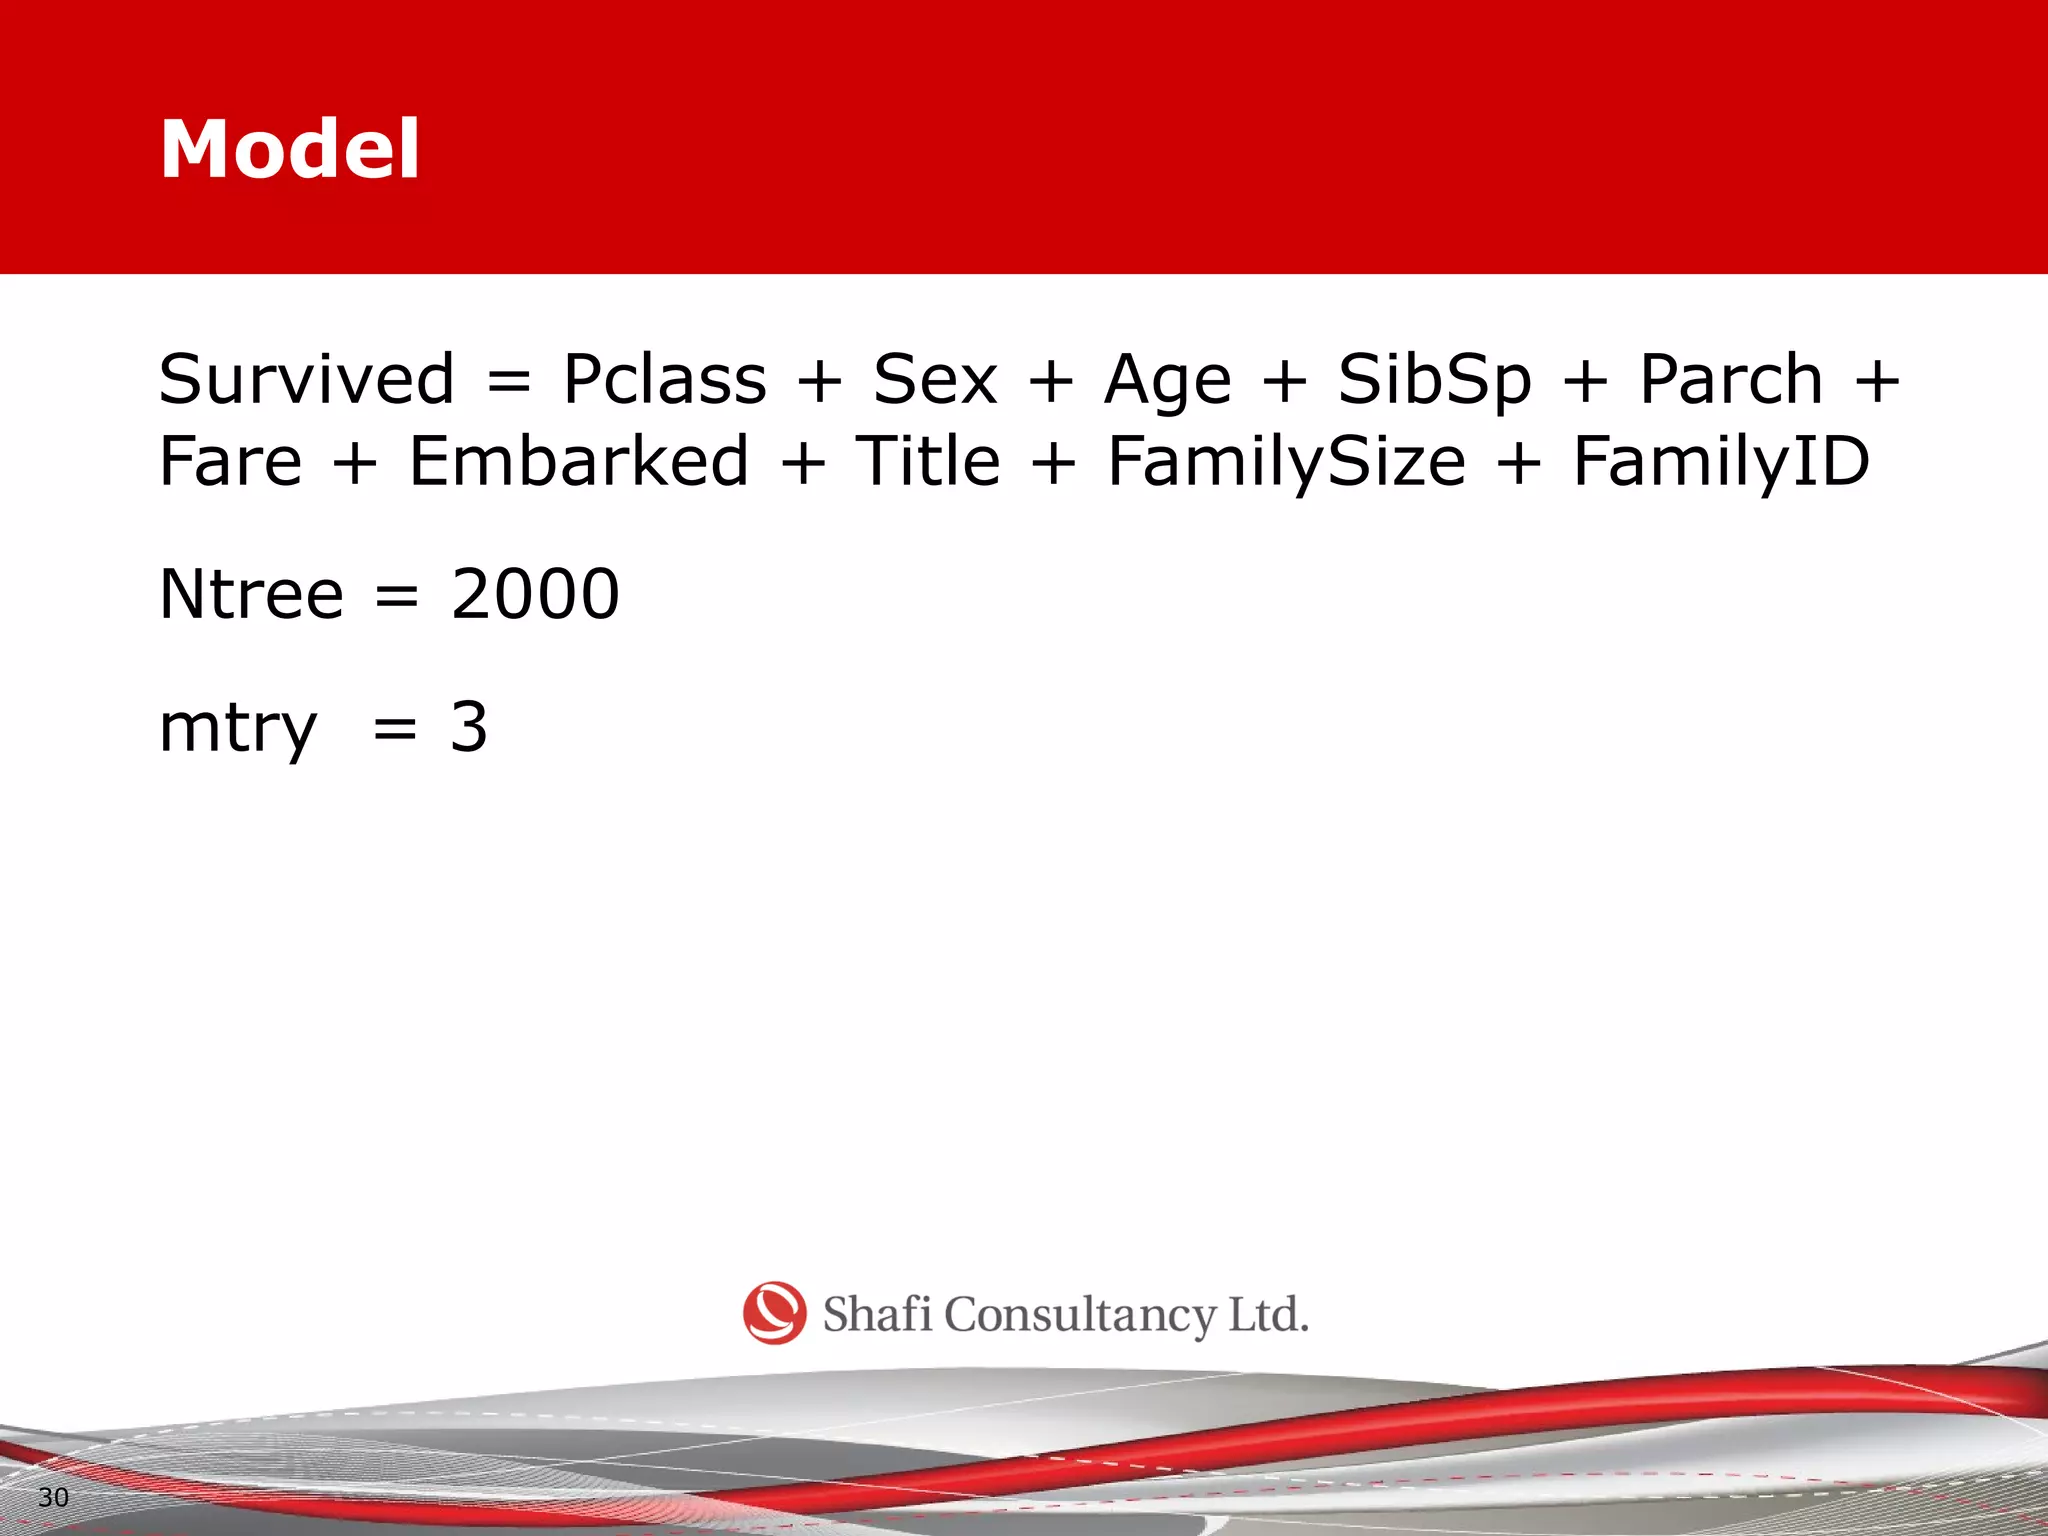
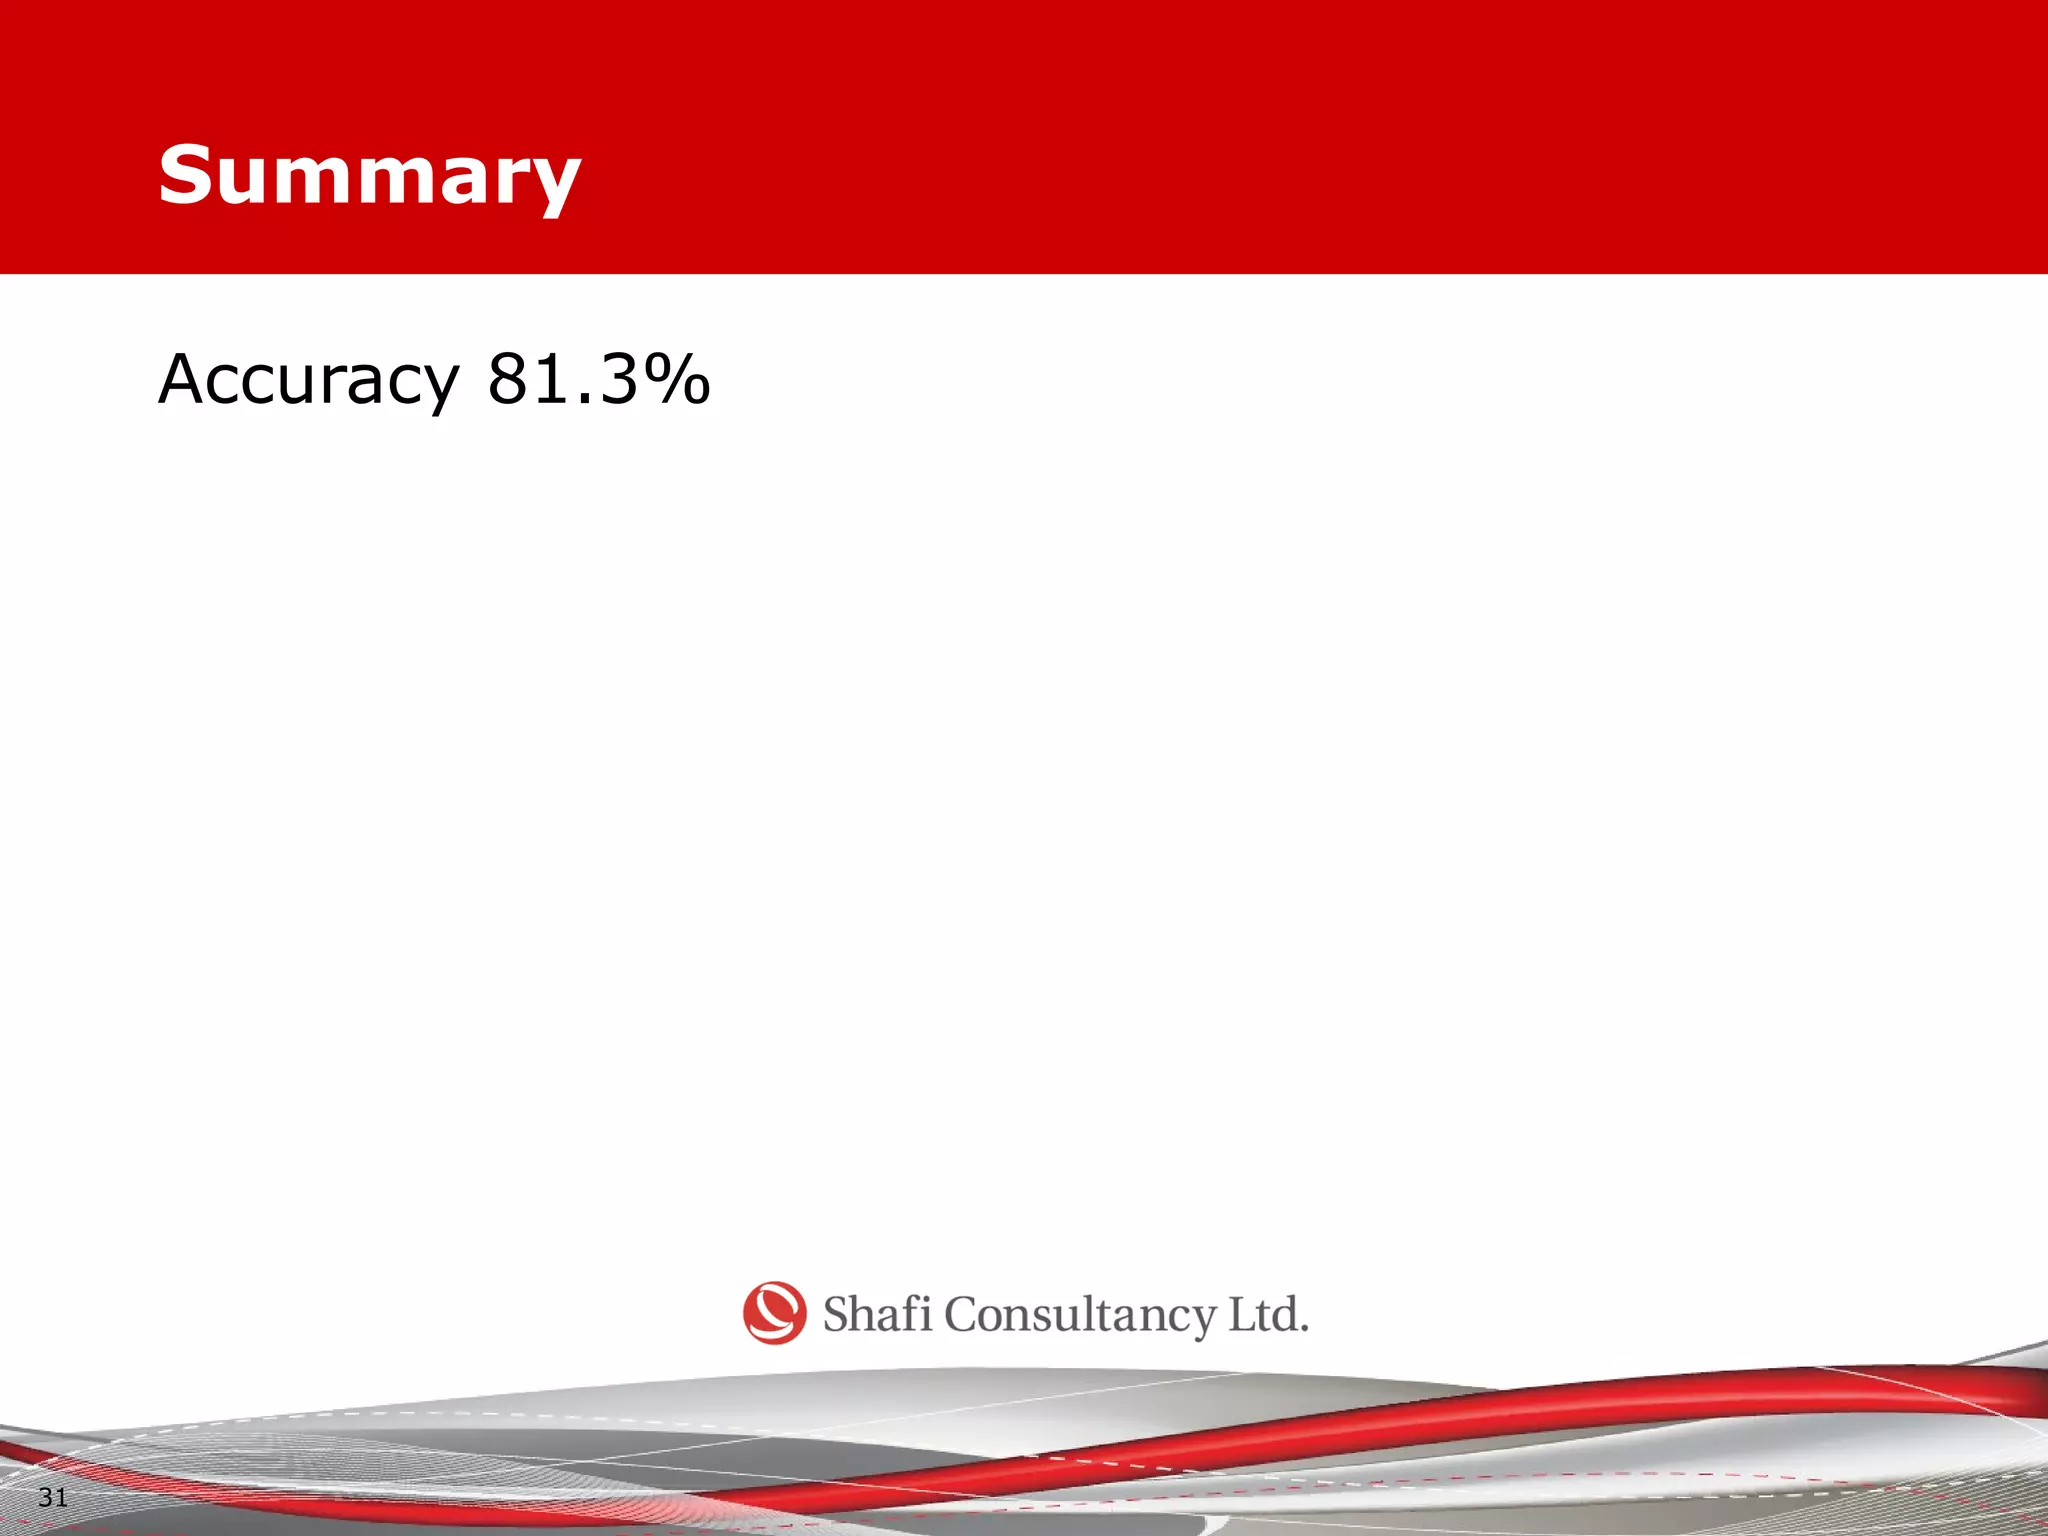
By
MD.
RANA
MAHMUD
Predicting Titanic Passenger
Survival Using Machine Learning
1
Table of Context
• Introduction
• Overview of the problem
• Questions to be answered
• Data Description
• Descriptive Analysis
• Methodology
• Data Processing
• Predicting Survival
• Summary Finding
2
Introduction
I figure life’s a gift and I don’t intend on wasting
it.
-Jack; Titanic Movie
3
Data Description
• Training Data
• 891 passenger data
• 12 variables
• Test Data
• 418 passenger data
• 11 variables
4
Data Dictionary
Variable Definition Key
survival Survival 0 = No, 1 = Yes
pclass Ticket class 1 = 1st, 2 = 2nd, 3 =
3rd
sex Sex
Age Age in years
sibsp # of siblings / spouses
aboard the Titanic
parch # of parents / children
aboard the Titanic
ticket Ticket number
fare Passenger fare
cabin Cabin number
embarked Port of Embarkation C = Cherbourg, Q =
Queenstown, S =
Southampton
5
Data Sample
PassengerIdSurvived Pclass Name Sex Age SibSp Parch Ticket Fare Cabin Embarked
1 0 3 Braund, Mr. Owen Harrismale 22 1 0 A/5 21171 7.25 S
2 1 1 Cumings, Mrs. John Bradley (Florence Briggs Thayer)female 38 1 0 PC 17599 71.2833 C85 C
3 1 3 Heikkinen, Miss. Lainafemale 26 0 0 STON/O2. 31012827.925 S
4 1 1 Futrelle, Mrs. Jacques Heath (Lily May Peel)female 35 1 0 113803 53.1 C123 S
5 0 3 Allen, Mr. William Henrymale 35 0 0 373450 8.05 S
6 0 3 Moran, Mr. Jamesmale 0 0 330877 8.4583 Q
7 0 1 McCarthy, Mr. Timothy Jmale 54 0 0 17463 51.8625 E46 S
8 0 3 Palsson, Master. Gosta Leonardmale 2 3 1 349909 21.075 S
9 1 3 Johnson, Mrs. Oscar W (Elisabeth Vilhelmina Berg)female 27 0 2 347742 11.1333 S
10 1 2 Nasser, Mrs. Nicholas (Adele Achem)female 14 1 0 237736 30.0708 C
11 1 3 Sandstrom, Miss. Marguerite Rutfemale 4 1 1 PP 9549 16.7 G6 S
12 1 1 Bonnell, Miss. Elizabethfemale 58 0 0 113783 26.55 C103 S
13 0 3 Saundercock, Mr. William Henrymale 20 0 0 A/5. 2151 8.05 S
14 0 3 Andersson, Mr. Anders Johanmale 39 1 5 347082 31.275 S
15 0 3 Vestrom, Miss. Hulda Amanda Adolfinafemale 14 0 0 350406 7.8542 S
16 1 2 Hewlett, Mrs. (Mary D Kingcome)female 55 0 0 248706 16 S
17 0 3 Rice, Master. Eugenemale 2 4 1 382652 29.125 Q
18 1 2 Williams, Mr. Charles Eugenemale 0 0 244373 13 S
19 0 3 Vander Planke, Mrs. Julius (Emelia Maria Vandemoortele)female 31 1 0 345763 18 S
6
Titanic Cross Section
7
Overview of the problem?
• Analyzing survival pattern
• Predicting passenger survival using existing
information
8
Descriptive Analysis
9
10
11
12
13
14
15
16
17
18
19
Missing Map in Training Data
20
Methodology
• Decision Tree
• Random Forest
• Analysis of Variance
21
Decision Tree
22
Random Forest
23
Data Processing
• Children – Age < 14
• Mother – Sex = Female & Parch 0 & Age > 18
• Title - First Part of Name before ,
• Deck - Frist Letter of Cabin
• Ticket Group
• Fare < 50 = Low
• Fare > 50 & Fare <= 100 = med1
• Fare > 100 & Fare <= 150 = med2
• Fare >= 150 & Fare <= 500 = high
• Fare > 500 = vhigh
• Family member = SibSp + Parch + 1
• Family Type
• Family Size == 1 = Single
• Family Size > 1 & Family Size <5 = Smaller
• Family Size > 4 = Large
24
Missing Value Replacement
• Age = Pclass + Mother + FamilySize + Sex +
SibSp + Parch + Deck + Fare + Embarked +
Title + FamilyID + FamilySizeGroup +
FamilySize
• Embarked == “” by “S”
• Fare by Median Fare
25
26
Prediction
Call:
randomForest(x = rftrain01, y = rflabel, ntree = 1000, importance =
TRUE)
Type of random forest: classification
Number of trees: 1000
No. of variables tried at each split: 3
OOB estimate of error rate: 17.4%
Confusion matrix:
0 1 class.error
0 491 58 0.1056466
1 97 245 0.2836257
27
28
library(party)
set.seed(291)
fit2 <- cforest(as.factor(Survived) ~ Pclass + Sex + Age + SibSp
+ Parch + Fare + Embarked + Title + FamilySize + FamilyID,
data = train, controls=cforest_unbiased(ntree=2000,
mtry=3))
MyPredict <- predict(fit2, test, OOB=TRUE, type = "response")
predict7th <- data.frame(PassengerId = test$PassengerId,
Survived = MyPredict)
29
Model
Survived = Pclass + Sex + Age + SibSp + Parch +
Fare + Embarked + Title + FamilySize + FamilyID
Ntree = 2000
mtry = 3
30
Summary
Accuracy 81.3%
31
Questions
32
Thank You
33

Titanic Survival Prediction Using Machine Learning

  • 1.
  • 2.
    Table of Context •Introduction • Overview of the problem • Questions to be answered • Data Description • Descriptive Analysis • Methodology • Data Processing • Predicting Survival • Summary Finding 2
  • 3.
    Introduction I figure life’sa gift and I don’t intend on wasting it. -Jack; Titanic Movie 3
  • 4.
    Data Description • TrainingData • 891 passenger data • 12 variables • Test Data • 418 passenger data • 11 variables 4
  • 5.
    Data Dictionary Variable DefinitionKey survival Survival 0 = No, 1 = Yes pclass Ticket class 1 = 1st, 2 = 2nd, 3 = 3rd sex Sex Age Age in years sibsp # of siblings / spouses aboard the Titanic parch # of parents / children aboard the Titanic ticket Ticket number fare Passenger fare cabin Cabin number embarked Port of Embarkation C = Cherbourg, Q = Queenstown, S = Southampton 5
  • 6.
    Data Sample PassengerIdSurvived PclassName Sex Age SibSp Parch Ticket Fare Cabin Embarked 1 0 3 Braund, Mr. Owen Harrismale 22 1 0 A/5 21171 7.25 S 2 1 1 Cumings, Mrs. John Bradley (Florence Briggs Thayer)female 38 1 0 PC 17599 71.2833 C85 C 3 1 3 Heikkinen, Miss. Lainafemale 26 0 0 STON/O2. 31012827.925 S 4 1 1 Futrelle, Mrs. Jacques Heath (Lily May Peel)female 35 1 0 113803 53.1 C123 S 5 0 3 Allen, Mr. William Henrymale 35 0 0 373450 8.05 S 6 0 3 Moran, Mr. Jamesmale 0 0 330877 8.4583 Q 7 0 1 McCarthy, Mr. Timothy Jmale 54 0 0 17463 51.8625 E46 S 8 0 3 Palsson, Master. Gosta Leonardmale 2 3 1 349909 21.075 S 9 1 3 Johnson, Mrs. Oscar W (Elisabeth Vilhelmina Berg)female 27 0 2 347742 11.1333 S 10 1 2 Nasser, Mrs. Nicholas (Adele Achem)female 14 1 0 237736 30.0708 C 11 1 3 Sandstrom, Miss. Marguerite Rutfemale 4 1 1 PP 9549 16.7 G6 S 12 1 1 Bonnell, Miss. Elizabethfemale 58 0 0 113783 26.55 C103 S 13 0 3 Saundercock, Mr. William Henrymale 20 0 0 A/5. 2151 8.05 S 14 0 3 Andersson, Mr. Anders Johanmale 39 1 5 347082 31.275 S 15 0 3 Vestrom, Miss. Hulda Amanda Adolfinafemale 14 0 0 350406 7.8542 S 16 1 2 Hewlett, Mrs. (Mary D Kingcome)female 55 0 0 248706 16 S 17 0 3 Rice, Master. Eugenemale 2 4 1 382652 29.125 Q 18 1 2 Williams, Mr. Charles Eugenemale 0 0 244373 13 S 19 0 3 Vander Planke, Mrs. Julius (Emelia Maria Vandemoortele)female 31 1 0 345763 18 S 6
  • 7.
  • 8.
    Overview of theproblem? • Analyzing survival pattern • Predicting passenger survival using existing information 8
  • 9.
  • 10.
  • 11.
  • 12.
  • 13.
  • 14.
  • 15.
  • 16.
  • 17.
  • 18.
  • 19.
  • 20.
    Missing Map inTraining Data 20
  • 21.
    Methodology • Decision Tree •Random Forest • Analysis of Variance 21
  • 22.
  • 23.
  • 24.
    Data Processing • Children– Age < 14 • Mother – Sex = Female & Parch 0 & Age > 18 • Title - First Part of Name before , • Deck - Frist Letter of Cabin • Ticket Group • Fare < 50 = Low • Fare > 50 & Fare <= 100 = med1 • Fare > 100 & Fare <= 150 = med2 • Fare >= 150 & Fare <= 500 = high • Fare > 500 = vhigh • Family member = SibSp + Parch + 1 • Family Type • Family Size == 1 = Single • Family Size > 1 & Family Size <5 = Smaller • Family Size > 4 = Large 24
  • 25.
    Missing Value Replacement •Age = Pclass + Mother + FamilySize + Sex + SibSp + Parch + Deck + Fare + Embarked + Title + FamilyID + FamilySizeGroup + FamilySize • Embarked == “” by “S” • Fare by Median Fare 25
  • 26.
  • 27.
    Prediction Call: randomForest(x = rftrain01,y = rflabel, ntree = 1000, importance = TRUE) Type of random forest: classification Number of trees: 1000 No. of variables tried at each split: 3 OOB estimate of error rate: 17.4% Confusion matrix: 0 1 class.error 0 491 58 0.1056466 1 97 245 0.2836257 27
  • 28.
  • 29.
    library(party) set.seed(291) fit2 <- cforest(as.factor(Survived)~ Pclass + Sex + Age + SibSp + Parch + Fare + Embarked + Title + FamilySize + FamilyID, data = train, controls=cforest_unbiased(ntree=2000, mtry=3)) MyPredict <- predict(fit2, test, OOB=TRUE, type = "response") predict7th <- data.frame(PassengerId = test$PassengerId, Survived = MyPredict) 29
  • 30.
    Model Survived = Pclass+ Sex + Age + SibSp + Parch + Fare + Embarked + Title + FamilySize + FamilyID Ntree = 2000 mtry = 3 30
  • 31.
  • 32.
  • 33.