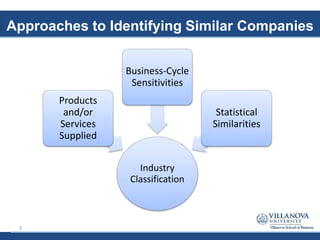
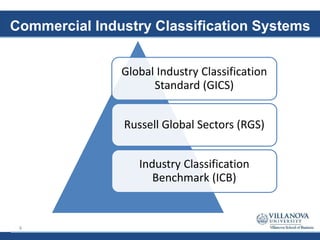
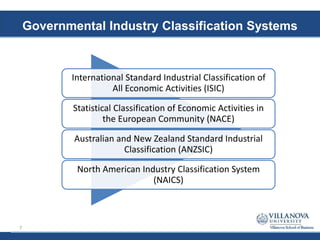
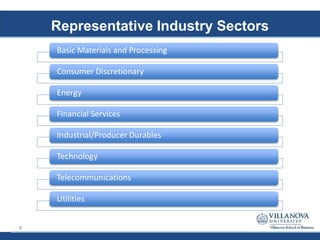
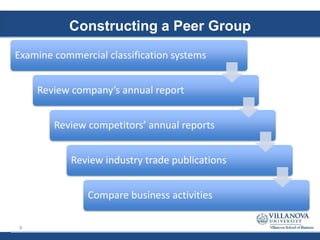
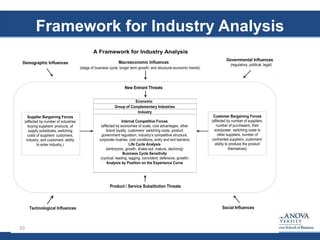
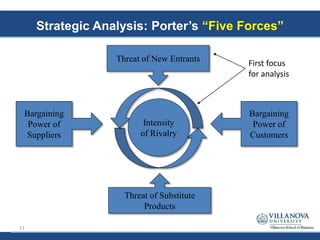
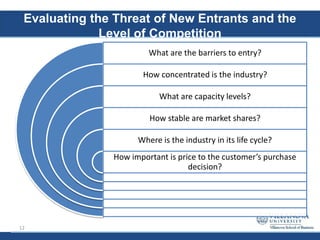
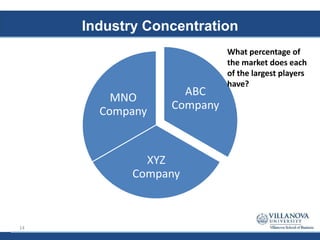
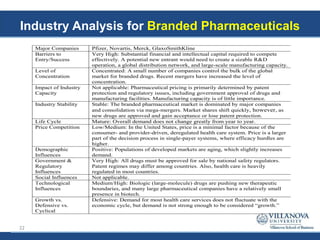
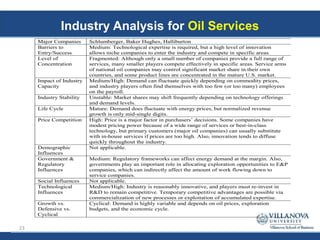
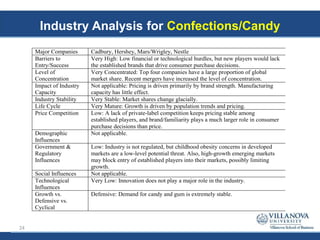
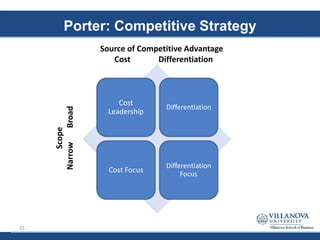
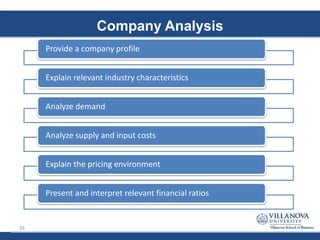
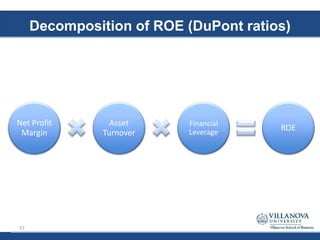
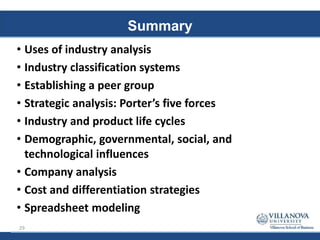
SlideShare a Scribd company logo
1 of 29
Industry Analysis*
Professor Mike Pagano
michael.pagano@villanova.edu
* - These slides are adapted / excerpted from some of the CFA Institute’s
material on this topic.1
Uses of Industry Analysis
Understanding a company’s
business and business
environment
Identifying active equity
investment opportunities
Portfolio performance
attribution
2
Approaches to Identifying Similar Companies
Industry
Classification
Products
and/or
Services
Supplied
Business-Cycle
Sensitivities
Statistical
Similarities
3
Cyclical and Noncyclical Companies
Profits
strongly
correlated
with
economic
activity
Expensive or
non-essential
products
(discretionary
or ‘luxury’)
High
operating
leverage
Cyclical
Company
4
Limitations of Industry and Company Descriptors
Growth
Companies
Cyclical
Industries
Defensive
Industries
Growth
Industries
5
Commercial Industry Classification Systems
Global Industry Classification
Standard (GICS)
Russell Global Sectors (RGS)
Industry Classification
Benchmark (ICB)
6
Governmental Industry Classification Systems
International Standard Industrial Classification of
All Economic Activities (ISIC)
Statistical Classification of Economic Activities in
the European Community (NACE)
Australian and New Zealand Standard Industrial
Classification (ANZSIC)
North American Industry Classification System
(NAICS)
7
Representative Industry Sectors
Basic Materials and Processing
Consumer Discretionary
Energy
Financial Services
Industrial/Producer Durables
Technology
Telecommunications
Utilities
8
Constructing a Peer Group
Examine commercial classification systems
Review company’s annual report
Review competitors’ annual reports
Review industry trade publications
Compare business activities
9
Framework for Industry Analysis
A Framework for Industry Analysis
Economic
Sector
Customer Bargaining Forces
(affected by number of suppliers,
number of purchasers, their
size/power, switching costs to
other suppliers, number of
contracted suppliers, customers’
ability to produce the product
themselves)
Supplier Bargaining Forces
(affected by number of industries
buying suppliers’ products, of
supply substitutes, switching
costs of suppliers’ customers,
industry, and customers’ ability
to enter industry.)
Technological Influences Social Influences
Macroeconomic Influences
(stage of business cycle, longer term growth, and structural economic trends)
Demographic Influences
Governmental Influences
(regulatory, political, legal)
Product / Service Substitution Threats
New Entrant Threats
Group of Complementary Industries
Industry
Internal Competitive Forces
(affected by economies of scale, cost advantages, other
brand loyalty, customers’ switching costs, product
government regulation, industry’s competitive structure,
corporate rivalries, cost conditions, entry and exit barriers)
Life Cycle Analysis
(embryonic, growth, shake-out, mature, declining)
Business Cycle Sensitivity
(cyclical: leading, lagging, coincident; defensive, growth)
Analysis by Position on the Experience Curve
10
Strategic Analysis: Porter’s “Five Forces”
Intensity
of Rivalry
Bargaining
Power of
Customers
Threat of New Entrants
Threat of Substitute
Products
Bargaining
Power of
Suppliers
First focus
for analysis
11
Evaluating the Threat of New Entrants and the
Level of Competition
What are the barriers to entry?
How concentrated is the industry?
What are capacity levels?
How stable are market shares?
Where is the industry in its life cycle?
How important is price to the customer’s purchase
decision?
12
Barriers to Entry
Sustainable
Economic
Profits
Potential for
Greater Pricing
Power
High Barriers
to Entry
13
Industry Concentration
ABC
Company
XYZ
Company
MNO
Company
What percentage of
the market does each
of the largest players
have?
14
Industry Capacity
Tight or
Limited
Capacity
Demand
Exceeds
Supply
Greater
Pricing
Power
15
Market Share Stability
Unstable
Market
Share
Limited
Pricing
Power
16
Industry Life Cycle
Source: Based on Figure 2.4 in Hill and
Source: Based on Figure 2.4 in Hill and Jones (2008).
17
Limitations of Industry Life-Cycle Analysis
Technological
Changes
Regulatory
Changes
Social
Changes
Demographic
Changes
18
Price Competition
Price strongly
affects
customer
purchase
decisions
Competition
within the
industry
19
Macroeconomic Influences on Industry Growth,
Profitability, and Risk
Industry
Growth,
Profitability,
and Risk
Economic
Growth
Interest Rates
Availability of
Credit
Inflation
20
Other Influences on Growth, Profitability, and Risk
• Invention of the microchip
• Digital imaging
Examples of
Technological
Influences
• Baby Boomer generation
• Aging populations
Examples of
Demographic
Influences
• Tax policies and government spending
• Regulation
Examples of
Governmental
Influences
• Changes in tobacco consumption
• Women in the workforce
Examples of Social
Influences
21
Industry Analysis for Branded Pharmaceuticals
Major Companies Pfizer, Novartis, Merck, GlaxoSmithKline
Barriers to
Entry/Success
Very High: Substantial financial and intellectual capital required to compete
effectively. A potential new entrant would need to create a sizable R&D
operation, a global distribution network, and large-scale manufacturing capacity.
Level of
Concentration
Concentrated: A small number of companies control the bulk of the global
market for branded drugs. Recent mergers have increased the level of
concentration.
Impact of Industry
Capacity
Not applicable: Pharmaceutical pricing is primarily determined by patent
protection and regulatory issues, including government approval of drugs and
manufacturing facilities. Manufacturing capacity is of little importance.
Industry Stability Stable: The branded pharmaceutical market is dominated by major companies
and consolidation via mega-mergers. Market shares shift quickly, however, as
new drugs are approved and gain acceptance or lose patent protection.
Life Cycle Mature: Overall demand does not change greatly from year to year.
Price Competition Low/Medium: In the United States, price is a minimal factor because of the
consumer- and provider-driven, deregulated health care system. Price is a larger
part of the decision process in single-payer systems, where efficacy hurdles are
higher.
Demographic
Influences
Positive: Populations of developed markets are aging, which slightly increases
demand.
Government &
Regulatory
Influences
Very High: All drugs must be approved for sale by national safety regulators.
Patent regimes may differ among countries. Also, health care is heavily
regulated in most countries.
Social Influences Not applicable.
Technological
Influences
Medium/High: Biologic (large-molecule) drugs are pushing new therapeutic
boundaries, and many large pharmaceutical companies have a relatively small
presence in biotech.
Growth vs.
Defensive vs.
Cyclical
Defensive: Demand for most health care services does not fluctuate with the
economic cycle, but demand is not strong enough to be considered “growth.”
22
Industry Analysis for Oil Services
Major Companies Schlumberger, Baker Hughes, Halliburton
Barriers to
Entry/Success
Medium: Technological expertise is required, but a high level of innovation
allows niche companies to enter the industry and compete in specific areas.
Level of
Concentration
Fragmented: Although only a small number of companies provide a full range of
services, many smaller players compete effectively in specific areas. Service arms
of national oil companies may control significant market share in their own
countries, and some product lines are concentrated in the mature U.S. market.
Impact of Industry
Capacity
Medium/High: Demand can fluctuate quickly depending on commodity prices,
and industry players often find themselves with too few (or too many) employees
on the payroll.
Industry Stability Unstable: Market shares may shift frequently depending on technology offerings
and demand levels.
Life Cycle Mature: Demand does fluctuate with energy prices, but normalized revenue
growth is only mid-single digits.
Price Competition High: Price is a major factor in purchasers’ decisions. Some companies have
modest pricing power because of a wide range of services or best-in-class
technology, but primary customers (major oil companies) can usually substitute
with in-house services if prices are too high. Also, innovation tends to diffuse
quickly throughout the industry.
Demographic
Influences
Not applicable.
Government &
Regulatory
Influences
Medium: Regulatory frameworks can affect energy demand at the margin. Also,
governments play an important role in allocating exploration opportunities to E&P
companies, which can indirectly affect the amount of work flowing down to
service companies.
Social Influences Not applicable.
Technological
Influences
Medium/High: Industry is reasonably innovative, and players must re-invest in
R&D to remain competitive. Temporary competitive advantages are possible via
commercialization of new processes or exploitation of accumulated expertise.
Growth vs.
Defensive vs.
Cyclical
Cyclical: Demand is highly variable and depends on oil prices, exploration
budgets, and the economic cycle.
23
Industry Analysis for Confections/Candy
Major Companies Cadbury, Hershey, Mars/Wrigley, Nestle
Barriers to
Entry/Success
Very High: Low financial or technological hurdles, but new players would lack
the established brands that drive consumer purchase decisions.
Level of
Concentration
Very Concentrated: Top four companies have a large proportion of global
market share. Recent mergers have increased the level of concentration.
Impact of Industry
Capacity
Not applicable: Pricing is driven primarily by brand strength. Manufacturing
capacity has little effect.
Industry Stability Very Stable: Market shares change glacially.
Life Cycle Very Mature: Growth is driven by population trends and pricing.
Price Competition Low: A lack of private-label competition keeps pricing stable among
established players, and brand/familiarity plays a much larger role in consumer
purchase decisions than price.
Demographic
Influences
Not applicable.
Government &
Regulatory
Influences
Low: Industry is not regulated, but childhood obesity concerns in developed
markets are a low-level potential threat. Also, high-growth emerging markets
may block entry of established players into their markets, possibly limiting
growth.
Social Influences Not applicable.
Technological
Influences
Very Low: Innovation does not play a major role in the industry.
Growth vs.
Defensive vs.
Cyclical
Defensive: Demand for candy and gum is extremely stable.
24
Porter: Competitive Strategy
Cost
Leadership
Differentiation
Cost Focus
Differentiation
Focus
Scope
NarrowBroad
Source of Competitive Advantage
Cost Differentiation
25
Company Analysis
Provide a company profile
Explain relevant industry characteristics
Analyze demand
Analyze supply and input costs
Explain the pricing environment
Present and interpret relevant financial ratios
26
Decomposition of ROE (DuPont ratios)
Net Profit
Margin
Asset
Turnover
Financial
Leverage
ROE
27
Spreadsheet Modeling
Expected
Optimistic
Pessimistic
28
Summary
• Uses of industry analysis
• Industry classification systems
• Establishing a peer group
• Strategic analysis: Porter’s five forces
• Industry and product life cycles
• Demographic, governmental, social, and
technological influences
• Company analysis
• Cost and differentiation strategies
• Spreadsheet modeling
29

More Related Content

What's hot

Competitive dimensions - strategic management - Manu Melwin Joy
Competitive dimensions - strategic management - Manu Melwin JoyCompetitive dimensions - strategic management - Manu Melwin Joy
Competitive dimensions - strategic management - Manu Melwin Joymanumelwin
 
Porter's Generic Strategies
Porter's Generic Strategies Porter's Generic Strategies
Porter's Generic Strategies Ryan Braganza
 
Competitive advantage of nations
Competitive advantage of nationsCompetitive advantage of nations
Competitive advantage of nationsBrahm Sharma
 
Target costing Prepared By Melwin Mathew
Target costing Prepared By Melwin MathewTarget costing Prepared By Melwin Mathew
Target costing Prepared By Melwin MathewMelwin Mathew
 
Michel Porter's five forces model
Michel Porter's five forces modelMichel Porter's five forces model
Michel Porter's five forces modelDebasis Behera
 
Pestle analysis
Pestle analysisPestle analysis
Pestle analysisSelman Ay
 
Competetive advantage
Competetive advantageCompetetive advantage
Competetive advantageSumit Rai
 
Pestle analysis
Pestle analysisPestle analysis
Pestle analysisCOEPD HR
 
10 strategic advantage profile
10 strategic advantage profile10 strategic advantage profile
10 strategic advantage profileTaranpreet Kaur
 
Porter’s Five Forces Model of Competitive Analysis
Porter’s Five Forces Model of Competitive AnalysisPorter’s Five Forces Model of Competitive Analysis
Porter’s Five Forces Model of Competitive AnalysisHitaksha Puthran
 
Methods and techniques of organization appraisal
Methods and techniques of organization appraisalMethods and techniques of organization appraisal
Methods and techniques of organization appraisallakhwinder Singh
 
Porter's national diamond model
Porter's national diamond modelPorter's national diamond model
Porter's national diamond modelAnil Kumar Sharma
 
Environmental Threat Opportunity Profile (ETOP)
Environmental Threat Opportunity Profile (ETOP)Environmental Threat Opportunity Profile (ETOP)
Environmental Threat Opportunity Profile (ETOP)Arun Gupta
 

What's hot (20)

Competitive dimensions - strategic management - Manu Melwin Joy
Competitive dimensions - strategic management - Manu Melwin JoyCompetitive dimensions - strategic management - Manu Melwin Joy
Competitive dimensions - strategic management - Manu Melwin Joy
 
Porter's Generic Strategies
Porter's Generic Strategies Porter's Generic Strategies
Porter's Generic Strategies
 
Competitive advantage of nations
Competitive advantage of nationsCompetitive advantage of nations
Competitive advantage of nations
 
Global entry strategies
Global entry strategiesGlobal entry strategies
Global entry strategies
 
Target costing Prepared By Melwin Mathew
Target costing Prepared By Melwin MathewTarget costing Prepared By Melwin Mathew
Target costing Prepared By Melwin Mathew
 
Michel Porter's five forces model
Michel Porter's five forces modelMichel Porter's five forces model
Michel Porter's five forces model
 
Industry analysis
Industry analysisIndustry analysis
Industry analysis
 
Pestle analysis
Pestle analysisPestle analysis
Pestle analysis
 
Ge9 final ppt
Ge9 final pptGe9 final ppt
Ge9 final ppt
 
BCG Matrix
BCG MatrixBCG Matrix
BCG Matrix
 
Competetive advantage
Competetive advantageCompetetive advantage
Competetive advantage
 
Pestle analysis
Pestle analysisPestle analysis
Pestle analysis
 
10 strategic advantage profile
10 strategic advantage profile10 strategic advantage profile
10 strategic advantage profile
 
Porter’s Five Forces Model of Competitive Analysis
Porter’s Five Forces Model of Competitive AnalysisPorter’s Five Forces Model of Competitive Analysis
Porter’s Five Forces Model of Competitive Analysis
 
Methods and techniques of organization appraisal
Methods and techniques of organization appraisalMethods and techniques of organization appraisal
Methods and techniques of organization appraisal
 
Michael porter 5 force model
Michael porter 5 force modelMichael porter 5 force model
Michael porter 5 force model
 
Sap
SapSap
Sap
 
Ge matrix
Ge matrixGe matrix
Ge matrix
 
Porter's national diamond model
Porter's national diamond modelPorter's national diamond model
Porter's national diamond model
 
Environmental Threat Opportunity Profile (ETOP)
Environmental Threat Opportunity Profile (ETOP)Environmental Threat Opportunity Profile (ETOP)
Environmental Threat Opportunity Profile (ETOP)
 

Viewers also liked

IBM Smarter Commerce - A Strategic Analysis
IBM Smarter Commerce - A Strategic AnalysisIBM Smarter Commerce - A Strategic Analysis
IBM Smarter Commerce - A Strategic AnalysisMadhuranath R
 
Chapter-5 Industry and competitor analysis
Chapter-5 Industry and competitor analysisChapter-5 Industry and competitor analysis
Chapter-5 Industry and competitor analysisAfzaal Ali
 
Market opportunity analysis
Market opportunity analysisMarket opportunity analysis
Market opportunity analysisgihan aboueleish
 
Hrm promotion & transfer
Hrm promotion & transferHrm promotion & transfer
Hrm promotion & transferRahul Pujari
 
3 macro environment+demand analysis sf
3 macro environment+demand analysis sf3 macro environment+demand analysis sf
3 macro environment+demand analysis sfSilvio Filippi
 
MBA 8480 - Portfolio Theory and Asset Pricing
MBA 8480 - Portfolio Theory and Asset PricingMBA 8480 - Portfolio Theory and Asset Pricing
MBA 8480 - Portfolio Theory and Asset PricingWildcatSchoolofBusiness
 
PESTLE analysis on citigroup
PESTLE analysis on citigroupPESTLE analysis on citigroup
PESTLE analysis on citigroupBalu samy
 
Industry Analysis: the bigger picture
Industry Analysis: the bigger pictureIndustry Analysis: the bigger picture
Industry Analysis: the bigger pictureDavid Mayes
 
Customer preference for volkswagen cars
Customer preference for volkswagen carsCustomer preference for volkswagen cars
Customer preference for volkswagen carsSwamit Gupta
 
Marketing Strategy of Volkswagen Beetle
Marketing Strategy of Volkswagen BeetleMarketing Strategy of Volkswagen Beetle
Marketing Strategy of Volkswagen BeetleAbhinav Kumar
 
Nintendo Ltd, strategic management of change, 2012
Nintendo Ltd, strategic management of change, 2012Nintendo Ltd, strategic management of change, 2012
Nintendo Ltd, strategic management of change, 2012Rei Lynn Hayashi
 
Product Discovery and Delivery by Odd-e (Thailand). Build the right thing at ...
Product Discovery and Delivery by Odd-e (Thailand). Build the right thing at ...Product Discovery and Delivery by Odd-e (Thailand). Build the right thing at ...
Product Discovery and Delivery by Odd-e (Thailand). Build the right thing at ...Chanita Anuwong
 
Patrick Shields Digitising the Public Sector
Patrick Shields   Digitising the Public SectorPatrick Shields   Digitising the Public Sector
Patrick Shields Digitising the Public SectorSoftware AG South Africa
 
同玩節海報事件
同玩節海報事件同玩節海報事件
同玩節海報事件lalacamp07
 

Viewers also liked (20)

MBA 8480 - Valuation Principles
MBA 8480 - Valuation PrinciplesMBA 8480 - Valuation Principles
MBA 8480 - Valuation Principles
 
IBM Smarter Commerce - A Strategic Analysis
IBM Smarter Commerce - A Strategic AnalysisIBM Smarter Commerce - A Strategic Analysis
IBM Smarter Commerce - A Strategic Analysis
 
Sales Promotion
Sales Promotion Sales Promotion
Sales Promotion
 
Chapter-5 Industry and competitor analysis
Chapter-5 Industry and competitor analysisChapter-5 Industry and competitor analysis
Chapter-5 Industry and competitor analysis
 
Market opportunity analysis
Market opportunity analysisMarket opportunity analysis
Market opportunity analysis
 
Hrm promotion & transfer
Hrm promotion & transferHrm promotion & transfer
Hrm promotion & transfer
 
3 macro environment+demand analysis sf
3 macro environment+demand analysis sf3 macro environment+demand analysis sf
3 macro environment+demand analysis sf
 
MBA 8480 - Portfolio Theory and Asset Pricing
MBA 8480 - Portfolio Theory and Asset PricingMBA 8480 - Portfolio Theory and Asset Pricing
MBA 8480 - Portfolio Theory and Asset Pricing
 
inflation and its current relevance
inflation and its current relevanceinflation and its current relevance
inflation and its current relevance
 
PESTLE analysis on citigroup
PESTLE analysis on citigroupPESTLE analysis on citigroup
PESTLE analysis on citigroup
 
Industry Analysis: the bigger picture
Industry Analysis: the bigger pictureIndustry Analysis: the bigger picture
Industry Analysis: the bigger picture
 
Tourist Area Lifecycle
Tourist Area LifecycleTourist Area Lifecycle
Tourist Area Lifecycle
 
External analysis
External analysisExternal analysis
External analysis
 
Customer preference for volkswagen cars
Customer preference for volkswagen carsCustomer preference for volkswagen cars
Customer preference for volkswagen cars
 
Marketing Strategy of Volkswagen Beetle
Marketing Strategy of Volkswagen BeetleMarketing Strategy of Volkswagen Beetle
Marketing Strategy of Volkswagen Beetle
 
Nintendo Ltd, strategic management of change, 2012
Nintendo Ltd, strategic management of change, 2012Nintendo Ltd, strategic management of change, 2012
Nintendo Ltd, strategic management of change, 2012
 
Product Discovery and Delivery by Odd-e (Thailand). Build the right thing at ...
Product Discovery and Delivery by Odd-e (Thailand). Build the right thing at ...Product Discovery and Delivery by Odd-e (Thailand). Build the right thing at ...
Product Discovery and Delivery by Odd-e (Thailand). Build the right thing at ...
 
Patrick Shields Digitising the Public Sector
Patrick Shields   Digitising the Public SectorPatrick Shields   Digitising the Public Sector
Patrick Shields Digitising the Public Sector
 
同玩節海報事件
同玩節海報事件同玩節海報事件
同玩節海報事件
 
4º básico a semana 25 abril al 29 abril
4º básico a  semana 25 abril  al 29 abril4º básico a  semana 25 abril  al 29 abril
4º básico a semana 25 abril al 29 abril
 

Similar to MBA 8480 - Industry Analysis

environmental models
  environmental models  environmental models
environmental modelsErslan Ashraf
 
2012 Aerospace & Defense Market Survey
2012 Aerospace & Defense Market Survey2012 Aerospace & Defense Market Survey
2012 Aerospace & Defense Market SurveyDouglas Burdett
 
bigshift_mediaentertainment_11_09
bigshift_mediaentertainment_11_09bigshift_mediaentertainment_11_09
bigshift_mediaentertainment_11_09Gyula Kangiszer
 
Whitepaper: Patent strategies in the 2012 economic environment
Whitepaper: Patent strategies in the 2012 economic environmentWhitepaper: Patent strategies in the 2012 economic environment
Whitepaper: Patent strategies in the 2012 economic environmentSagentia
 
Medical_Devices_Industry
Medical_Devices_IndustryMedical_Devices_Industry
Medical_Devices_IndustryVirendra K
 
environmental influences in business
environmental influences in businessenvironmental influences in business
environmental influences in businesskscnair
 
Retail bank sales and services unit3
Retail bank sales and services unit3Retail bank sales and services unit3
Retail bank sales and services unit3UNBFS
 
Business Environment Analysis
Business Environment AnalysisBusiness Environment Analysis
Business Environment AnalysisNGANG PEREZ
 
Strategic Management Ch03
Strategic Management Ch03Strategic Management Ch03
Strategic Management Ch03Chuong Nguyen
 
The New Chemical Era in China
The New Chemical Era in ChinaThe New Chemical Era in China
The New Chemical Era in ChinaSolidiance
 
INDUSTRY ANALYSIS One of the major competences that str.docx
INDUSTRY ANALYSIS  One of the major competences that str.docxINDUSTRY ANALYSIS  One of the major competences that str.docx
INDUSTRY ANALYSIS One of the major competences that str.docxcarliotwaycave
 

Similar to MBA 8480 - Industry Analysis (20)

Chapter 3
Chapter 3Chapter 3
Chapter 3
 
environmental models
  environmental models  environmental models
environmental models
 
Concept 03
Concept 03Concept 03
Concept 03
 
2012 Aerospace & Defense Market Survey
2012 Aerospace & Defense Market Survey2012 Aerospace & Defense Market Survey
2012 Aerospace & Defense Market Survey
 
General environment
General environmentGeneral environment
General environment
 
Factors
FactorsFactors
Factors
 
bigshift_mediaentertainment_11_09
bigshift_mediaentertainment_11_09bigshift_mediaentertainment_11_09
bigshift_mediaentertainment_11_09
 
Whitepaper: Patent strategies in the 2012 economic environment
Whitepaper: Patent strategies in the 2012 economic environmentWhitepaper: Patent strategies in the 2012 economic environment
Whitepaper: Patent strategies in the 2012 economic environment
 
Environmental scanning
Environmental scanningEnvironmental scanning
Environmental scanning
 
Chap003
Chap003Chap003
Chap003
 
Medical_Devices_Industry
Medical_Devices_IndustryMedical_Devices_Industry
Medical_Devices_Industry
 
External
ExternalExternal
External
 
environmental influences in business
environmental influences in businessenvironmental influences in business
environmental influences in business
 
Retail bank sales and services unit3
Retail bank sales and services unit3Retail bank sales and services unit3
Retail bank sales and services unit3
 
Business Environment Analysis
Business Environment AnalysisBusiness Environment Analysis
Business Environment Analysis
 
Sm module (2)
Sm module (2)Sm module (2)
Sm module (2)
 
Strategic Management Ch03
Strategic Management Ch03Strategic Management Ch03
Strategic Management Ch03
 
The New Chemical Era in China
The New Chemical Era in ChinaThe New Chemical Era in China
The New Chemical Era in China
 
Business Environment.ppt
Business Environment.pptBusiness Environment.ppt
Business Environment.ppt
 
INDUSTRY ANALYSIS One of the major competences that str.docx
INDUSTRY ANALYSIS  One of the major competences that str.docxINDUSTRY ANALYSIS  One of the major competences that str.docx
INDUSTRY ANALYSIS One of the major competences that str.docx
 

Recently uploaded

Ch 4 investment Intermediate financial Accounting
Ch 4 investment Intermediate financial AccountingCh 4 investment Intermediate financial Accounting
Ch 4 investment Intermediate financial AccountingAbdi118682
 
Governor Olli Rehn: Dialling back monetary restraint
Governor Olli Rehn: Dialling back monetary restraintGovernor Olli Rehn: Dialling back monetary restraint
Governor Olli Rehn: Dialling back monetary restraintSuomen Pankki
 
(办理学位证)加拿大萨省大学毕业证成绩单原版一比一
(办理学位证)加拿大萨省大学毕业证成绩单原版一比一(办理学位证)加拿大萨省大学毕业证成绩单原版一比一
(办理学位证)加拿大萨省大学毕业证成绩单原版一比一S SDS
 
Stock Market Brief Deck FOR 4/17 video.pdf
Stock Market Brief Deck FOR 4/17 video.pdfStock Market Brief Deck FOR 4/17 video.pdf
Stock Market Brief Deck FOR 4/17 video.pdfMichael Silva
 
PMFBY , Pradhan Mantri Fasal bima yojna
PMFBY , Pradhan Mantri  Fasal bima yojnaPMFBY , Pradhan Mantri  Fasal bima yojna
PMFBY , Pradhan Mantri Fasal bima yojnaDharmendra Kumar
 
Economic Risk Factor Update: April 2024 [SlideShare]
Economic Risk Factor Update: April 2024 [SlideShare]Economic Risk Factor Update: April 2024 [SlideShare]
Economic Risk Factor Update: April 2024 [SlideShare]Commonwealth
 
Bladex Earnings Call Presentation 1Q2024
Bladex Earnings Call Presentation 1Q2024Bladex Earnings Call Presentation 1Q2024
Bladex Earnings Call Presentation 1Q2024Bladex
 
How Automation is Driving Efficiency Through the Last Mile of Reporting
How Automation is Driving Efficiency Through the Last Mile of ReportingHow Automation is Driving Efficiency Through the Last Mile of Reporting
How Automation is Driving Efficiency Through the Last Mile of ReportingAggregage
 
House of Commons ; CDC schemes overview document
House of Commons ; CDC schemes overview documentHouse of Commons ; CDC schemes overview document
House of Commons ; CDC schemes overview documentHenry Tapper
 
Quantitative Analysis of Retail Sector Companies
Quantitative Analysis of Retail Sector CompaniesQuantitative Analysis of Retail Sector Companies
Quantitative Analysis of Retail Sector Companiesprashantbhati354
 
NO1 WorldWide Love marriage specialist baba ji Amil Baba Kala ilam powerful v...
NO1 WorldWide Love marriage specialist baba ji Amil Baba Kala ilam powerful v...NO1 WorldWide Love marriage specialist baba ji Amil Baba Kala ilam powerful v...
NO1 WorldWide Love marriage specialist baba ji Amil Baba Kala ilam powerful v...Amil baba
 
Stock Market Brief Deck for "this does not happen often".pdf
Stock Market Brief Deck for "this does not happen often".pdfStock Market Brief Deck for "this does not happen often".pdf
Stock Market Brief Deck for "this does not happen often".pdfMichael Silva
 
magnetic-pensions-a-new-blueprint-for-the-dc-landscape.pdf
magnetic-pensions-a-new-blueprint-for-the-dc-landscape.pdfmagnetic-pensions-a-new-blueprint-for-the-dc-landscape.pdf
magnetic-pensions-a-new-blueprint-for-the-dc-landscape.pdfHenry Tapper
 
Stock Market Brief Deck for 4/24/24 .pdf
Stock Market Brief Deck for 4/24/24 .pdfStock Market Brief Deck for 4/24/24 .pdf
Stock Market Brief Deck for 4/24/24 .pdfMichael Silva
 
letter-from-the-chair-to-the-fca-relating-to-british-steel-pensions-scheme-15...
letter-from-the-chair-to-the-fca-relating-to-british-steel-pensions-scheme-15...letter-from-the-chair-to-the-fca-relating-to-british-steel-pensions-scheme-15...
letter-from-the-chair-to-the-fca-relating-to-british-steel-pensions-scheme-15...Henry Tapper
 
fca-bsps-decision-letter-redacted (1).pdf
fca-bsps-decision-letter-redacted (1).pdffca-bsps-decision-letter-redacted (1).pdf
fca-bsps-decision-letter-redacted (1).pdfHenry Tapper
 
Economics, Commerce and Trade Management: An International Journal (ECTIJ)
Economics, Commerce and Trade Management: An International Journal (ECTIJ)Economics, Commerce and Trade Management: An International Journal (ECTIJ)
Economics, Commerce and Trade Management: An International Journal (ECTIJ)ECTIJ
 
Classical Theory of Macroeconomics by Adam Smith
Classical Theory of Macroeconomics by Adam SmithClassical Theory of Macroeconomics by Adam Smith
Classical Theory of Macroeconomics by Adam SmithAdamYassin2
 
call girls in Nand Nagri (DELHI) 🔝 >༒9953330565🔝 genuine Escort Service 🔝✔️✔️
call girls in  Nand Nagri (DELHI) 🔝 >༒9953330565🔝 genuine Escort Service 🔝✔️✔️call girls in  Nand Nagri (DELHI) 🔝 >༒9953330565🔝 genuine Escort Service 🔝✔️✔️
call girls in Nand Nagri (DELHI) 🔝 >༒9953330565🔝 genuine Escort Service 🔝✔️✔️9953056974 Low Rate Call Girls In Saket, Delhi NCR
 
chapter_2.ppt The labour market definitions and trends
chapter_2.ppt The labour market definitions and trendschapter_2.ppt The labour market definitions and trends
chapter_2.ppt The labour market definitions and trendslemlemtesfaye192
 

Recently uploaded (20)

Ch 4 investment Intermediate financial Accounting
Ch 4 investment Intermediate financial AccountingCh 4 investment Intermediate financial Accounting
Ch 4 investment Intermediate financial Accounting
 
Governor Olli Rehn: Dialling back monetary restraint
Governor Olli Rehn: Dialling back monetary restraintGovernor Olli Rehn: Dialling back monetary restraint
Governor Olli Rehn: Dialling back monetary restraint
 
(办理学位证)加拿大萨省大学毕业证成绩单原版一比一
(办理学位证)加拿大萨省大学毕业证成绩单原版一比一(办理学位证)加拿大萨省大学毕业证成绩单原版一比一
(办理学位证)加拿大萨省大学毕业证成绩单原版一比一
 
Stock Market Brief Deck FOR 4/17 video.pdf
Stock Market Brief Deck FOR 4/17 video.pdfStock Market Brief Deck FOR 4/17 video.pdf
Stock Market Brief Deck FOR 4/17 video.pdf
 
PMFBY , Pradhan Mantri Fasal bima yojna
PMFBY , Pradhan Mantri  Fasal bima yojnaPMFBY , Pradhan Mantri  Fasal bima yojna
PMFBY , Pradhan Mantri Fasal bima yojna
 
Economic Risk Factor Update: April 2024 [SlideShare]
Economic Risk Factor Update: April 2024 [SlideShare]Economic Risk Factor Update: April 2024 [SlideShare]
Economic Risk Factor Update: April 2024 [SlideShare]
 
Bladex Earnings Call Presentation 1Q2024
Bladex Earnings Call Presentation 1Q2024Bladex Earnings Call Presentation 1Q2024
Bladex Earnings Call Presentation 1Q2024
 
How Automation is Driving Efficiency Through the Last Mile of Reporting
How Automation is Driving Efficiency Through the Last Mile of ReportingHow Automation is Driving Efficiency Through the Last Mile of Reporting
How Automation is Driving Efficiency Through the Last Mile of Reporting
 
House of Commons ; CDC schemes overview document
House of Commons ; CDC schemes overview documentHouse of Commons ; CDC schemes overview document
House of Commons ; CDC schemes overview document
 
Quantitative Analysis of Retail Sector Companies
Quantitative Analysis of Retail Sector CompaniesQuantitative Analysis of Retail Sector Companies
Quantitative Analysis of Retail Sector Companies
 
NO1 WorldWide Love marriage specialist baba ji Amil Baba Kala ilam powerful v...
NO1 WorldWide Love marriage specialist baba ji Amil Baba Kala ilam powerful v...NO1 WorldWide Love marriage specialist baba ji Amil Baba Kala ilam powerful v...
NO1 WorldWide Love marriage specialist baba ji Amil Baba Kala ilam powerful v...
 
Stock Market Brief Deck for "this does not happen often".pdf
Stock Market Brief Deck for "this does not happen often".pdfStock Market Brief Deck for "this does not happen often".pdf
Stock Market Brief Deck for "this does not happen often".pdf
 
magnetic-pensions-a-new-blueprint-for-the-dc-landscape.pdf
magnetic-pensions-a-new-blueprint-for-the-dc-landscape.pdfmagnetic-pensions-a-new-blueprint-for-the-dc-landscape.pdf
magnetic-pensions-a-new-blueprint-for-the-dc-landscape.pdf
 
Stock Market Brief Deck for 4/24/24 .pdf
Stock Market Brief Deck for 4/24/24 .pdfStock Market Brief Deck for 4/24/24 .pdf
Stock Market Brief Deck for 4/24/24 .pdf
 
letter-from-the-chair-to-the-fca-relating-to-british-steel-pensions-scheme-15...
letter-from-the-chair-to-the-fca-relating-to-british-steel-pensions-scheme-15...letter-from-the-chair-to-the-fca-relating-to-british-steel-pensions-scheme-15...
letter-from-the-chair-to-the-fca-relating-to-british-steel-pensions-scheme-15...
 
fca-bsps-decision-letter-redacted (1).pdf
fca-bsps-decision-letter-redacted (1).pdffca-bsps-decision-letter-redacted (1).pdf
fca-bsps-decision-letter-redacted (1).pdf
 
Economics, Commerce and Trade Management: An International Journal (ECTIJ)
Economics, Commerce and Trade Management: An International Journal (ECTIJ)Economics, Commerce and Trade Management: An International Journal (ECTIJ)
Economics, Commerce and Trade Management: An International Journal (ECTIJ)
 
Classical Theory of Macroeconomics by Adam Smith
Classical Theory of Macroeconomics by Adam SmithClassical Theory of Macroeconomics by Adam Smith
Classical Theory of Macroeconomics by Adam Smith
 
call girls in Nand Nagri (DELHI) 🔝 >༒9953330565🔝 genuine Escort Service 🔝✔️✔️
call girls in  Nand Nagri (DELHI) 🔝 >༒9953330565🔝 genuine Escort Service 🔝✔️✔️call girls in  Nand Nagri (DELHI) 🔝 >༒9953330565🔝 genuine Escort Service 🔝✔️✔️
call girls in Nand Nagri (DELHI) 🔝 >༒9953330565🔝 genuine Escort Service 🔝✔️✔️
 
chapter_2.ppt The labour market definitions and trends
chapter_2.ppt The labour market definitions and trendschapter_2.ppt The labour market definitions and trends
chapter_2.ppt The labour market definitions and trends
 

MBA 8480 - Industry Analysis

  • 1. Industry Analysis* Professor Mike Pagano michael.pagano@villanova.edu * - These slides are adapted / excerpted from some of the CFA Institute’s material on this topic.1
  • 2. Uses of Industry Analysis Understanding a company’s business and business environment Identifying active equity investment opportunities Portfolio performance attribution 2
  • 3. Approaches to Identifying Similar Companies Industry Classification Products and/or Services Supplied Business-Cycle Sensitivities Statistical Similarities 3
  • 4. Cyclical and Noncyclical Companies Profits strongly correlated with economic activity Expensive or non-essential products (discretionary or ‘luxury’) High operating leverage Cyclical Company 4
  • 5. Limitations of Industry and Company Descriptors Growth Companies Cyclical Industries Defensive Industries Growth Industries 5
  • 6. Commercial Industry Classification Systems Global Industry Classification Standard (GICS) Russell Global Sectors (RGS) Industry Classification Benchmark (ICB) 6
  • 7. Governmental Industry Classification Systems International Standard Industrial Classification of All Economic Activities (ISIC) Statistical Classification of Economic Activities in the European Community (NACE) Australian and New Zealand Standard Industrial Classification (ANZSIC) North American Industry Classification System (NAICS) 7
  • 8. Representative Industry Sectors Basic Materials and Processing Consumer Discretionary Energy Financial Services Industrial/Producer Durables Technology Telecommunications Utilities 8
  • 9. Constructing a Peer Group Examine commercial classification systems Review company’s annual report Review competitors’ annual reports Review industry trade publications Compare business activities 9
  • 10. Framework for Industry Analysis A Framework for Industry Analysis Economic Sector Customer Bargaining Forces (affected by number of suppliers, number of purchasers, their size/power, switching costs to other suppliers, number of contracted suppliers, customers’ ability to produce the product themselves) Supplier Bargaining Forces (affected by number of industries buying suppliers’ products, of supply substitutes, switching costs of suppliers’ customers, industry, and customers’ ability to enter industry.) Technological Influences Social Influences Macroeconomic Influences (stage of business cycle, longer term growth, and structural economic trends) Demographic Influences Governmental Influences (regulatory, political, legal) Product / Service Substitution Threats New Entrant Threats Group of Complementary Industries Industry Internal Competitive Forces (affected by economies of scale, cost advantages, other brand loyalty, customers’ switching costs, product government regulation, industry’s competitive structure, corporate rivalries, cost conditions, entry and exit barriers) Life Cycle Analysis (embryonic, growth, shake-out, mature, declining) Business Cycle Sensitivity (cyclical: leading, lagging, coincident; defensive, growth) Analysis by Position on the Experience Curve 10
  • 11. Strategic Analysis: Porter’s “Five Forces” Intensity of Rivalry Bargaining Power of Customers Threat of New Entrants Threat of Substitute Products Bargaining Power of Suppliers First focus for analysis 11
  • 12. Evaluating the Threat of New Entrants and the Level of Competition What are the barriers to entry? How concentrated is the industry? What are capacity levels? How stable are market shares? Where is the industry in its life cycle? How important is price to the customer’s purchase decision? 12
  • 13. Barriers to Entry Sustainable Economic Profits Potential for Greater Pricing Power High Barriers to Entry 13
  • 14. Industry Concentration ABC Company XYZ Company MNO Company What percentage of the market does each of the largest players have? 14
  • 17. Industry Life Cycle Source: Based on Figure 2.4 in Hill and Source: Based on Figure 2.4 in Hill and Jones (2008). Source: Based on Figure 2.4 in Hill and Jones (2008). 17
  • 18. Limitations of Industry Life-Cycle Analysis Technological Changes Regulatory Changes Social Changes Demographic Changes 18
  • 20. Macroeconomic Influences on Industry Growth, Profitability, and Risk Industry Growth, Profitability, and Risk Economic Growth Interest Rates Availability of Credit Inflation 20
  • 21. Other Influences on Growth, Profitability, and Risk • Invention of the microchip • Digital imaging Examples of Technological Influences • Baby Boomer generation • Aging populations Examples of Demographic Influences • Tax policies and government spending • Regulation Examples of Governmental Influences • Changes in tobacco consumption • Women in the workforce Examples of Social Influences 21
  • 22. Industry Analysis for Branded Pharmaceuticals Major Companies Pfizer, Novartis, Merck, GlaxoSmithKline Barriers to Entry/Success Very High: Substantial financial and intellectual capital required to compete effectively. A potential new entrant would need to create a sizable R&D operation, a global distribution network, and large-scale manufacturing capacity. Level of Concentration Concentrated: A small number of companies control the bulk of the global market for branded drugs. Recent mergers have increased the level of concentration. Impact of Industry Capacity Not applicable: Pharmaceutical pricing is primarily determined by patent protection and regulatory issues, including government approval of drugs and manufacturing facilities. Manufacturing capacity is of little importance. Industry Stability Stable: The branded pharmaceutical market is dominated by major companies and consolidation via mega-mergers. Market shares shift quickly, however, as new drugs are approved and gain acceptance or lose patent protection. Life Cycle Mature: Overall demand does not change greatly from year to year. Price Competition Low/Medium: In the United States, price is a minimal factor because of the consumer- and provider-driven, deregulated health care system. Price is a larger part of the decision process in single-payer systems, where efficacy hurdles are higher. Demographic Influences Positive: Populations of developed markets are aging, which slightly increases demand. Government & Regulatory Influences Very High: All drugs must be approved for sale by national safety regulators. Patent regimes may differ among countries. Also, health care is heavily regulated in most countries. Social Influences Not applicable. Technological Influences Medium/High: Biologic (large-molecule) drugs are pushing new therapeutic boundaries, and many large pharmaceutical companies have a relatively small presence in biotech. Growth vs. Defensive vs. Cyclical Defensive: Demand for most health care services does not fluctuate with the economic cycle, but demand is not strong enough to be considered “growth.” 22
  • 23. Industry Analysis for Oil Services Major Companies Schlumberger, Baker Hughes, Halliburton Barriers to Entry/Success Medium: Technological expertise is required, but a high level of innovation allows niche companies to enter the industry and compete in specific areas. Level of Concentration Fragmented: Although only a small number of companies provide a full range of services, many smaller players compete effectively in specific areas. Service arms of national oil companies may control significant market share in their own countries, and some product lines are concentrated in the mature U.S. market. Impact of Industry Capacity Medium/High: Demand can fluctuate quickly depending on commodity prices, and industry players often find themselves with too few (or too many) employees on the payroll. Industry Stability Unstable: Market shares may shift frequently depending on technology offerings and demand levels. Life Cycle Mature: Demand does fluctuate with energy prices, but normalized revenue growth is only mid-single digits. Price Competition High: Price is a major factor in purchasers’ decisions. Some companies have modest pricing power because of a wide range of services or best-in-class technology, but primary customers (major oil companies) can usually substitute with in-house services if prices are too high. Also, innovation tends to diffuse quickly throughout the industry. Demographic Influences Not applicable. Government & Regulatory Influences Medium: Regulatory frameworks can affect energy demand at the margin. Also, governments play an important role in allocating exploration opportunities to E&P companies, which can indirectly affect the amount of work flowing down to service companies. Social Influences Not applicable. Technological Influences Medium/High: Industry is reasonably innovative, and players must re-invest in R&D to remain competitive. Temporary competitive advantages are possible via commercialization of new processes or exploitation of accumulated expertise. Growth vs. Defensive vs. Cyclical Cyclical: Demand is highly variable and depends on oil prices, exploration budgets, and the economic cycle. 23
  • 24. Industry Analysis for Confections/Candy Major Companies Cadbury, Hershey, Mars/Wrigley, Nestle Barriers to Entry/Success Very High: Low financial or technological hurdles, but new players would lack the established brands that drive consumer purchase decisions. Level of Concentration Very Concentrated: Top four companies have a large proportion of global market share. Recent mergers have increased the level of concentration. Impact of Industry Capacity Not applicable: Pricing is driven primarily by brand strength. Manufacturing capacity has little effect. Industry Stability Very Stable: Market shares change glacially. Life Cycle Very Mature: Growth is driven by population trends and pricing. Price Competition Low: A lack of private-label competition keeps pricing stable among established players, and brand/familiarity plays a much larger role in consumer purchase decisions than price. Demographic Influences Not applicable. Government & Regulatory Influences Low: Industry is not regulated, but childhood obesity concerns in developed markets are a low-level potential threat. Also, high-growth emerging markets may block entry of established players into their markets, possibly limiting growth. Social Influences Not applicable. Technological Influences Very Low: Innovation does not play a major role in the industry. Growth vs. Defensive vs. Cyclical Defensive: Demand for candy and gum is extremely stable. 24
  • 25. Porter: Competitive Strategy Cost Leadership Differentiation Cost Focus Differentiation Focus Scope NarrowBroad Source of Competitive Advantage Cost Differentiation 25
  • 26. Company Analysis Provide a company profile Explain relevant industry characteristics Analyze demand Analyze supply and input costs Explain the pricing environment Present and interpret relevant financial ratios 26
  • 27. Decomposition of ROE (DuPont ratios) Net Profit Margin Asset Turnover Financial Leverage ROE 27
  • 29. Summary • Uses of industry analysis • Industry classification systems • Establishing a peer group • Strategic analysis: Porter’s five forces • Industry and product life cycles • Demographic, governmental, social, and technological influences • Company analysis • Cost and differentiation strategies • Spreadsheet modeling 29

Editor's Notes

  1. LOS: Explain the uses of industry analysis and the relation of industry analysis to company analysis. Pages 370-371 Industry analysis is useful in a number of investment applications that make use of fundamental analysis. Its uses include the following: • Understanding a company’s business and business environment. Industry analysis is often a critical early step in stock selection and valuation because it provides insights into the issuer’s growth opportunities, competitive dynamics, and business risks. For a credit analyst, industry analysis provides insights into the appropriateness of a company’s use of debt financing and into its ability to meet its promised payments during economic contractions. • Identifying active equity investment opportunities. Investors taking a top-down investing approach use industry analysis to identify industries with positive, neutral, or negative outlooks for profitability and growth. Generally, investors will then overweight, market weight, or underweight those industries (as appropriate to their outlooks) relative to the investor’s benchmark if the investor judges that the industry’s perceived prospects are not fully incorporated in market prices. Apart from security selection, some investors attempt to outperform their benchmarks by industry or sector rotation—that is, timing investments in industries in relation to an analysis of industry fundamentals and/or business-cycle conditions (technical analysis may also play a role in such strategies). Several studies have underscored the importance of industry analysis by suggesting that the industry factor in stock returns is at least as important as the country factor. In addition, industry membership has been found to account for about 20% of the variability of a company’s profitability in the United States. • Portfolio performance attribution. Performance attribution, which addresses the sources of a portfolio’s returns usually in relation to the portfolio’s benchmark, includes industry or sector selection. Industry classification schemes play a role in such performance attribution.
  2. LOS: Compare and contrast the methods by which companies can be grouped, current industry classification systems, and classify a company, given a description of its activities and the classification system. Pages 371-374 Modern classification schemes are most commonly based on grouping companies by similar products and/or services. According to this perspective, an industry is defined as a group of companies offering similar products and/or services. For example, major companies in the global heavy truck industry include Volvo, Daimler AG, Paccar, and Navistar, all of which make large commercial vehicles for the on-highway truck market. Similarly, some of the large players in the global automobile industry are Toyota, General Motors, Volkswagen, Ford, Honda, Nissan, PSA Peugeot Citroën, and Hyundai, all of which produce light vehicles that are close substitutes for one another. Companies are sometimes grouped on the basis of their relative sensitivity to the business cycle. This method often results in two broad groupings of companies―cyclical and noncyclical. A cyclical company is one whose profits are strongly correlated with the strength of the overall economy. Such companies experience wider-than-average fluctuations in demand—high demand during periods of economic expansion and low demand during periods of economic contraction—and/or are subject to greater-than-average profit variability related to high operating leverage (i.e., high fixed costs). Concerning demand, cyclical products and services are often relatively expensive and/or represent purchases that can be delayed if necessary (e.g., because of declining disposable income). Examples of cyclical industries are autos, housing, basic materials, industrials, and technology. A noncyclical company is one whose performance is largely independent of the business cycle. Noncyclical companies produce goods or services for which demand remains relatively stable throughout the business cycle. Examples of noncyclical industries are food and beverage, household and personal care products, health care, and utilities. Statistical approaches to grouping companies are typically based on the correlations of past securities’ returns. For example, using the technique known as cluster analysis, companies are separated (on the basis of historical correlations of stock returns) into groups in which correlations are relatively high but between which correlations are relatively low. This method of aggregation often results in nonintuitive groups of companies, and the composition of the groups may vary significantly by time period and region of the world.
  3. LOS: Explain the factors that affect the sensitivity of a company to the business cycle and the uses and limitations of industry and company descriptors such as “growth,” “defensive,” and “cyclical.” Pages 372-374 Examples of cyclical industries are autos, housing, basic materials, industrials, and technology. A noncyclical company is one whose performance is largely independent of the business cycle. Noncyclical companies produce goods or services for which demand remains relatively stable throughout the business cycle. Examples of noncyclical industries are food and beverage, household and personal care products, health care, and utilities.
  4. LOS: Explain the factors that affect the sensitivity of a company to the business cycle and the uses and limitations of industry and company descriptors such as “growth,” “defensive,” and “cyclical.” Pages 372-373 The usefulness of industry and company labels such as “cyclical,” “growth,” and “defensive” is limited. Cyclical industries as well as growth industries often have growth companies within them. A cyclical industry itself, although exposed to the effects of fluctuations in overall economic activity, may grow at an above-average rate for periods spanning multiple business cycles. Furthermore, when fluctuations in economic activity are large, as in the deep recession of 2008−2009, few companies escape the effects of the cyclical weakness in overall economic activity. The defensive label is also problematic. Industries may include both companies that are growth and companies that are defensive in character, making the choice between a “growth” and a “defensive” label difficult. Moreover, “defensive” cannot be understood as necessarily being descriptive of investment characteristics. Food supermarkets, for example, would typically be described as defensive but can be subject to profit-damaging price wars. So-called defensive industries/companies may sometimes face industry dynamics that make them far from defensive in the sense of preserving shareholders’ capital.
  5. LOS: Compare and contrast the methods by which companies can be grouped, current industry classification systems, and classify a company, given a description of its activities and the classification system. Pages 374-375 GICS was jointly developed by Standard & Poor’s and MSCI Barra, two of the largest providers of global equity indices, in 1999. As the name implies, GICS was designed to facilitate global comparisons of industries, and it classifies companies in both developed and developing economies. Each company is assigned to a subindustry according to its principal business activity. Each subindustry belongs to a particular industry, each industry belongs to an industry group, and each group belongs to a sector. In June 2009, the GICS classification structure comprised four levels of detail consisting of 154 subindustries, 68 industries, 24 industry groups, and 10 sectors. The composition of GICS has historically been adjusted over time to reflect changes in the global equity markets. The RGS classification system uses a three-tier structure to classify companies globally on the basis of the products or services a company produces. In June 2009, the RGS classification system consisted of 9 sectors, 32 subsectors, and 141 industries. Besides the number of tiers, another difference between the RGS and GICS classification systems is that the RGS system contains 9 sectors whereas GICS consists of 10. For example, the RGS system does not provide a separate sector for telecommunication service companies. Many companies that GICS classifies as “Telecommunication Services,” including China Mobile Ltd., AT&T, and Telefonica, are assigned by RGS to its more broadly defined “Utilities” sector. The ICB, which was jointly developed by Dow Jones and FTSE, uses a four-tier structure to categorize companies globally on the basis of the source from which a company derives the majority of its revenue. In June 2009, the ICB classification system consisted of 10 industries, 19 supersectors, 41 sectors, and 114 subsectors. Although the ICB is similar to GICS in the number of tiers and the method by which companies are assigned to particular groups, the two systems use significantly different nomenclature. For example, GICS uses the term “sector” to describe its broadest grouping of companies, whereas the ICB uses the term “industry.” Another difference among the systems is that the ICB distinguishes between consumer goods and consumer services companies whereas both GICS and the RGS system group consumer products companies and consumer services companies together into sectors on the basis of economic sensitivity. These stylistic distinctions tend to be less obvious at the more granular levels of the different hierarchies.
  6. LOS: Compare and contrast the methods by which companies can be grouped, current industry classification systems, and classify a company, given a description of its activities and the classification system. Pages 378-379 The International Standard Industrial Classification of All Economic Activities (ISIC) was adopted by the United Nations in 1948 to address the need for international comparability of economic statistics. ISIC classifies entities into various categories on the basis of the principal type of economic activity the entity performs. ISIC is organized into 11 categories, 21 sections, 88 divisions, 233 groups, and more than 400 classes. According to the United Nations, a majority of countries around the world have either used ISIC as their national activity classification system or have developed national classifications derived from ISIC. Some of the organizations currently using the ISIC are the UN and its specialized agencies, the International Monetary Fund, the World Bank, and other international bodies. Often regarded as the European version of ISIC, Statistical Classification of Economic Activities in the European Community (NACE) is the classification of economic activities that correspond to ISIC at the European level. Similar to ISIC, NACE classification is organized according to economic activity. NACE is composed of four levels—namely, sections (identified by alphabetical letters A through U), divisions (identified by two-digit numerical codes 01 through 99), groups (identified by three-digit numerical codes 01.1 through 99.0), and classes (identified by four-digit numerical codes 01.11 through 99.00). The Australian and New Zealand Standard Industrial Classification (ANZSIC) was jointly developed by the Australian Bureau of Statistics and Statistics New Zealand in 1993 to facilitate the comparison of industry statistics of the two countries and comparisons with the rest of the world. International comparability was achieved by aligning ANZSIC with the international standards used by ISIC. ANZSIC has a structure comprising five levels—namely, divisions (the broadest level), subdivisions, groups, classes, and at the most granular level, subclasses (New Zealand only). Jointly developed by the United States, Canada, and Mexico, the North American Industry Classification System (NAICS) replaced the Standard Industrial Classification (SIC) system in 1997. NAICS distinguishes between establishments and enterprises. NAICS classifies establishments into industries according to the primary business activity of the establishment. In the NAICS system, an establishment is defined as a single physical location where business is conducted or where services or industrial operations are performed (e.g., factory, store, hotel, movie theater, farm, office). An enterprise may consist of more than one location performing the same or different types of economic activities. Each establishment of that enterprise is assigned a NAICS code on the basis of its own primary business activity. NAICS uses a two-digit through six-digit code to structure its categories into five levels of detail. The greater the number of digits in the code, the more narrowly defined the category. The five levels of categories, from broadest to narrowest, are sector (signified by the first two digits of the code), subsector (third digit of the code), industry group (fourth digit), NAICS industry (fifth digit), and national industry (sixth digit). The five-digit code is the level of greatest amount of comparability among countries; a six-digit code provides for more country-specific detail.
  7. LOS: Compare and contrast the methods by which companies can be grouped, current industry classification systems, and classify a company, given a description of its activities and the classification system. Pages 375-376 Basic Materials and Processing—companies engaged in the production of building materials, chemicals, paper and forest products, containers and packaging, and metal, mineral, and mining companies. Consumer Discretionary—companies that derive a majority of revenue from the sale of consumer-related products or services for which demand tends to exhibit a relatively high degree of economic sensitivity. Examples of business activities that frequently fall into this category are automotive, apparel, hotel, and restaurant businesses. Consumer Staples—consumer-related companies whose business tends to exhibit less economic sensitivity than other companies; for example, manufacturers of food, beverage, tobacco, and personal care products. Energy—companies whose primary line of business involves the exploration, production, or refining of natural resources used to produce energy; companies that derive a majority of revenue from the sale of equipment or through the provision of services to energy companies would also fall into this category. Financial Services—companies whose primary line of business involves banking, finance, insurance, real estate, asset management, and/or brokerage services. Health Care—manufacturers of pharmaceutical and biotech products, medical devices, health care equipment, and medical supplies and providers of health care services. Industrial/Producer Durables—manufacturers of capital goods and providers of commercial services; for example, business activities would include heavy machinery and equipment manufacture, aerospace and defense, transportation services, and commercial services and supplies. Technology—companies involved in the manufacture or sale of computers, software, semiconductors, and communications equipment; other business activities that frequently fall into this category are electronic entertainment, internet services, and technology consulting and services. Telecommunications—companies that provide fixed-line and wireless communication services; some vendors prefer to combine telecommunication and utility companies together into a single “utilities” category. Utilities—electric, gas, and water utilities; telecommunication companies are sometimes included in this category.
  8. LOS: Explain the relation of “peer group,” as used in equity valuation, to a company’s industry classification. Pages 380-381 A peer group is a group of companies engaged in similar business activities whose economics and valuation are influenced by closely related factors. Comparisons of a company in relation to a well-defined peer group can provide valuable insights into the company’s performance and its relative valuation. The following are steps in constructing a preliminary list of peer companies: • Examine commercial classification systems, if available to the analyst. These systems often provide a useful starting point for identifying companies operating in the same industry. • Review the subject company’s annual report for a discussion of the competitive environment. Companies frequently cite specific competitors. • Review competitors’ annual reports to identify other potential comparable companies. • Review industry trade publications to identify comparable companies. • Confirm that each comparable company derives a significant portion of its revenue and operating profit from a business activity similar to the primary business of the subject company.
  9. LOS: Discuss the elements that need to be covered in a thorough industry analysis. Pages 385-387 Exhibit 9-2 provides a framework designed to help analysts check that they have considered the range of forces that may affect the evolution of an industry. It shows, at the macro level, macroeconomic, demographic, governmental, social, and technological influences affecting the industry. It then depicts how an industry is affected by the forces driving industry competition (threat of new entrants, substitution threats, customer and supplier bargaining forces), the competitive forces in the industry, life-cycle issues, business-cycle considerations, and the position of the industry on the experience curve.
  10. LOS: Discuss the principles of strategic analysis of an industry. Pages 386-388 Analysis of the competitive environment with an emphasis on the implications of the environment for corporate strategy is known as strategic analysis. Michael Porter’s “five forces” framework is the classic starting point for strategic analysis. Porter focused on five determinants of the intensity of competition in an industry: • The threat of substitute products, which can negatively affect demand if customers choose other ways of satisfying their needs. For example, consumers may trade down from premium beers to discount brands during recessions. Low-priced brands may be close substitutes for premium brands, which, when consumer budgets are constrained, reduces the ability of premium brands to maintain or increase prices. • The bargaining power of customers, which can affect the intensity of competition by exerting influence on suppliers regarding prices (and possibly other factors, such as product quality). For example, auto parts companies generally sell to a small number of auto manufacturers, which allows those customers, the auto manufacturers, to be tough negotiators when it comes to setting prices. • The bargaining power of suppliers, which may be able to raise prices or restrict the supply of key inputs to a company. For example, workers at a heavily unionized company may have greater bargaining power as suppliers of labor than workers at a comparable nonunionized company. Suppliers of scarce or limited parts or elements often possess significant pricing power. • The threat of new entrants to the industry, which depends on barriers to entry, or how difficult it would be for new competitors to enter the industry. Industries that are easy to enter will generally be more competitive than industries with high barriers to entry. • The intensity of rivalry among incumbent companies (i.e., the current companies in the industry), which is a function of the industry’s competitive structure. Industries that are fragmented among many small competitors, have high fixed costs, provide undifferentiated (commodity-like) products, or have high exit barriers usually experience more intense rivalry than industries without these characteristics.
  11. LOS: Discuss the principles of strategic analysis of an industry. Page 389 Addressing the following questions should help the analyst evaluate the threat of new entrants and the level of competition in an industry and thereby provide an effective base for describing and analyzing the industry: • What are the barriers to entry? Is it difficult or easy for a new competitor to challenge incumbents? Relatively high (low) barriers to entry imply that the threat of new entrants is relatively low (high). • How concentrated is the industry? Do a small number of companies control a relatively large share of the market, or does the industry have many players, each with a small market share? • What are capacity levels? That is, based on existing investment, how much of the goods or services can be delivered in a given time frame? Does the industry suffer chronic over- or undercapacity, or do supply and demand tend to come into balance reasonably quickly in the industry? • How stable are market shares? Do companies tend to rapidly gain or lose share, or is the industry stable? • Where is the industry in its life cycle? Does it have meaningful growth prospects, or is it demand stagnant/declining? • How important is price to the customer’s purchase decision?
  12. LOS: Explain the effects of industry concentration, ease of entry, and capacity on return on invested capital and pricing power. Pages 389-391 When a company is earning economic profits, the chances that it will be able to sustain them through time are greater, all else being equal, if the industry has high barriers to entry. The ease with which new competitors can challenge incumbents is often an important factor in determining the competitive landscape of an industry. If new competitors can easily enter the industry, the industry is likely to be highly competitive because high returns on invested capital will quickly be competed away by new entrants eager to grab their share of economic profits. As a result, industries with low barriers to entry often have little pricing power because price increases that raise companies’ returns on capital will eventually attract new competitors to the industry. Companies earning economic profits are achieving returns on investment above the opportunity cost of funds.
  13. LOS: Explain the effects of industry concentration, ease of entry, and capacity on return on invested capital and pricing power. Pages 391-394 Much like industries with barriers to entry, industries that are concentrated among a relatively small number of players often experience relatively less price competition. An analysis of industry concentration should start with market share: What percentage of the market does each of the largest players have, and how large are those shares relative to each other and relative to the remainder of the market? Often, the relative market shares of competitors matter as much as their absolute market shares. Fragmented industries tend to be highly price competitive for several reasons. First, the large number of companies makes coordination difficult because there are too many competitors for each industry member to monitor effectively. Second, each player has such a small piece of the market that even a small gain in market share can make a meaningful difference to its fortunes, which increases the incentive of each company to undercut prices and attempt to steal share. Finally, the large number of players encourages industry members to think of themselves individualistically rather than as members of a larger group, which can lead to fierce competitive behavior.
  14. LOS: Explain the effects of industry concentration, ease of entry, and capacity on return on invested capital and pricing power. Pages 394-396 The effect on pricing of industry capacity (the maximum amount of a good or service that can be supplied in a given time period) is clear: Tight, or limited, capacity gives participants more pricing power as demand for the product or service exceeds supply, whereas overcapacity leads to price cutting and a very competitive environment as excess supply chases demand. An analyst should think about not only current capacity conditions but also future changes in capacity levels. How quickly can companies in the industry adjust to fluctuations in demand? How flexible is the industry in bringing supply and demand into balance? What will be the effect of that process on industry pricing power or on industry margins?
  15. LOS: Explain the effects of industry concentration, ease of entry, and capacity on return on invested capital and pricing power. Pages 396-397 Examining the stability of industry market shares over time is similar to thinking about barriers to entry and the frequency with which new players enter an industry. In fact, barriers to entry and the frequency of new product introductions, together with such factors as product differentiation, all affect market shares. Stable market shares typically indicate less competitive industries; unstable market shares often indicate highly competitive industries that have limited pricing power.
  16. LOS: Describe product and industry life-cycle models, classify an industry as to life-cycle phase (e.g., embryonic, growth, shakeout, maturity, or decline) based on a description of it, and discuss the limitations of the life-cycle concept in forecasting industry performance. Pages 397-400 The five stages of an industry life-cycle model are embryonic, growth, shakeout, mature, and decline. Each stage is characterized by different opportunities and threats. Embryonic—An embryonic industry is one that is just beginning to develop. Characteristics of the embryonic stage include slow growth and high prices because customers tend to be unfamiliar with the industry’s product and volumes are not yet sufficient to achieve meaningful economies of scale. Increasing product awareness and developing distribution channels are key strategic initiatives of companies during this stage. Substantial investment is generally required, and the risk of failure is high. Growth—A growth industry tends to be characterized by rapidly increasing demand, improving profitability, falling prices, and relativity low competition among companies in the industry. Demand is fueled by new customers entering the market, and prices fall as economies of scale are achieved and as distribution channels develop. The threat of new competitors entering the industry is usually highest during the growth stage, when barriers to entry are relatively low. Competition tends to be relatively limited, however, because rapidly expanding demand provides companies with an opportunity to grow without needing to capture market share from competitors. Industry profitability improves as volumes rise and economies of scale are attained. Shakeout—The shakeout stage is usually characterized by slowing growth, intense competition, and declining profitability. During the shakeout stage, demand approaches market saturation levels because few new customers are left to enter the market. Competition is intense as growth becomes increasingly dependent on market share gains. Excess industry capacity begins to develop as the rate at which companies continue to invest exceeds the overall growth of industry demand. In an effort to boost volumes to fill excess capacity, companies often cut prices, so industry profitability begins to decline. During the shakeout stage, companies increasingly focus on reducing their cost structure (restructuring) and building brand loyalty. Marginal companies may fail or merge with others. Mature—Characteristics of a mature industry include little or no growth, industry consolidation, and relatively high barriers to entry. Industry growth tends to be limited to replacement demand and population expansion because the market at this stage is completely saturated. As a result of the shakeout, mature industries often consolidate and become oligopolies. The surviving companies tend to have brand loyalty and relatively efficient cost structures, both of which are significant barriers to entry. During periods of stable demand, companies in mature industries tend to recognize their interdependence and try to avoid price wars. Periodic price wars do occur, however, most notably during periods of declining demand (such as during economic downturns). Companies with superior products or services are likely to gain market share and experience above-industry-average growth and profitability. Decline—during the decline stage, industry growth turns negative, excess capacity develops, and competition increases. Industry demand at this stage may decline for a variety of reasons, including technological substitution. As demand falls, excess capacity in the industry forms and companies respond by cutting prices, which often leads to price wars. At this point, the weaker companies often exit the industry, merge, or redeploy capital into different products and services.
  17. LOS: Describe product and industry life-cycle models, classify an industry as to life-cycle phase (e.g., embryonic, growth, shakeout, maturity, or decline) based on a description of it, and discuss the limitations of the life-cycle concept in forecasting industry performance. Pages 400-401 Although models can provide a useful framework for thinking about an industry, the evolution of an industry does not always follow a predictable pattern. Various external factors may significantly affect the shape of the pattern, causing some stages to be longer or shorter than expected and, in certain cases, causing some stages to be skipped altogether. Technological changes may cause an industry to experience an abrupt shift from growth to decline, thus skipping the shakeout and mature stages. For example, the movie rental industry is experiencing rapid change as consumers increasingly turn to on-demand services, such as downloading movies from the internet or through their cable providers. Regulatory changes can also have a profound impact on the structure of an industry. A prime example is the deregulation of the U.S. telecommunications industry in the 1990s, which transformed a monopolistic industry into an intensely competitive one. Social changes also have the ability to affect the profile of an industry. The casual dining industry has benefited over the past 30 years from the increase in the number of dual-income families, who often have more income but less time to cook meals to eat at home. Demographics also play an important role. As the Baby Boomer generation ages, for instance, industry demand for health care services is likely to increase.
  18. LOS: Explain the effects of industry concentration, ease of entry, and capacity on return on invested capital and pricing power. Page 402 A highly useful tool for analyzing an industry is attempting to think like a customer of the industry. Whatever factor most influences customer purchase decisions is likely to also be the focus of competitive rivalry in the industry. In general, industries for which price is a large factor in customer purchase decisions tend to be more competitive than industries in which customers value other attributes more highly.
  19. LOS: Discuss the elements that need to be covered in a thorough industry analysis. Pages 405-406 Trends in overall economic activity generally have significant effects on the demand for an industry’s products or services. These trends can be cyclical (i.e., related to changes in economic activity caused by the business cycle) or structural (i.e., related to enduring changes in the composition or magnitude of economic activity). Among the economic variables that usually affect an industry’s revenues and profits are the following: • gross domestic product or the measure of the value of goods and services produced by an economy, either in current or constant currency (inflation-adjusted) terms; • interest rates, which represent the cost of debt to consumers and businesses and are important ingredients in financial institutions’ revenues and costs; • the availability of credit, which affects business and consumer spending and financial solvency; and • inflation, which reflects the changes in prices of goods and services and influences costs, interest rates, and consumer and business confidence.
  20. LOS: Illustrate demographic, governmental, social, and technological influences on industry growth, profitability, and risk. Pages 405-411 New technologies create new or improved products that can radically change an industry and can also change how other industries that use the products conduct their operations. The computer hardware industry provides one of the best examples of how technological change can affect industries. The 1958 invention of the microchip (also known as an “integrated circuit,” which is effectively a computer etched on a sliver of silicon) enabled the computer hardware industry to eventually create a new market of personal computing for the general public and radically extended the use of computers in business, government, and educational institutions. Another example of the effects of technology on an industry is the impact of digital imaging technology on the photographic film industry. Since their invention in 1981, digital cameras have become extremely popular and now widely outsell traditional film cameras (although many professional photographers continue to use film for esthetic reasons for certain applications). Changes in population size, in the distributions of age and gender, and in other demographic characteristics may have significant effects on economic growth and on the amounts and types of goods and services consumed. The effects of demographics on industries are well exemplified by the impact of the post–World War II Baby Boom in North America on demand for goods and services. Born between 1946 and 1964, this bulge of 76 million people in the North American population has influenced the composition of numerous products and services it has needed in its passage from the cradle through childhood, adolescence, early adulthood, middle age, and into retirement. Another example of the effects of demographics on industries is the impact of an aging population in Japan, which has one of the highest percentages of elderly residents (21% over the age of 65) and a very low birth rate. Japan’s ministry of health estimates that by 2055, the percentage of the population over 65 will rise to 40% and the total population will fall by 25%. Governmental influence on industries’ revenues and profits is pervasive and important. In setting tax rates and rules for corporations and individuals, governments affect profits and incomes, which, in turn, affect corporate and personal spending. Governments are also major purchasers of goods and services from a range of industries. Governments exert their influence indirectly by empowering other regulatory or self-regulatory organizations (e.g., stock exchanges, medical associations, utility rate setters, and other regulatory commissions) to govern the affairs of an industry. By setting the terms of entry into various sectors, such as financial services and health care, and the rules that companies and individuals must adhere to in these fields, governments control the supply, quality, and nature of many products and services and the public’s access to them. Societal changes involving how people work, spend their money, enjoy their leisure time, and conduct other aspects of their lives can have significant effects on the sales of various industries. Tobacco consumption in the United Kingdom provides a good example of the effects of social influences on an industry. Although the role of government in curbing tobacco advertising, legislating health warnings on the purchases of tobacco products, and banning smoking in public places (such as restaurants, bars, public houses, and transportation vehicles) probably has been the most powerful apparent instrument of changes in tobacco consumption, the forces underlying that change have really been social in nature—namely, increasing consciousness on the part of the population of the damage to the health of tobacco users and those in their vicinity from smoking, the increasing cost to individuals and governments of the chronic illnesses caused by tobacco consumption, and the accompanying shift in public perception of smokers from socially correct to socially incorrect—even inconsiderate or reckless. In 1870, women accounted for only 15% of the workforce in the United States outside the home. By 1950, after two world wars and the Great Depression, this figure had risen to 30% (it had been even higher temporarily during WWII because of high levels of war-mandated production) and by 2008, to 48%.
  21. LOS: Compare and contrast the characteristics of representative industries from the various economic sectors. Pages 402-405
  22. LOS: Compare and contrast the characteristics of representative industries from the various economic sectors. Pages 402-405
  23. LOS: Compare and contrast the characteristics of representative industries from the various economic sectors. Pages 402-405
  24. LOS: Describe the elements that should be covered in a thorough company analysis. Pages 412-413 Porter identifies two chief competitive strategies: a low-cost strategy (cost leadership) and a product/service differentiation strategy. In a low-cost strategy, companies strive to become low-cost producers and to gain market share by offering their products and services at lower prices than their competition while still making a profit margin sufficient to generate a superior rate of return based on the higher revenues achieved. Low-cost strategies may be pursued defensively to protect market positions and returns or offensively to gain market share and increase returns. Pricing also can be defensive (when the competitive environment is one of low rivalry) or aggressive (when rivalry is intense). In the case of intense rivalry, pricing may even become predatory—that is, aimed at rapidly driving competitors out of business at the expense of near-term profitability. The hope in such a strategy is that having achieved a larger market share, the company can later increase prices to generate higher returns than before. For example, the predatory strategy has been alleged by some analysts to have been followed by major airlines trying to protect lucrative routes from discount airlines. Although laws concerning anti-competitive practices often prohibit predatory pricing to gain market share, in most cases, it is difficult to accurately ascribe the costs of products or services with sufficient precision to demonstrate that predatory pricing (as opposed to intense but fair price competition) is occurring. Companies seeking to follow low-cost strategies must have tight cost controls, efficient operating and reporting systems, and appropriate managerial incentives. In addition, they must commit themselves to painstaking scrutiny of production systems and their labor forces and to low-cost designs and product distribution. They must be able to invest in productivity-improving capital equipment and to finance that investment at a low cost of capital. In differentiation strategies, companies attempt to establish themselves as the suppliers or producers of products and services that are unique either in quality, type, or means of distribution. To be successful, their price premiums must be above their costs of differentiation and the differentiation must be appealing to customers and sustainable over time. Corporate managers who successfully pursue differentiation strategies tend to have strong market research teams to identify and match customer needs with product development and marketing. Such a strategy puts a premium on employing creative and inventive people.
  25. LOS: Describe the elements that should be covered in a thorough company analysis. Pages 413-416 A thorough company analysis, particularly as presented in a research report, should • provide an overview of the company (corporate profile), including a basic understanding of its businesses, investment activities, corporate governance, and perceived strengths and weaknesses. • explain relevant industry characteristics. • analyze the demand for the company’s products and services. • analyze the supply of products and services, which includes an analysis of costs. • explain the company’s pricing environment. • present and interpret relevant financial ratios, including comparisons over time and comparisons with competitors. Company analysis often includes forecasting the company’s financial statements, particularly when the purpose of the analysis is to use a discounted cash flow method to value the company’s common equity.
  26. LOS: Describe the elements that should be covered in a thorough company analysis. Page 416 The decomposition of ROE can be used to analyze how and why a company’s ROE differs from that of other companies or its own ROE in other periods by tracing the differences to changes in its profit margin, the productivity of its assets, or its financial leverage. ROE = (Net profit margin: Net earnings/Net sales) × (Asset turnover: Net sales/Average total assets) × (Financial leverage: Average total assets/Average common equity)
  27. LOS: Describe the elements that should be covered in a thorough company analysis. Pages 416-417 Spreadsheet modeling of financial statements to analyze and forecast revenues, operating and net income, and cash flows has become one of the most widely used tools in company analysis. Spreadsheet modeling can be used to quantify the effects of the changes in certain swing factors on the various financial statements. The analyst should be aware that the output of the model will depend significantly on the assumptions that are made.