Sept 2018 Market Reports
•
0 likes•300 views

Gallatin Valley home sales data for September 2018

Recommended
Recommended
More Related Content
What's hot
What's hot (20)
Similar to Sept 2018 Market Reports
Similar to Sept 2018 Market Reports (13)
More from Referred Realty Group
More from Referred Realty Group (10)
Recently uploaded
Recently uploaded (20)
Sept 2018 Market Reports
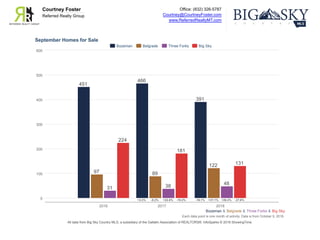
- 1. Office: (832) 326-5787 Courtney@CourtneyFoster.com www.ReferredRealtyMT.com Courtney Foster Referred Realty Group Each data point is one month of activity. Data is from October 9, 2018. All data from Big Sky Country MLS, a subsidiary of the Gallatin Association of REALTORS®. InfoSparks © 2018 ShowingTime. September Homes for Sale Bozeman & Belgrade & Three Forks & Big Sky 0 100 200 300 400 500 600 2016 2017 2018 451 466 391 +3.3% -16.1% 97 89 122 -8.2% +37.1% 31 38 48 +22.6% +26.3% 224 181 131 -19.2% -27.6% Bozeman Belgrade Three Forks Big Sky
- 2. Office: (832) 326-5787 Courtney@CourtneyFoster.com www.ReferredRealtyMT.com Courtney Foster Referred Realty Group Each data point is one month of activity. Data is from October 9, 2018. All data from Big Sky Country MLS, a subsidiary of the Gallatin Association of REALTORS®. InfoSparks © 2018 ShowingTime. September New Listings Bozeman & Belgrade & Three Forks & Big Sky 0 25 50 75 100 125 150 175 2016 2017 2018 125 147 131 +17.6% -10.9% 43 39 45 -9.3% +15.4% 17 4 14 -76.5% +250.0% 25 20 24 -20.0% +20.0% Bozeman Belgrade Three Forks Big Sky
- 3. Office: (832) 326-5787 Courtney@CourtneyFoster.com www.ReferredRealtyMT.com Courtney Foster Referred Realty Group Each data point is one month of activity. Data is from October 9, 2018. All data from Big Sky Country MLS, a subsidiary of the Gallatin Association of REALTORS®. InfoSparks © 2018 ShowingTime. September Pending Sales Bozeman & Belgrade & Three Forks & Big Sky 0 25 50 75 100 125 150 175 2016 2017 2018 104 103 143 -1.0% +38.8% 38 37 32 -2.6% -13.5% 9 6 13 -33.3% +116.7% 29 24 19 -17.2% -20.8% Bozeman Belgrade Three Forks Big Sky
- 4. Office: (832) 326-5787 Courtney@CourtneyFoster.com www.ReferredRealtyMT.com Courtney Foster Referred Realty Group Each data point is one month of activity. Data is from October 9, 2018. All data from Big Sky Country MLS, a subsidiary of the Gallatin Association of REALTORS®. InfoSparks © 2018 ShowingTime. September Closed Sales Bozeman & Belgrade & Three Forks & Big Sky 0 25 50 75 100 125 150 175 2016 2017 2018 149 120 123 -19.5% +2.5% 33 45 36 +36.4% -20.0% 7 3 8 -57.1% +166.7% 36 26 17 -27.8% -34.6% Bozeman Belgrade Three Forks Big Sky
- 5. Office: (832) 326-5787 Courtney@CourtneyFoster.com www.ReferredRealtyMT.com Courtney Foster Referred Realty Group Each data point is activity year to date. Data is from October 9, 2018. All data from Big Sky Country MLS, a subsidiary of the Gallatin Association of REALTORS®. InfoSparks © 2018 ShowingTime. September Closed Sales Bozeman & Belgrade & Three Forks & Big Sky 0 200 400 600 800 1,000 1,200 1,400 2016 2017 2018 1,228 1,130 1,168 -8.0% +3.4% 327 363 358 +11.0% -1.4% 56 44 67 -21.4% +52.3% 175 197 214 +12.6% +8.6% Bozeman Belgrade Three Forks Big Sky
- 6. Office: (832) 326-5787 Courtney@CourtneyFoster.com www.ReferredRealtyMT.com Courtney Foster Referred Realty Group Each data point is one month of activity. Data is from October 9, 2018. All data from Big Sky Country MLS, a subsidiary of the Gallatin Association of REALTORS®. InfoSparks © 2018 ShowingTime. September Average Sales Price Bozeman & Belgrade & Three Forks & Big Sky $0 $0.2M $0.4M $0.6M $0.8M $1.0M $1.2M 2016 2017 2018 $405,192 $426,185 $473,660 +5.2% +11.1% $249,320 $308,871 $364,637 +23.9% +18.1% $211,021 $253,830 $278,750 +20.3% +9.8% $1,006,870 $875,538 $1,037,471 -13.0% +18.5% Bozeman Belgrade Three Forks Big Sky
- 7. Office: (832) 326-5787 Courtney@CourtneyFoster.com www.ReferredRealtyMT.com Courtney Foster Referred Realty Group Each data point is one month of activity. Data is from October 9, 2018. All data from Big Sky Country MLS, a subsidiary of the Gallatin Association of REALTORS®. InfoSparks © 2018 ShowingTime. September Months Supply of Homes for Sale Bozeman & Belgrade & Three Forks & Big Sky 0.0 2.0 4.0 6.0 8.0 10.0 12.0 2016 2017 2018 3.4 3.7 3.1 +8.8% -16.2% 2.8 2.3 3.2 -17.9% +39.1% 4.6 7.2 5.9 +56.5% -18.1% 10.7 8.1 5.7 -24.3% -29.6% Bozeman Belgrade Three Forks Big Sky
- 8. Office: (832) 326-5787 Courtney@CourtneyFoster.com www.ReferredRealtyMT.com Courtney Foster Referred Realty Group Each data point is one month of activity. Data is from October 9, 2018. All data from Big Sky Country MLS, a subsidiary of the Gallatin Association of REALTORS®. InfoSparks © 2018 ShowingTime. September Median Days on Market Bozeman & Belgrade & Three Forks & Big Sky 0 100 50 150 200 2016 2017 2018 34 15 23 -55.9% +53.3% 9 9 21 0.0% +133.3% 85 51 45 -40.0% -11.8% 160 64 76 -60.0% +18.8% Bozeman Belgrade Three Forks Big Sky
- 9. Office: (832) 326-5787 Courtney@CourtneyFoster.com www.ReferredRealtyMT.com Courtney Foster Referred Realty Group Each data point is one month of activity. Data is from October 9, 2018. All data from Big Sky Country MLS, a subsidiary of the Gallatin Association of REALTORS®. InfoSparks © 2018 ShowingTime. September Average Price Per Square Foot Bozeman & Belgrade & Three Forks & Big Sky $0 $100 $200 $300 $400 $500 2016 2017 2018 $176 $208 $220 +18.2% +5.8% $139 $162 $182 +16.5% +12.3% $112 $122 $151 +8.9% +23.8% $369 $423 $378 +14.6% -10.6% Bozeman Belgrade Three Forks Big Sky
- 10. Local Market Update – August 2018 This is a research tool provided by the Big Sky Country MLS Bozeman City Limits Single Family August Year to Date Key Metrics 2017 2018 % Change Thru 8-2017 Thru 8-2018 % Change New Listings 71 71 0.0% 510 538 + 5.5% Pending Sales 51 59 + 15.7% 413 431 + 4.4% Closed Sales 50 74 + 48.0% 383 419 + 9.4% Days on Market Until Sale 50 34 - 32.0% 59 46 - 22.0% Median Sales Price* $394,430 $452,500 + 14.7% $379,000 $425,000 + 12.1% Average Sales Price* $435,643 $512,213 + 17.6% $415,642 $471,445 + 13.4% Percent of List Price Received* 98.9% 98.5% - 0.4% 99.4% 99.2% - 0.2% Inventory of Homes for Sale 148 158 + 6.8% –– –– –– Months Supply of Inventory 3.2 3.2 0.0% –– –– –– Condo/Townhouse August Year to Date Key Metrics 2017 2018 % Change Thru 8-2017 Thru 8-2018 % Change New Listings 34 58 + 70.6% 411 357 - 13.1% Pending Sales 32 41 + 28.1% 337 320 - 5.0% Closed Sales 49 44 - 10.2% 287 301 + 4.9% Days on Market Until Sale 51 20 - 60.8% 72 55 - 23.6% Median Sales Price* $285,000 $304,700 + 6.9% $272,000 $300,000 + 10.3% Average Sales Price* $315,387 $313,530 - 0.6% $313,874 $341,628 + 8.8% Percent of List Price Received* 99.8% 99.3% - 0.5% 99.8% 99.4% - 0.4% Inventory of Homes for Sale 97 102 + 5.2% –– –– –– Months Supply of Inventory 2.7 2.9 + 7.4% –– –– –– * Does not account for sale concessions and/or downpayment assistance. | Percent changes are calculated using rounded figures and can sometimes look extreme due to small sample size. A rolling 12-month calculation represents the current month and the 11 months prior in a single data point. If no activity occurred during a month, the line extends to the next available data point. Median Sales Price - Single Family Rolling 12-Month Calculation Gallatin County Bozeman City Limits 1-2003 1-2005 1-2007 1-2009 1-2011 1-2013 1-2015 1-2017 $150,000 $200,000 $250,000 $300,000 $350,000 $400,000 $450,000 Median Sales Price - Condo Rolling 12-Month Calculation Gallatin County Bozeman City Limits 1-2003 1-2005 1-2007 1-2009 1-2011 1-2013 1-2015 1-2017 $100,000 $150,000 $200,000 $250,000 $300,000 Current as of September 10, 2018. All data from Big Sky Country Multiple Listing Service®. Report © 2018 ShowingTime.
- 11. Local Market Update – September 2018 This is a research tool provided by the Big Sky Country MLS Belgrade 3B, 3N, 3S Single Family September Year to Date Key Metrics 2017 2018 % Change Thru 9-2017 Thru 9-2018 % Change New Listings 22 33 + 50.0% 341 332 - 2.6% Pending Sales 27 24 - 11.1% 290 257 - 11.4% Closed Sales 34 22 - 35.3% 272 252 - 7.4% Days on Market Until Sale 27 32 + 18.5% 39 36 - 7.7% Median Sales Price* $296,250 $326,250 + 10.1% $286,700 $318,950 + 11.2% Average Sales Price* $325,117 $377,638 + 16.2% $324,278 $347,470 + 7.2% Percent of List Price Received* 98.6% 99.3% + 0.7% 99.0% 99.0% 0.0% Inventory of Homes for Sale 69 88 + 27.5% –– –– –– Months Supply of Inventory 2.4 3.2 + 33.3% –– –– –– Condo/Townhouse September Year to Date Key Metrics 2017 2018 % Change Thru 9-2017 Thru 9-2018 % Change New Listings 12 9 - 25.0% 80 111 + 38.8% Pending Sales 8 3 - 62.5% 75 86 + 14.7% Closed Sales 3 11 + 266.7% 61 77 + 26.2% Days on Market Until Sale 13 51 + 292.3% 32 26 - 18.8% Median Sales Price* $183,000 $221,000 + 20.8% $183,500 $220,000 + 19.9% Average Sales Price* $196,667 $224,445 + 14.1% $184,571 $223,308 + 21.0% Percent of List Price Received* 101.5% 100.3% - 1.2% 99.5% 99.8% + 0.3% Inventory of Homes for Sale 8 25 + 212.5% –– –– –– Months Supply of Inventory 1.1 3.2 + 190.9% –– –– –– * Does not account for sale concessions and/or downpayment assistance. | Percent changes are calculated using rounded figures and can sometimes look extreme due to small sample size. A rolling 12-month calculation represents the current month and the 11 months prior in a single data point. If no activity occurred during a month, the line extends to the next available data point. Median Sales Price - Single Family Rolling 12-Month Calculation Gallatin County Belgrade 1-2003 1-2005 1-2007 1-2009 1-2011 1-2013 1-2015 1-2017 $100,000 $150,000 $200,000 $250,000 $300,000 $350,000 $400,000 $450,000 Median Sales Price - Condo Rolling 12-Month Calculation Gallatin County Belgrade 1-2003 1-2005 1-2007 1-2009 1-2011 1-2013 1-2015 1-2017 $50,000 $100,000 $150,000 $200,000 $250,000 $300,000 Current as of October 10, 2018. All data from Big Sky Country Multiple Listing Service®. Report © 2018 ShowingTime.
- 12. Local Market Update – September 2018 This is a research tool provided by the Big Sky Country MLS Greater Big Sky 5CN, 5CS, 5BMT, 5BMV Single Family September Year to Date Key Metrics 2017 2018 % Change Thru 9-2017 Thru 9-2018 % Change New Listings 9 11 + 22.2% 95 97 + 2.1% Pending Sales 8 8 0.0% 66 86 + 30.3% Closed Sales 8 5 - 37.5% 55 65 + 18.2% Days on Market Until Sale 190 263 + 38.4% 229 146 - 36.2% Median Sales Price* $1,162,500 $910,000 - 21.7% $1,237,500 $1,450,000 + 17.2% Average Sales Price* $1,442,563 $1,515,800 + 5.1% $1,407,866 $1,673,657 + 18.9% Percent of List Price Received* 97.9% 91.6% - 6.4% 95.0% 96.3% + 1.4% Inventory of Homes for Sale 77 57 - 26.0% –– –– –– Months Supply of Inventory 10.9 7.0 - 35.8% –– –– –– Condo/Townhouse September Year to Date Key Metrics 2017 2018 % Change Thru 9-2017 Thru 9-2018 % Change New Listings 14 12 - 14.3% 154 121 - 21.4% Pending Sales 16 11 - 31.3% 145 145 0.0% Closed Sales 13 12 - 7.7% 126 141 + 11.9% Days on Market Until Sale 95 119 + 25.3% 138 112 - 18.8% Median Sales Price* $320,000 $483,000 + 50.9% $362,500 $409,000 + 12.8% Average Sales Price* $374,500 $700,250 + 87.0% $450,621 $530,450 + 17.7% Percent of List Price Received* 96.7% 98.1% + 1.4% 96.4% 96.6% + 0.2% Inventory of Homes for Sale 98 67 - 31.6% –– –– –– Months Supply of Inventory 6.9 4.7 - 31.9% –– –– –– * Does not account for sale concessions and/or downpayment assistance. | Percent changes are calculated using rounded figures and can sometimes look extreme due to small sample size. A rolling 12-month calculation represents the current month and the 11 months prior in a single data point. If no activity occurred during a month, the line extends to the next available data point. Median Sales Price - Single Family Rolling 12-Month Calculation Gallatin County Greater Big Sky 1-2003 1-2005 1-2007 1-2009 1-2011 1-2013 1-2015 1-2017 $0 $500,000 $1,000,000 $1,500,000 $2,000,000 Median Sales Price - Condo Rolling 12-Month Calculation Gallatin County Greater Big Sky 1-2003 1-2005 1-2007 1-2009 1-2011 1-2013 1-2015 1-2017 $0 $100,000 $200,000 $300,000 $400,000 $500,000 $600,000 Current as of October 10, 2018. All data from Big Sky Country Multiple Listing Service®. Report © 2018 ShowingTime.
- 13. Local Market Update – September 2018 This is a research tool provided by the Big Sky Country MLS Livingston City Limits 6C Single Family September Year to Date Key Metrics 2017 2018 % Change Thru 9-2017 Thru 9-2018 % Change New Listings 15 10 - 33.3% 138 133 - 3.6% Pending Sales 12 10 - 16.7% 135 108 - 20.0% Closed Sales 11 14 + 27.3% 119 108 - 9.2% Days on Market Until Sale 62 46 - 25.8% 56 52 - 7.1% Median Sales Price* $230,000 $270,000 + 17.4% $225,000 $270,000 + 20.0% Average Sales Price* $237,082 $274,877 + 15.9% $228,377 $277,832 + 21.7% Percent of List Price Received* 97.1% 97.2% + 0.1% 97.3% 97.7% + 0.4% Inventory of Homes for Sale 26 37 + 42.3% –– –– –– Months Supply of Inventory 2.0 3.4 + 70.0% –– –– –– Condo/Townhouse September Year to Date Key Metrics 2017 2018 % Change Thru 9-2017 Thru 9-2018 % Change New Listings 6 4 - 33.3% 27 33 + 22.2% Pending Sales 4 4 0.0% 19 28 + 47.4% Closed Sales 2 4 + 100.0% 12 26 + 116.7% Days on Market Until Sale 2 1 - 50.0% 24 44 + 83.3% Median Sales Price* $394,750 $239,500 - 39.3% $146,500 $219,500 + 49.8% Average Sales Price* $394,750 $239,150 - 39.4% $192,774 $211,419 + 9.7% Percent of List Price Received* 99.1% 100.3% + 1.2% 96.2% 98.2% + 2.1% Inventory of Homes for Sale 9 10 + 11.1% –– –– –– Months Supply of Inventory 3.7 2.4 - 35.1% –– –– –– * Does not account for sale concessions and/or downpayment assistance. | Percent changes are calculated using rounded figures and can sometimes look extreme due to small sample size. A rolling 12-month calculation represents the current month and the 11 months prior in a single data point. If no activity occurred during a month, the line extends to the next available data point. Median Sales Price - Single Family Rolling 12-Month Calculation Gallatin County Livingston City Limits 1-2003 1-2005 1-2007 1-2009 1-2011 1-2013 1-2015 1-2017 $0 $100,000 $200,000 $300,000 $400,000 $500,000 Median Sales Price - Condo Rolling 12-Month Calculation Gallatin County Livingston City Limits 1-2003 1-2005 1-2007 1-2009 1-2011 1-2013 1-2015 1-2017 $50,000 $100,000 $150,000 $200,000 $250,000 $300,000 Current as of October 10, 2018. All data from Big Sky Country Multiple Listing Service®. Report © 2018 ShowingTime.
- 14. Local Market Update – September 2018 This is a research tool provided by the Big Sky Country MLS Greater Three Forks 4TC, 4TL, 4TN, 4TR, 4TSW Single Family September Year to Date Key Metrics 2017 2018 % Change Thru 9-2017 Thru 9-2018 % Change New Listings 2 6 + 200.0% 53 73 + 37.7% Pending Sales 4 4 0.0% 33 46 + 39.4% Closed Sales 3 5 + 66.7% 27 44 + 63.0% Days on Market Until Sale 49 79 + 61.2% 67 46 - 31.3% Median Sales Price* $242,490 $234,000 - 3.5% $242,490 $242,000 - 0.2% Average Sales Price* $253,830 $239,600 - 5.6% $249,432 $245,270 - 1.7% Percent of List Price Received* 97.2% 95.3% - 2.0% 96.9% 98.3% + 1.4% Inventory of Homes for Sale 18 29 + 61.1% –– –– –– Months Supply of Inventory 5.1 6.6 + 29.4% –– –– –– Condo/Townhouse September Year to Date Key Metrics 2017 2018 % Change Thru 9-2017 Thru 9-2018 % Change New Listings 0 1 –– 0 2 –– Pending Sales 0 1 –– 1 4 + 300.0% Closed Sales 0 0 –– 2 5 + 150.0% Days on Market Until Sale –– –– –– 154 302 + 96.1% Median Sales Price* –– –– –– $238,368 $215,000 - 9.8% Average Sales Price* –– –– –– $238,368 $215,000 - 9.8% Percent of List Price Received* –– –– –– 101.4% 100.0% - 1.4% Inventory of Homes for Sale 5 0 - 100.0% –– –– –– Months Supply of Inventory 5.0 –– –– –– –– –– * Does not account for sale concessions and/or downpayment assistance. | Percent changes are calculated using rounded figures and can sometimes look extreme due to small sample size. A rolling 12-month calculation represents the current month and the 11 months prior in a single data point. If no activity occurred during a month, the line extends to the next available data point. Median Sales Price - Single Family Rolling 12-Month Calculation Gallatin County Greater Three Forks 1-2003 1-2005 1-2007 1-2009 1-2011 1-2013 1-2015 1-2017 $0 $100,000 $200,000 $300,000 $400,000 $500,000 Median Sales Price - Condo Rolling 12-Month Calculation Gallatin County Greater Three Forks 1-2003 1-2005 1-2007 1-2009 1-2011 1-2013 1-2015 1-2017 $100,000 $150,000 $200,000 $250,000 $300,000 Current as of October 10, 2018. All data from Big Sky Country Multiple Listing Service®. Report © 2018 ShowingTime.
- 15. Local Market Update – September 2018 This is a research tool provided by the Big Sky Country MLS Greater Manhattan 4MA, 4MC, 4MN, 4MS Single Family September Year to Date Key Metrics 2017 2018 % Change Thru 9-2017 Thru 9-2018 % Change New Listings 12 9 - 25.0% 70 76 + 8.6% Pending Sales 7 8 + 14.3% 51 53 + 3.9% Closed Sales 6 6 0.0% 47 46 - 2.1% Days on Market Until Sale 20 61 + 205.0% 73 77 + 5.5% Median Sales Price* $319,500 $377,000 + 18.0% $307,000 $383,500 + 24.9% Average Sales Price* $320,483 $445,333 + 39.0% $372,164 $426,720 + 14.7% Percent of List Price Received* 98.3% 99.1% + 0.8% 98.1% 98.0% - 0.1% Inventory of Homes for Sale 27 33 + 22.2% –– –– –– Months Supply of Inventory 5.2 6.4 + 23.1% –– –– –– Condo/Townhouse September Year to Date Key Metrics 2017 2018 % Change Thru 9-2017 Thru 9-2018 % Change New Listings 0 0 –– 9 7 - 22.2% Pending Sales 1 0 - 100.0% 8 7 - 12.5% Closed Sales 3 1 - 66.7% 8 7 - 12.5% Days on Market Until Sale 8 4 - 50.0% 9 8 - 11.1% Median Sales Price* $115,000 $185,500 + 61.3% $134,000 $205,000 + 53.0% Average Sales Price* $119,667 $185,500 + 55.0% $144,438 $200,643 + 38.9% Percent of List Price Received* 99.2% 100.0% + 0.8% 99.0% 99.0% 0.0% Inventory of Homes for Sale 1 0 - 100.0% –– –– –– Months Supply of Inventory 0.8 –– –– –– –– –– * Does not account for sale concessions and/or downpayment assistance. | Percent changes are calculated using rounded figures and can sometimes look extreme due to small sample size. A rolling 12-month calculation represents the current month and the 11 months prior in a single data point. If no activity occurred during a month, the line extends to the next available data point. Median Sales Price - Single Family Rolling 12-Month Calculation Gallatin County Greater Manhattan 1-2003 1-2005 1-2007 1-2009 1-2011 1-2013 1-2015 1-2017 $100,000 $150,000 $200,000 $250,000 $300,000 $350,000 $400,000 $450,000 Median Sales Price - Condo Rolling 12-Month Calculation Gallatin County Greater Manhattan 1-2003 1-2005 1-2007 1-2009 1-2011 1-2013 1-2015 1-2017 $0 $50,000 $100,000 $150,000 $200,000 $250,000 $300,000 Current as of October 10, 2018. All data from Big Sky Country Multiple Listing Service®. Report © 2018 ShowingTime.