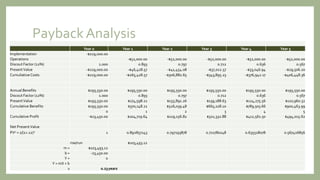
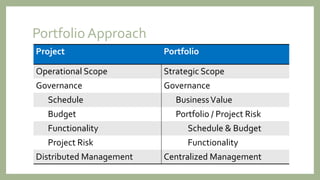
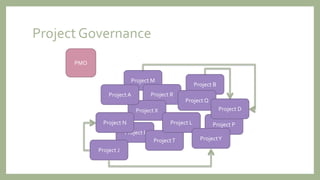
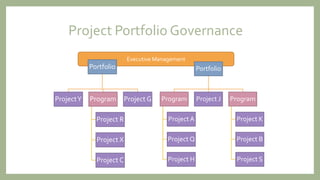
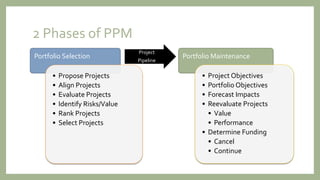
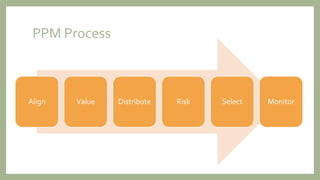
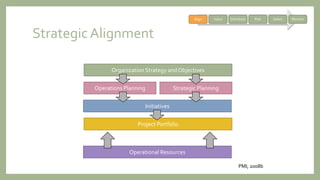
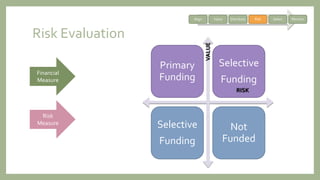
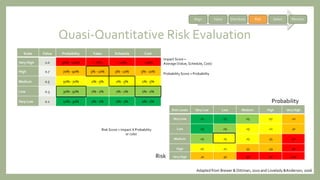
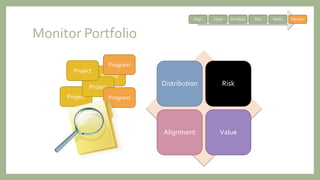
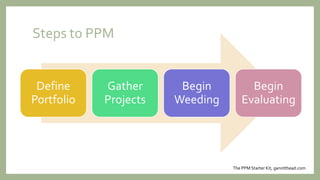
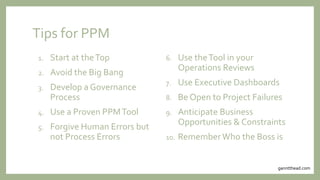
MAXIMIZINGTHE IMPACT
OFYOUR PROJECTS
Project Management Workshop
Brandon Olson, PhD
Purpose
•Defineprojects and project management
•Determine business value of projects
•Conceptualize projects as part of a portfolio
•Evaluate the portfolio approach to projects
•Develop strategies to measure and assess project value
Agenda
• Project Management Overview
• Introduction to BusinessValue
• Selecting Projects
• Portfolio Approach
• PPM Process
• Migrating to PPM
• Application to the PM
Agenda
• Project Management Overview
• Introduction to BusinessValue
• Selecting Projects
• Portfolio Approach
• PPM Process
• Migrating to PPM
• Application to the PM
Definitions of Project Management
• "...a complex, non-routine, one-time effort limited by
time, budget, resources, and performance specifications
designed to meet customer needs
(Gray & Larson, 2008)
• "...a temporary endeavor undertaken to create a unique
product, service, or result.“ (PMI, 2008)
One-Time
Project Characteristics
Kerzner, 2009
Specific Objective with
Defined Specifications
Defined Start
and End Dates
Funding Limitations
Consume Human and
Nonhuman Resources
Multiple Disciplines
Purpose of Project Management
Project ManagementA B
Change
Project Sources
Increase Revenue
(expand services)
Reduce Expenses
Directive
New product/services
Market Expansion
Increased Scalability
Process Improvement
Decision Making
Government Compliance
Self-Imposed
Competitive Standards
Why Projects?
Operational Islands
Project Management
Scope
TimeCost
Project
Manager
Project Success Rates
0%
10%
20%
30%
40%
50%
60%
Successful Challenged Failed
1994
1996
1998
2004
2009
2011
Gale, S. (2011). Failure rates finally drop. PM Network, 25(8), 10-11.
Sources of Project Failures
1. Project Champion
2. Process Shortcuts
3. Expectations Management
4. Variable Lock-In
5. EstimatingTechniques
6. Optimism
7. Resource Assumptions
8. People Management
9. Adapting to Change
10. Insufficient Resources
Adapted fromWhitten & Bentley, 2007
Project Success?
•How do you define project success?
Example – New Project
• Purpose: Deploy a new information system to manage product inventory
• Scope:
• Track product inventory as it is used
• Real-time inventory reporting
• “Wouldn’t it be cool if we could also keep track of the different types of
inventory we used”
• Budget:
• 1 pen/pencil, 1 sheet of paper, 1 developer
• Schedule:
• 45 seconds
Project Charter
• Purpose: Deploy a new information system to manage product
inventory
• Goal: Reduce production time by 25%
Agenda
• Project Management Overview
• Introduction to BusinessValue
• Selecting Projects
• Portfolio Approach
• PPM Process
• Migrating to PPM
• Application to the PM
ProjectValue
BusinessValue?
•What organizational benefits are created and realized
from the project?
•Operational
• New or improved functionality
•Strategic
• Quantifiable organizational-level benefits
Evaluating BusinessValue
• Return on Investment (ROI)
• Net PresentValue
• Payback Analysis
Return on Investment
Implementation Costs
Programmer $87,000.00 Return on Investment 10 yrs
Database Specialist $21,000.00 Implementation Costs $219,000.00
System Architect $28,000.00 OperatingCosts (10yrs) $520,000.00
Database Server $15,000.00 TotalCosts $739,000.00
Application Server $12,000.00
Desktop Devices $25,000.00 Benefits (10 yrs) $1,955,500.00
Project Management $31,000.00
$219,000.00
Operating Costs ROI: (Total Benefits -TotalCosts)
TechnicalSupport $25,000.00 TotalCosts
Programmer $16,500.00
Client Licenses $6,000.00 ROI: 164.61%
Training $4,500.00
$52,000.00
Annual Benefits
Increased capacity $56,400.00
Increased satisfaction $63,550.00
Reduced costs $75,600.00
$195,550.00
Net PresentValue
Year 0 Year 1 Year 2 Year 3 Year 4 Year 5 Total
Implementation -$219,000.00
Operations -$52,000.00 -$52,000.00 -$52,000.00 -$52,000.00 -$52,000.00
Discout Factor (12%) 1.000 0.893 0.797 0.712 0.636 0.567
PresentValue -$219,000.00 -$46,428.57 -$41,454.08 -$37,012.57 -$33,046.94 -$29,506.20
5Year Costs -$406,448.36
Annual Benefits $195,550.00 $195,550.00 $195,550.00 $195,550.00 $195,550.00 $195,550.00
Discout Factor (12%) 1.000 0.893 0.797 0.712 0.636 0.567
PresentValue $195,550.00 $174,598.21 $155,891.26 $139,188.63 $124,275.56 $110,960.32
5Year Benefits $900,463.99
Net PresentValue $494,015.62
PVn = 1/(1+i)n
PVn = 1/(1+.12)n 1 0.892857143 0.79719388 0.71178025 0.63551808 0.56742686
PaybackAnalysis
Year 0 Year 1 Year 2 Year 3 Year 4 Year 5
Implementation -$219,000.00
Operations -$52,000.00 -$52,000.00 -$52,000.00 -$52,000.00 -$52,000.00
Discout Factor (12%) 1.000 0.893 0.797 0.712 0.636 0.567
PresentValue -$219,000.00 -$46,428.57 -$41,454.08 -$37,012.57 -$33,046.94 -$29,506.20
Cumuliative Costs -$219,000.00 -$265,428.57 -$306,882.65 -$343,895.23 -$376,942.17 -$406,448.36
Annual Benefits $195,550.00 $195,550.00 $195,550.00 $195,550.00 $195,550.00 $195,550.00
Discout Factor (12%) 1.000 0.893 0.797 0.712 0.636 0.567
PresentValue $195,550.00 $174,598.21 $155,891.26 $139,188.63 $124,275.56 $110,960.32
Cumulative Benefits $195,550.00 $370,148.21 $526,039.48 $665,228.10 $789,503.66 $900,463.99
0 1 2 3 4 5
Cumulative Profit -$23,450.00 $104,719.64 $219,156.82 $321,332.88 $412,561.50 $494,015.62
Net PresentValue
PVn = 1/(1+.12)n 1 0.892857143 0.797193878 0.711780248 0.635518078 0.567426856
rise/run $103,493.12
m = $103,493.12
b = -23,450.00
Y = 0
Y = mX + b
x 0.23years
Evaluating BusinessValue
• Alignment with Business Strategy
Objective
Objective
Objective
Objective
BusinessValue
Benefits Alignment Value
Agenda
• Project Management Overview
• Introduction to BusinessValue
• Selecting Projects
• Portfolio Approach
• PPM Process
• Migrating to PPM
• Application to the PM
Project
V
Project Selection:
Resource Limitations
Project
W
Project
N
Project
R Project
S
Project
Y
Productivity
Time
Funds
Personnel
Project Selection:
Common Practices
• Political Influence
• SqueakyWheel
• FIFO
• LIFO
• Financial Attributes
(ROI/NPV/Payback)
Agenda
• Project Management Overview
• Introduction to BusinessValue
• Selecting Projects
• Portfolio Approach
• PPM Process
• Migrating to PPM
• Application to the PM
Challenging Project Environment
PM
PM
PM
PM
PM
PM
PM
PM
PM
PM
PM
PM
PM
PM
PM
PM
Portfolio Approach
Project Portfolio
Operational Scope Strategic Scope
Governance Governance
Schedule BusinessValue
Budget Portfolio / Project Risk
Functionality Schedule & Budget
Project Risk Functionality
Distributed Management Centralized Management
Project Portfolio Management
• Goal:
• Determine and deliver the mix of potential projects that will
result in the best utilization of human and cash resources and
maximize long-range growth and return on investment for the
firm.
Levine, 2005
A
B
Y
S
A
H
J
W
B
Align = 9
Value = 8
Align = 3
Value = 10
Project B
Project Governance
Project I
Project M
Project R
Project X
ProjectT
Project L
Project Q
Project P
ProjectY
Project D
ProjectA
Project N
Project J
PMO
Project Portfolio Governance
Executive Management
Portfolio
ProjectY Program
Project R
Project X
Project C
Project G
Portfolio
Program
ProjectA
Project Q
Project H
Project J Program
Project K
Project B
Project S
2 Phases of PPM
Portfolio Selection
• Propose Projects
• Align Projects
• Evaluate Projects
• Identify Risks/Value
• Rank Projects
• Select Projects
Project
Pipeline
Portfolio Maintenance
• Project Objectives
• Portfolio Objectives
• Forecast Impacts
• Reevaluate Projects
• Value
• Performance
• Determine Funding
• Cancel
• Continue
Agenda
• Project Management Overview
• Introduction to BusinessValue
• Selecting Projects
• Portfolio Approach
• PPM Process
• Migrating to PPM
• Application to the PM
PPM Process
Align Value Distribute Risk Select Monitor
StrategicAlignment
Organization Strategy and Objectives
Operations Planning Strategic Planning
Initiatives
Project Portfolio
Operational Resources
PMI, 2008b
Align Value Distribute Risk Select Monitor
What isValue?
• Return on Investment (ROI)
Estimated Lifetime Benefits – Estimated Lifetime Costs
Estimated Lifetime Costs
Example: $310,000 - $160,000
$160,000
= 0.94 = 94%
Align Value Distribute Risk Select Monitor
Project Selection
Informational
Infrastructure
Transactional
Strategic
Common IT Portfolio
CostAgility
MIT Sloan Center, 2007
InnovationIntegration
Align Value Distribute Risk Select Monitor
Risk Evaluation
Primary
Funding
Selective
Funding
Selective
Funding
Not
Funded
RISK
VALUE
Financial
Measure
Risk
Measure
Align Value Distribute Risk Select Monitor
Quasi-Quantitative Risk Evaluation
Scale Value Probability Value Schedule Cost
Very High 1.0 90% - 100% > 10% > 10% > 10%
High 0.7 70% - 90% 5% - 10% 5% - 10% 5% - 10%
Medium 0.5 50% - 70% 2% - 5% 2% - 5% 2% - 5%
Low 0.3 30% - 50% 1% - 2% 1% - 2% 1% - 2%
Very Low 0.1 10% - 30% 0% - 1% 0% - 1% 0% - 1%
Risk Levels Very Low Low Medium High Very High
Very Low .01 .03 .05 .07 .10
Low .03 .09 .15 .21 .30
Medium .05 .15 .25 .35 .50
High .07 .21 .35 .49 .70
Very High .10 .30 .50 .70 1.00
Probability
Risk
Impact Score =
Average (Value, Schedule, Cost)
Adapted from Brewer & Dittman, 2010 and Lovelady &Anderson, 2006
Probability Score = Probability
Risk Score = Impact X Probability
or color
Align Value Distribute Risk Select Monitor
Project Selection
Primary
Funding
Selective
Funding
Selective
Funding
Not
Funded
RISK
VALUE
Align Value Distribute Risk Select Monitor
Project Evaluation
• Alignment
• Value
• Distribution
• Risk Assessment
• Balance Resources ($ and people)
• Intangible Benefits
Consistency
Align Value Distribute Risk Select Monitor
Monitor Portfolio
Project
Project
Project
Project
Program
Program
Distribution Risk
Alignment Value
Align Value Distribute Risk Select Monitor
Agenda
• Project Management Overview
• Introduction to BusinessValue
• Selecting Projects
• Portfolio Approach
• PPM Process
• Migrating to PPM
• Application to the PM
Steps to PPM
Define
Portfolio
Gather
Projects
Begin
Weeding
Begin
Evaluating
The PPM Starter Kit, ganntthead.com
Tips for PPM
1. Start at theTop
2. Avoid the Big Bang
3. Develop a Governance
Process
4. Use a Proven PPMTool
5. Forgive Human Errors but
not Process Errors
6. Use theTool in your
Operations Reviews
7. Use Executive Dashboards
8. Be Open to Project Failures
9. Anticipate Business
Opportunities & Constraints
10. RememberWho the Boss is
ganntthead.com
Key Drivers of PPM
• 78% - Senior Management Receptivity
• 66% - Competent Portfolio Governance
• 62% - Standardized Metrics and Criteria
• 59% - Consistency & Logic of Objectives
• 58% - Mature Project Management Office
PM Network Survey, 2012
Formalized PM & PPM Practices
• Organizations with stable PPM practices see 64% of projects meet targeted ROI
(17% more than highly variable PPM practices)
• Formalization at both the project and portfolio levels results in higher
performance than formalization at just one level
• Formalization provides transparency that leads to improved allocation of
resources and an overall cooperation between projects
PM Network Survey, 2012 &Teller,Unger, Kock & Gemunden, 2012
64%
Why PPM?
0% 10% 20% 30% 40% 50% 60% 70% 80%
Improved Prod. Dev. Costs
Improved ROI
RevenueGrowth
Cost Reduction
Customer Satisfaction
40%
45%
58%
59%
73%
PM Network Survey, 2012
Agenda
• Project Management Overview
• Introduction to BusinessValue
• Selecting Projects
• Portfolio Approach
• PPM Process
• Migrating to PPM
• Application to the PM
What does this mean to me?
My
Project
Business Strategies
What does this mean to me?
My
Project
Project
J
Project
C
Project
Q
Project
X
Project
P
Project
N
My
Project
Project
G
Value
Functionality BudgetSchedule
Business
Strategies
EnsuringValue
•Develop a ProjectValue Chain
(Think Critical Path)
•IncludeValue in Risk Management Strategy
•EvaluateValue Performance Frequently
•Target Metric for Change Management
Suggested Readings
July, 2012
Volume 30
Issue 5
References
• Brewer, J. L., & Dittman, K. C. (2010). Methods of IT project management. Boston, MA: Prentice Hall.
• Gale, S. (2011). Failure rates finally drop. PM Network, 25(8), 10-11.
• Gray, C.F., & Larson, E.W. (2008). Project management:The managerial process (4th ed.). Boston, MA: McGraw Hill.
• Lovelady, R., & Anderson, A. (2006). Psst:Want to take a risk? In G. Richardson & C. Butler (Eds.), Readings in
information technology project management (pp. 166-171). Boston, MA:Thomson/CourseTechnology.
• Pearlson, K.E. & Saunders, C.S. (2010). Managing and using information systems:A strategic approach (4th ed.).
Hoboken, NJ:Wiley.
• Project Management Institute (2008). A guide to the project management body of knowledge (4th ed.). Newtown
Square: PA: Author.
• Project Management Institute (2012).The power of portfolio management. PM Network, 26(6), 14-15.
• Teller, J., Unger, B.N., Kock, A., & Gemunden, H.G. (2012). Formalization of project portfolio management:The
moderating role of project portfolio complexity.The International Journal of Project Management, 30(5), 596-607.
doi:10.1016/j.ijproman.2012.01.020.
• Whitten, J.L., & Bentley, L.D. (2007). Systems analysis and design methods (7th ed.). Boston, MA: McGrawHill /Irwin.
Posted Presentations
• My Presentations
• http://faculty.css.edu/bolson1/presentations.html
• Topic 1: TheValue of Project Management
• http://faculty.css.edu/bolson1/presentations/ValueofPM.pdf
• Topic 2: 10 Ways to IncreaseYour Project’s Success
• http://faculty.css.edu/bolson1/presentations/ProjectSuccess.pdf
• http://faculty.css.edu/bolson1/presentations/ProjectSuccess2.pdf
• Topic 3: Maximizing the Impact ofYour Projects
• http://faculty.css.edu/bolson1/presentations/ProjectImpact.pdf

Maximizing the Impact of Your Projects

  • 1.
    MAXIMIZINGTHE IMPACT OFYOUR PROJECTS ProjectManagement Workshop Brandon Olson, PhD
  • 2.
    Purpose •Defineprojects and projectmanagement •Determine business value of projects •Conceptualize projects as part of a portfolio •Evaluate the portfolio approach to projects •Develop strategies to measure and assess project value
  • 3.
    Agenda • Project ManagementOverview • Introduction to BusinessValue • Selecting Projects • Portfolio Approach • PPM Process • Migrating to PPM • Application to the PM
  • 4.
    Agenda • Project ManagementOverview • Introduction to BusinessValue • Selecting Projects • Portfolio Approach • PPM Process • Migrating to PPM • Application to the PM
  • 5.
    Definitions of ProjectManagement • "...a complex, non-routine, one-time effort limited by time, budget, resources, and performance specifications designed to meet customer needs (Gray & Larson, 2008) • "...a temporary endeavor undertaken to create a unique product, service, or result.“ (PMI, 2008) One-Time
  • 6.
    Project Characteristics Kerzner, 2009 SpecificObjective with Defined Specifications Defined Start and End Dates Funding Limitations Consume Human and Nonhuman Resources Multiple Disciplines
  • 7.
    Purpose of ProjectManagement Project ManagementA B Change
  • 8.
    Project Sources Increase Revenue (expandservices) Reduce Expenses Directive New product/services Market Expansion Increased Scalability Process Improvement Decision Making Government Compliance Self-Imposed Competitive Standards
  • 9.
  • 10.
  • 11.
    Project Success Rates 0% 10% 20% 30% 40% 50% 60% SuccessfulChallenged Failed 1994 1996 1998 2004 2009 2011 Gale, S. (2011). Failure rates finally drop. PM Network, 25(8), 10-11.
  • 12.
    Sources of ProjectFailures 1. Project Champion 2. Process Shortcuts 3. Expectations Management 4. Variable Lock-In 5. EstimatingTechniques 6. Optimism 7. Resource Assumptions 8. People Management 9. Adapting to Change 10. Insufficient Resources Adapted fromWhitten & Bentley, 2007
  • 13.
    Project Success? •How doyou define project success?
  • 14.
    Example – NewProject • Purpose: Deploy a new information system to manage product inventory • Scope: • Track product inventory as it is used • Real-time inventory reporting • “Wouldn’t it be cool if we could also keep track of the different types of inventory we used” • Budget: • 1 pen/pencil, 1 sheet of paper, 1 developer • Schedule: • 45 seconds
  • 15.
    Project Charter • Purpose:Deploy a new information system to manage product inventory • Goal: Reduce production time by 25%
  • 16.
    Agenda • Project ManagementOverview • Introduction to BusinessValue • Selecting Projects • Portfolio Approach • PPM Process • Migrating to PPM • Application to the PM
  • 17.
  • 18.
    BusinessValue? •What organizational benefitsare created and realized from the project? •Operational • New or improved functionality •Strategic • Quantifiable organizational-level benefits
  • 19.
    Evaluating BusinessValue • Returnon Investment (ROI) • Net PresentValue • Payback Analysis
  • 20.
    Return on Investment ImplementationCosts Programmer $87,000.00 Return on Investment 10 yrs Database Specialist $21,000.00 Implementation Costs $219,000.00 System Architect $28,000.00 OperatingCosts (10yrs) $520,000.00 Database Server $15,000.00 TotalCosts $739,000.00 Application Server $12,000.00 Desktop Devices $25,000.00 Benefits (10 yrs) $1,955,500.00 Project Management $31,000.00 $219,000.00 Operating Costs ROI: (Total Benefits -TotalCosts) TechnicalSupport $25,000.00 TotalCosts Programmer $16,500.00 Client Licenses $6,000.00 ROI: 164.61% Training $4,500.00 $52,000.00 Annual Benefits Increased capacity $56,400.00 Increased satisfaction $63,550.00 Reduced costs $75,600.00 $195,550.00
  • 21.
    Net PresentValue Year 0Year 1 Year 2 Year 3 Year 4 Year 5 Total Implementation -$219,000.00 Operations -$52,000.00 -$52,000.00 -$52,000.00 -$52,000.00 -$52,000.00 Discout Factor (12%) 1.000 0.893 0.797 0.712 0.636 0.567 PresentValue -$219,000.00 -$46,428.57 -$41,454.08 -$37,012.57 -$33,046.94 -$29,506.20 5Year Costs -$406,448.36 Annual Benefits $195,550.00 $195,550.00 $195,550.00 $195,550.00 $195,550.00 $195,550.00 Discout Factor (12%) 1.000 0.893 0.797 0.712 0.636 0.567 PresentValue $195,550.00 $174,598.21 $155,891.26 $139,188.63 $124,275.56 $110,960.32 5Year Benefits $900,463.99 Net PresentValue $494,015.62 PVn = 1/(1+i)n PVn = 1/(1+.12)n 1 0.892857143 0.79719388 0.71178025 0.63551808 0.56742686
  • 22.
    PaybackAnalysis Year 0 Year1 Year 2 Year 3 Year 4 Year 5 Implementation -$219,000.00 Operations -$52,000.00 -$52,000.00 -$52,000.00 -$52,000.00 -$52,000.00 Discout Factor (12%) 1.000 0.893 0.797 0.712 0.636 0.567 PresentValue -$219,000.00 -$46,428.57 -$41,454.08 -$37,012.57 -$33,046.94 -$29,506.20 Cumuliative Costs -$219,000.00 -$265,428.57 -$306,882.65 -$343,895.23 -$376,942.17 -$406,448.36 Annual Benefits $195,550.00 $195,550.00 $195,550.00 $195,550.00 $195,550.00 $195,550.00 Discout Factor (12%) 1.000 0.893 0.797 0.712 0.636 0.567 PresentValue $195,550.00 $174,598.21 $155,891.26 $139,188.63 $124,275.56 $110,960.32 Cumulative Benefits $195,550.00 $370,148.21 $526,039.48 $665,228.10 $789,503.66 $900,463.99 0 1 2 3 4 5 Cumulative Profit -$23,450.00 $104,719.64 $219,156.82 $321,332.88 $412,561.50 $494,015.62 Net PresentValue PVn = 1/(1+.12)n 1 0.892857143 0.797193878 0.711780248 0.635518078 0.567426856 rise/run $103,493.12 m = $103,493.12 b = -23,450.00 Y = 0 Y = mX + b x 0.23years
  • 23.
    Evaluating BusinessValue • Alignmentwith Business Strategy Objective Objective Objective Objective
  • 24.
  • 25.
    Agenda • Project ManagementOverview • Introduction to BusinessValue • Selecting Projects • Portfolio Approach • PPM Process • Migrating to PPM • Application to the PM
  • 26.
    Project V Project Selection: Resource Limitations Project W Project N Project RProject S Project Y Productivity Time Funds Personnel
  • 27.
    Project Selection: Common Practices •Political Influence • SqueakyWheel • FIFO • LIFO • Financial Attributes (ROI/NPV/Payback)
  • 28.
    Agenda • Project ManagementOverview • Introduction to BusinessValue • Selecting Projects • Portfolio Approach • PPM Process • Migrating to PPM • Application to the PM
  • 29.
  • 30.
    Portfolio Approach Project Portfolio OperationalScope Strategic Scope Governance Governance Schedule BusinessValue Budget Portfolio / Project Risk Functionality Schedule & Budget Project Risk Functionality Distributed Management Centralized Management
  • 31.
    Project Portfolio Management •Goal: • Determine and deliver the mix of potential projects that will result in the best utilization of human and cash resources and maximize long-range growth and return on investment for the firm. Levine, 2005 A B Y S A H J W B Align = 9 Value = 8 Align = 3 Value = 10
  • 32.
    Project B Project Governance ProjectI Project M Project R Project X ProjectT Project L Project Q Project P ProjectY Project D ProjectA Project N Project J PMO
  • 33.
    Project Portfolio Governance ExecutiveManagement Portfolio ProjectY Program Project R Project X Project C Project G Portfolio Program ProjectA Project Q Project H Project J Program Project K Project B Project S
  • 34.
    2 Phases ofPPM Portfolio Selection • Propose Projects • Align Projects • Evaluate Projects • Identify Risks/Value • Rank Projects • Select Projects Project Pipeline Portfolio Maintenance • Project Objectives • Portfolio Objectives • Forecast Impacts • Reevaluate Projects • Value • Performance • Determine Funding • Cancel • Continue
  • 35.
    Agenda • Project ManagementOverview • Introduction to BusinessValue • Selecting Projects • Portfolio Approach • PPM Process • Migrating to PPM • Application to the PM
  • 36.
    PPM Process Align ValueDistribute Risk Select Monitor
  • 37.
    StrategicAlignment Organization Strategy andObjectives Operations Planning Strategic Planning Initiatives Project Portfolio Operational Resources PMI, 2008b Align Value Distribute Risk Select Monitor
  • 38.
    What isValue? • Returnon Investment (ROI) Estimated Lifetime Benefits – Estimated Lifetime Costs Estimated Lifetime Costs Example: $310,000 - $160,000 $160,000 = 0.94 = 94% Align Value Distribute Risk Select Monitor
  • 39.
    Project Selection Informational Infrastructure Transactional Strategic Common ITPortfolio CostAgility MIT Sloan Center, 2007 InnovationIntegration Align Value Distribute Risk Select Monitor
  • 40.
  • 41.
    Quasi-Quantitative Risk Evaluation ScaleValue Probability Value Schedule Cost Very High 1.0 90% - 100% > 10% > 10% > 10% High 0.7 70% - 90% 5% - 10% 5% - 10% 5% - 10% Medium 0.5 50% - 70% 2% - 5% 2% - 5% 2% - 5% Low 0.3 30% - 50% 1% - 2% 1% - 2% 1% - 2% Very Low 0.1 10% - 30% 0% - 1% 0% - 1% 0% - 1% Risk Levels Very Low Low Medium High Very High Very Low .01 .03 .05 .07 .10 Low .03 .09 .15 .21 .30 Medium .05 .15 .25 .35 .50 High .07 .21 .35 .49 .70 Very High .10 .30 .50 .70 1.00 Probability Risk Impact Score = Average (Value, Schedule, Cost) Adapted from Brewer & Dittman, 2010 and Lovelady &Anderson, 2006 Probability Score = Probability Risk Score = Impact X Probability or color Align Value Distribute Risk Select Monitor
  • 42.
  • 43.
    Project Evaluation • Alignment •Value • Distribution • Risk Assessment • Balance Resources ($ and people) • Intangible Benefits Consistency Align Value Distribute Risk Select Monitor
  • 44.
  • 45.
    Agenda • Project ManagementOverview • Introduction to BusinessValue • Selecting Projects • Portfolio Approach • PPM Process • Migrating to PPM • Application to the PM
  • 46.
  • 47.
    Tips for PPM 1.Start at theTop 2. Avoid the Big Bang 3. Develop a Governance Process 4. Use a Proven PPMTool 5. Forgive Human Errors but not Process Errors 6. Use theTool in your Operations Reviews 7. Use Executive Dashboards 8. Be Open to Project Failures 9. Anticipate Business Opportunities & Constraints 10. RememberWho the Boss is ganntthead.com
  • 48.
    Key Drivers ofPPM • 78% - Senior Management Receptivity • 66% - Competent Portfolio Governance • 62% - Standardized Metrics and Criteria • 59% - Consistency & Logic of Objectives • 58% - Mature Project Management Office PM Network Survey, 2012
  • 49.
    Formalized PM &PPM Practices • Organizations with stable PPM practices see 64% of projects meet targeted ROI (17% more than highly variable PPM practices) • Formalization at both the project and portfolio levels results in higher performance than formalization at just one level • Formalization provides transparency that leads to improved allocation of resources and an overall cooperation between projects PM Network Survey, 2012 &Teller,Unger, Kock & Gemunden, 2012 64%
  • 50.
    Why PPM? 0% 10%20% 30% 40% 50% 60% 70% 80% Improved Prod. Dev. Costs Improved ROI RevenueGrowth Cost Reduction Customer Satisfaction 40% 45% 58% 59% 73% PM Network Survey, 2012
  • 51.
    Agenda • Project ManagementOverview • Introduction to BusinessValue • Selecting Projects • Portfolio Approach • PPM Process • Migrating to PPM • Application to the PM
  • 52.
    What does thismean to me? My Project Business Strategies
  • 53.
    What does thismean to me? My Project Project J Project C Project Q Project X Project P Project N My Project Project G Value Functionality BudgetSchedule Business Strategies
  • 54.
    EnsuringValue •Develop a ProjectValueChain (Think Critical Path) •IncludeValue in Risk Management Strategy •EvaluateValue Performance Frequently •Target Metric for Change Management
  • 55.
  • 56.
    References • Brewer, J.L., & Dittman, K. C. (2010). Methods of IT project management. Boston, MA: Prentice Hall. • Gale, S. (2011). Failure rates finally drop. PM Network, 25(8), 10-11. • Gray, C.F., & Larson, E.W. (2008). Project management:The managerial process (4th ed.). Boston, MA: McGraw Hill. • Lovelady, R., & Anderson, A. (2006). Psst:Want to take a risk? In G. Richardson & C. Butler (Eds.), Readings in information technology project management (pp. 166-171). Boston, MA:Thomson/CourseTechnology. • Pearlson, K.E. & Saunders, C.S. (2010). Managing and using information systems:A strategic approach (4th ed.). Hoboken, NJ:Wiley. • Project Management Institute (2008). A guide to the project management body of knowledge (4th ed.). Newtown Square: PA: Author. • Project Management Institute (2012).The power of portfolio management. PM Network, 26(6), 14-15. • Teller, J., Unger, B.N., Kock, A., & Gemunden, H.G. (2012). Formalization of project portfolio management:The moderating role of project portfolio complexity.The International Journal of Project Management, 30(5), 596-607. doi:10.1016/j.ijproman.2012.01.020. • Whitten, J.L., & Bentley, L.D. (2007). Systems analysis and design methods (7th ed.). Boston, MA: McGrawHill /Irwin.
  • 57.
    Posted Presentations • MyPresentations • http://faculty.css.edu/bolson1/presentations.html • Topic 1: TheValue of Project Management • http://faculty.css.edu/bolson1/presentations/ValueofPM.pdf • Topic 2: 10 Ways to IncreaseYour Project’s Success • http://faculty.css.edu/bolson1/presentations/ProjectSuccess.pdf • http://faculty.css.edu/bolson1/presentations/ProjectSuccess2.pdf • Topic 3: Maximizing the Impact ofYour Projects • http://faculty.css.edu/bolson1/presentations/ProjectImpact.pdf

Editor's Notes

  • #10 Project management is used to bridge the gap between functional units and layers of management.
  • #18 1989 Construction begins1990 Feasibility study found the baggage handling system was not feasbible1991 United Airlines contracted with BAE Systems to construct automated system for their concourse1991 DIA requests for full system resulted in only three bids; all rejected1992 DIA recruited BAE to build complete system1992 Budget cuts, expanded system for larger luggage (skis), changes to scope, etc.1993 Target missed, again, again, etc.1994 DIA demo disaster with BAE approval (smashed totes, clothes torn out, etc)1995 Airport opened without complete automated systemFinding: don’t let the system become the critical path16 months late at $1.1M per day (maintenance and lost revenue)