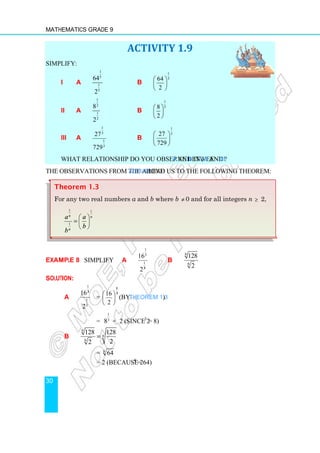
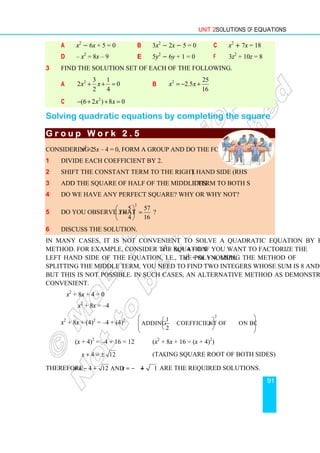
1. a) 27 belongs to the sets of natural numbers, whole numbers and integers.
b) -17 belongs to the set of integers.
c) -7 belongs to the set of integers.
d) 0.625 belongs to the set of rational numbers.
e) 0.615 belongs to the set of rational numbers.
2. i) a) The set of natural numbers is the set {1, 2, 3, ...}.
b) The set of whole numbers is the set {0, 1, 2, 3, ...}.
c) The set of integers is the set {..., -3, -2, -1, 0, 1, 2, 3, ...}.
d

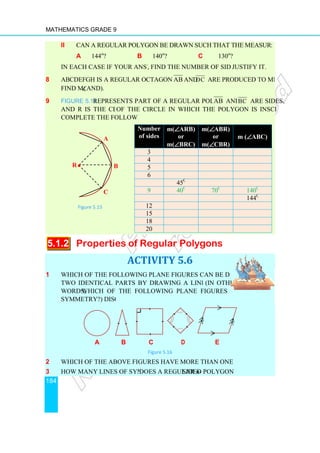
![Mathematics Grade 9
168
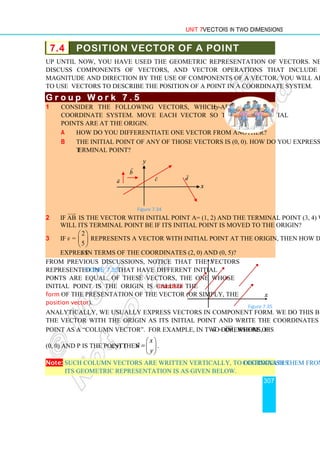
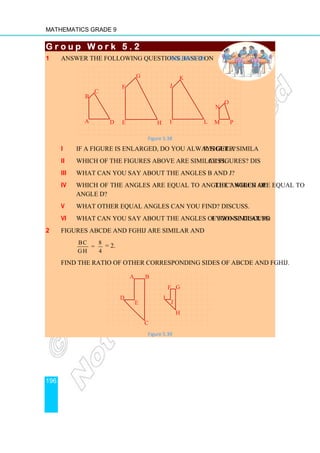
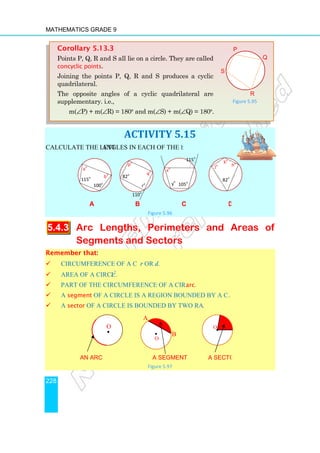
G r o u p W o r k 4 . 7
G r o u p W o r k 4 . 7
G r o u p W o r k 4 . 7
G r o u p W o r k 4 . 7
1 Let f (x) be a quadratic function. Discuss how to
determine the maximum or minimum value of f (x).
2 Justify your conclusion by considering some parabolas.
Recall that if the leading coefficient of the quadratic function f (x) = ax2
+ bx + c is
positive (a 0), then the graph of the function opens upward (and if a 0, then the
graph opens downward). When the graph of a quadratic function opens upward, the
function has a minimum value, whereas if the graph opens downward, it has a
maximum value. The minimum or the maximum value of a quadratic function is
obtained at the vertex of its graph.
Example 14 The minimum value of a quadratic function expressed as
f (x) = (x + k)2
+ c is c.
Similarly, the maximum value of 2
( ) ( ) is .
f x x k c c
= − + +
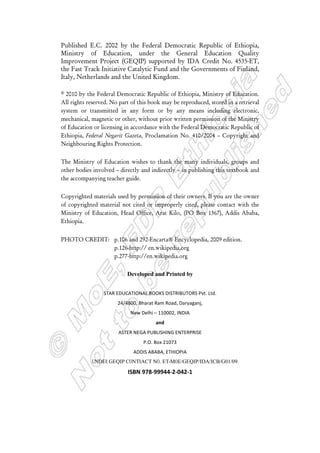
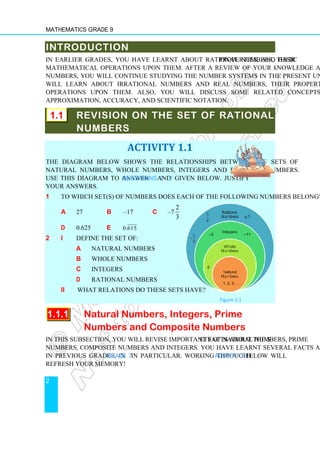
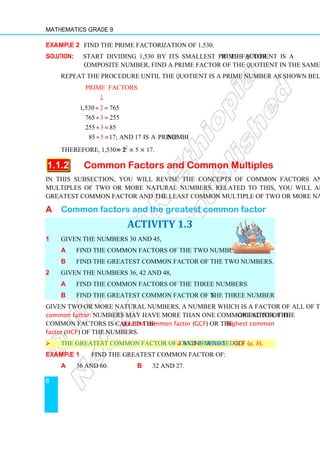
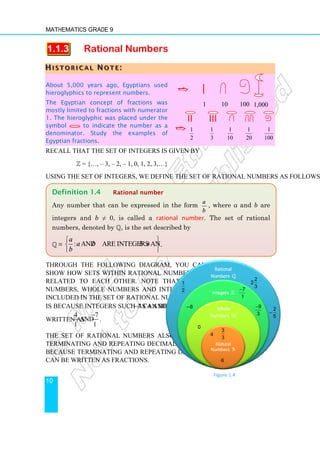
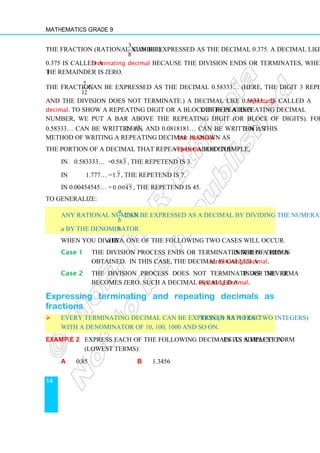
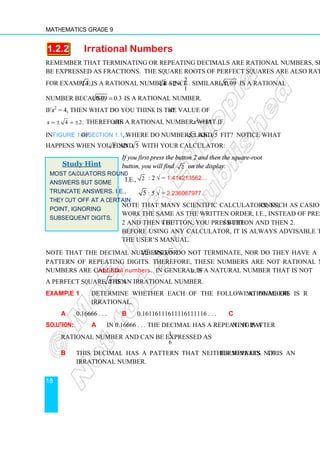
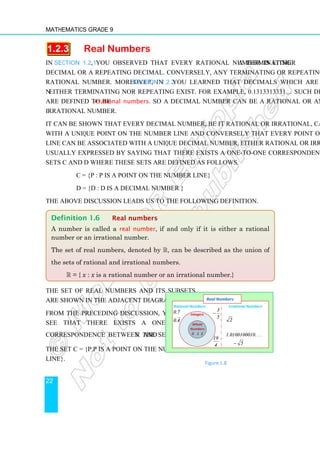
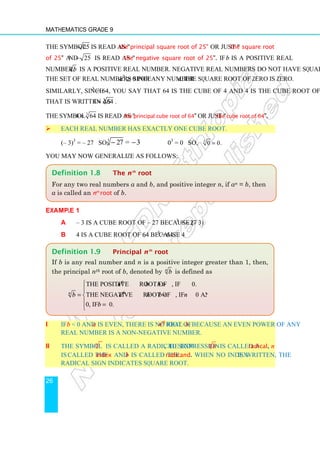
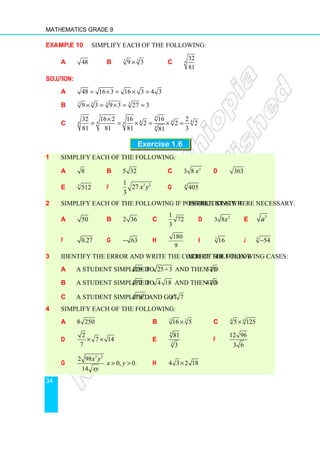
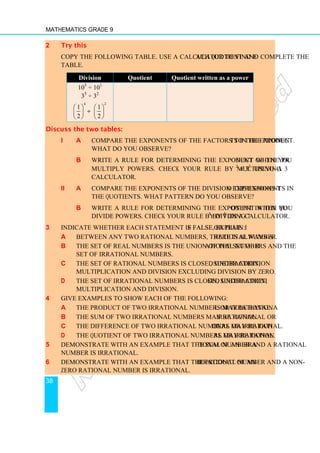
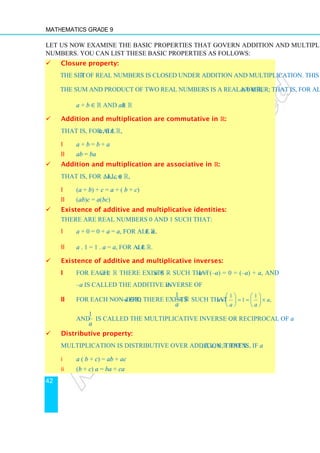
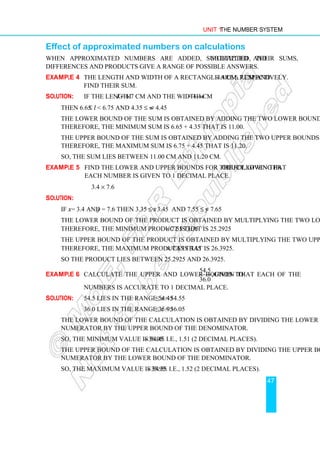
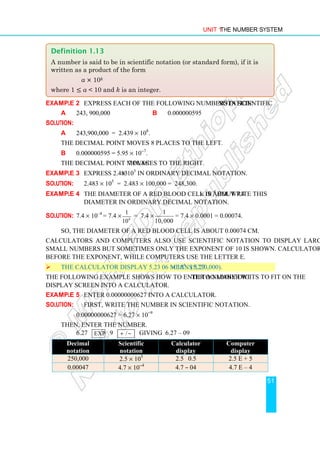
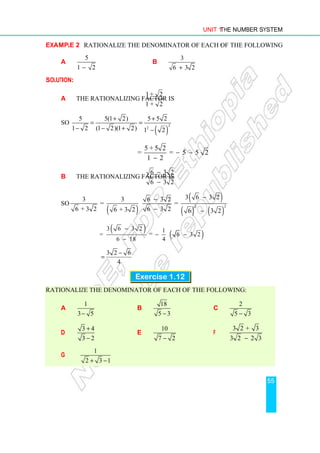
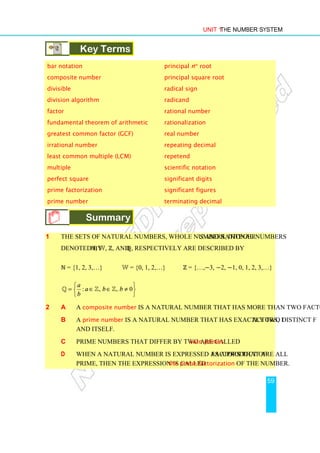
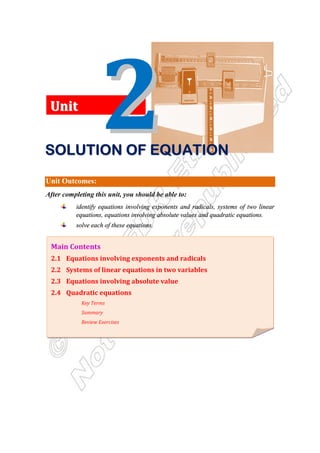
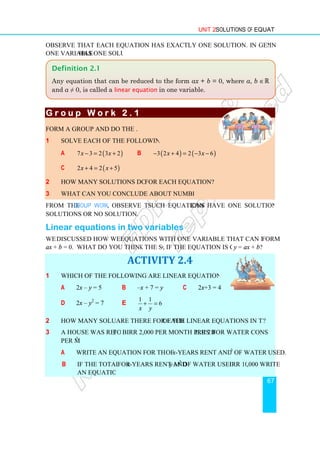
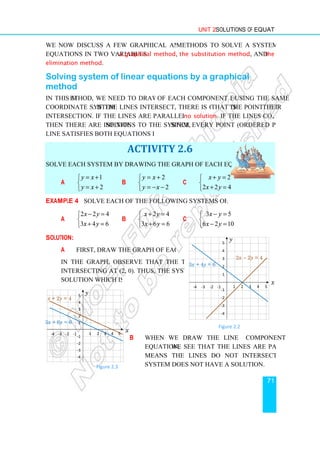
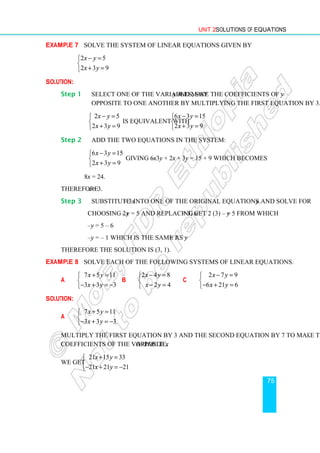
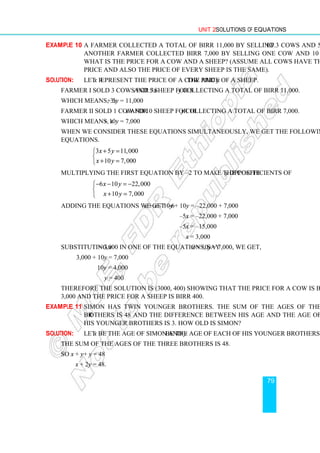
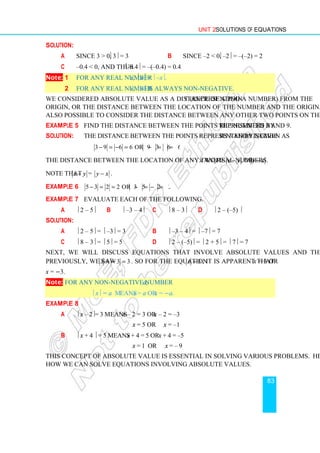
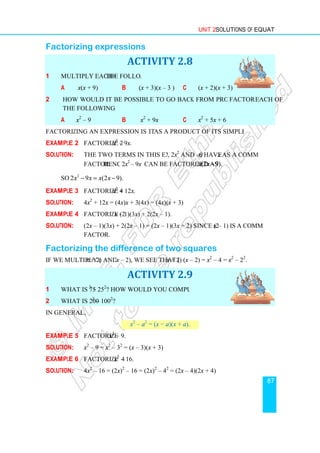
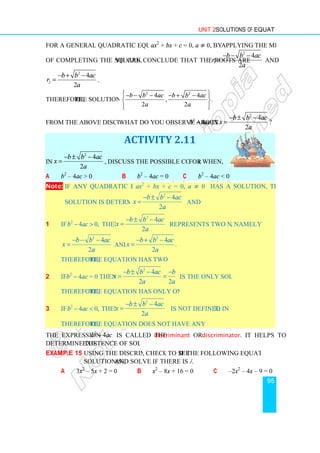
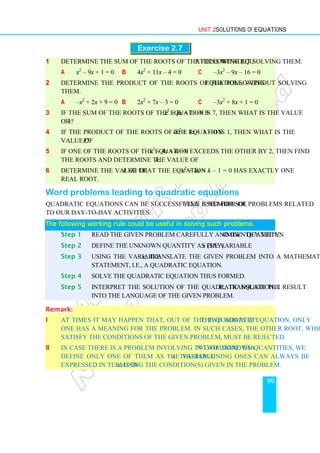
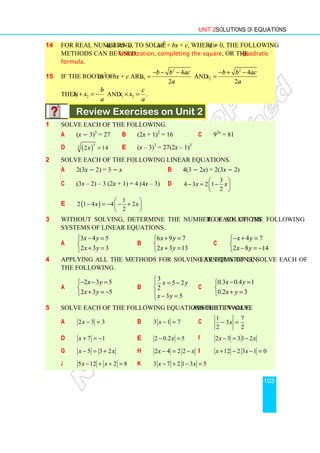
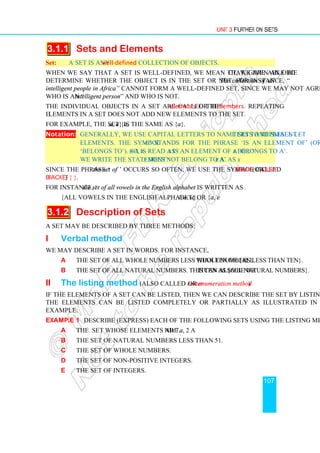
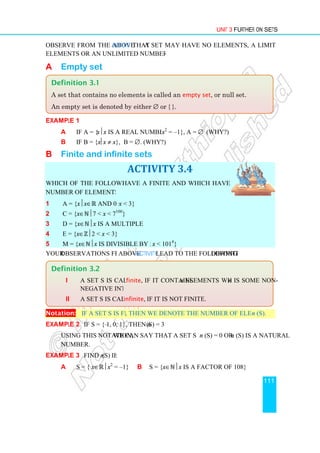
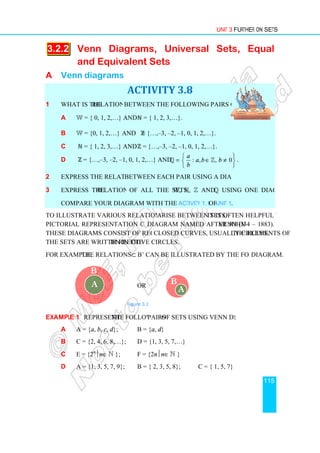
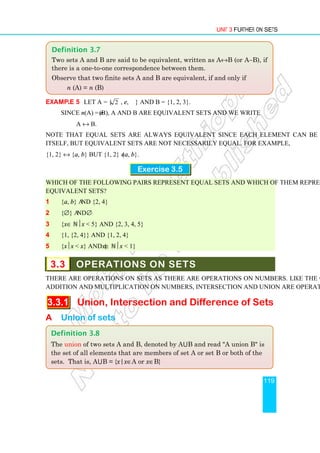
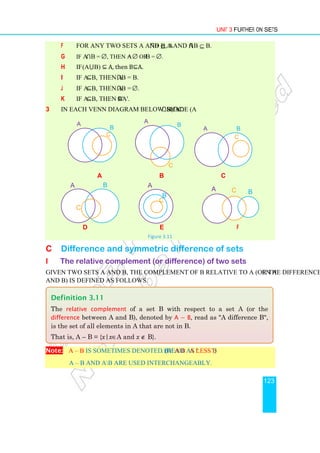
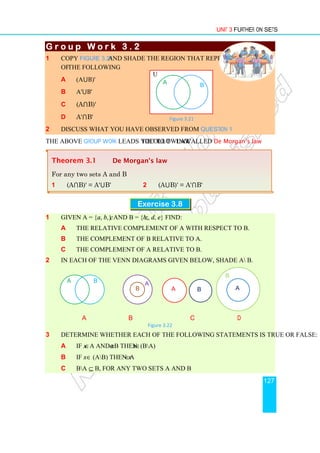
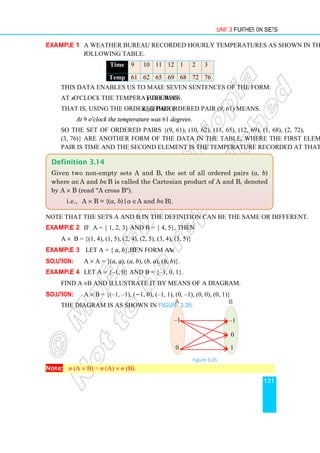
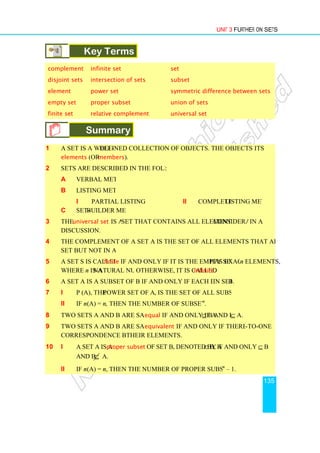
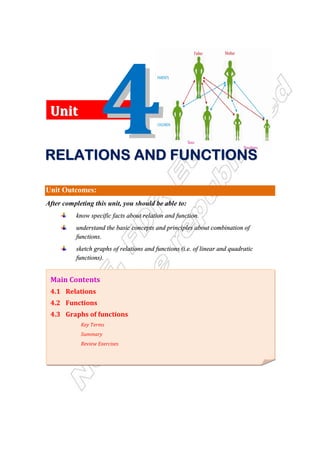
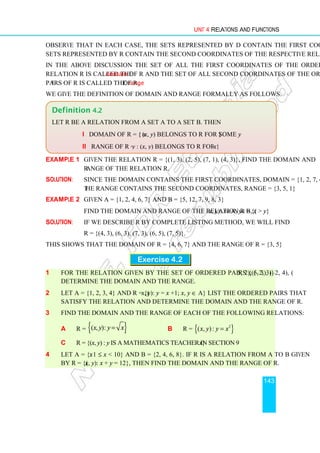
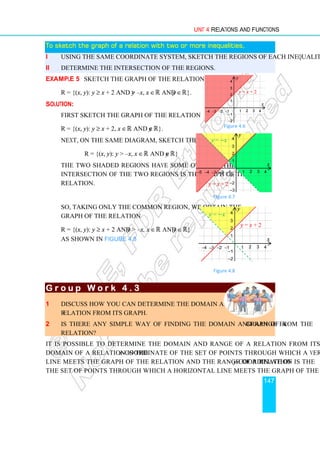
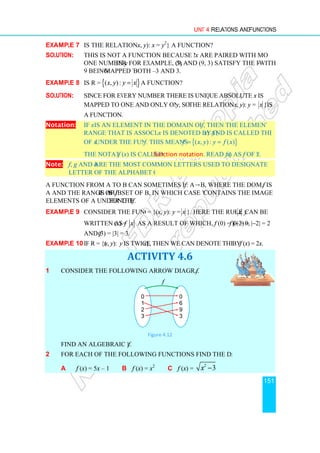
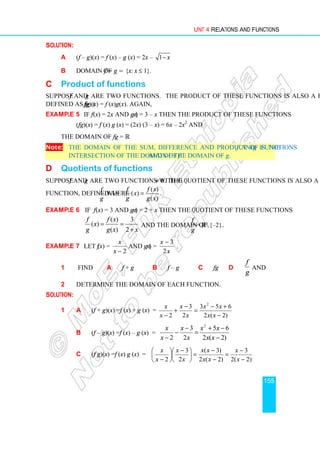
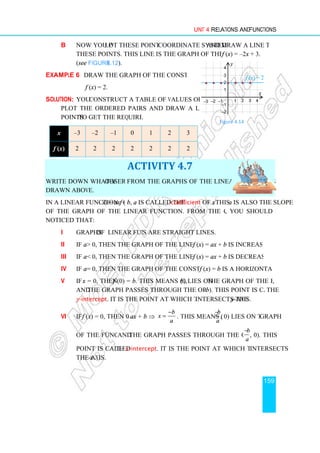
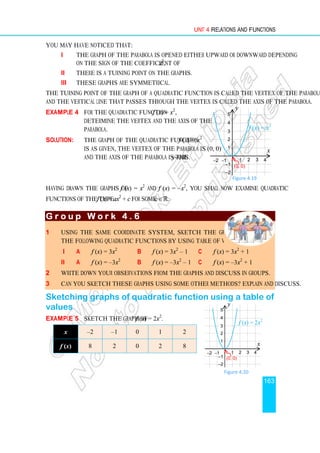
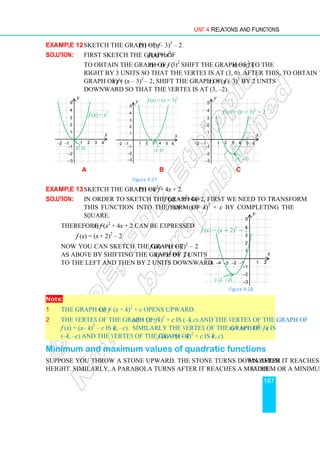
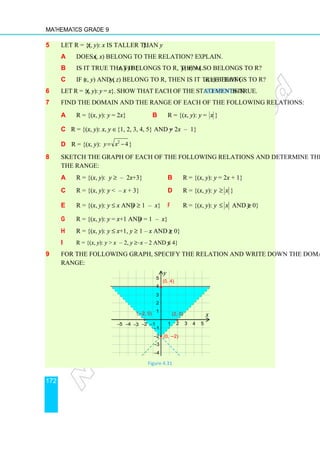
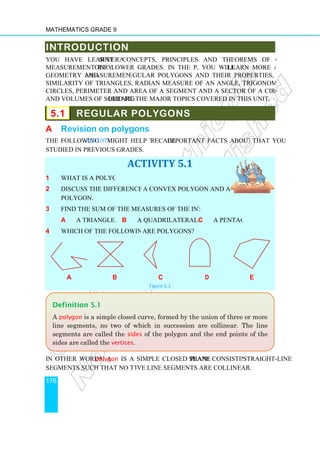
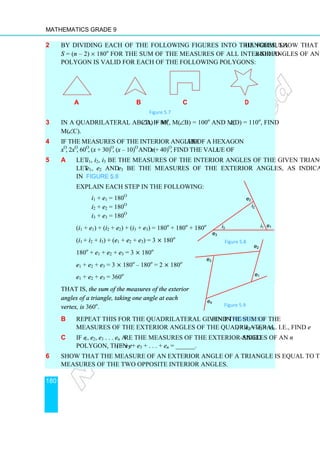
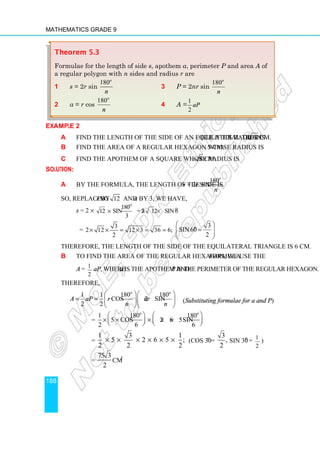
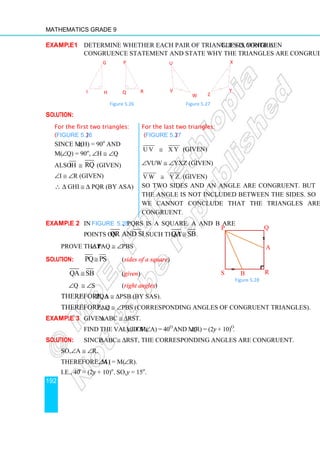
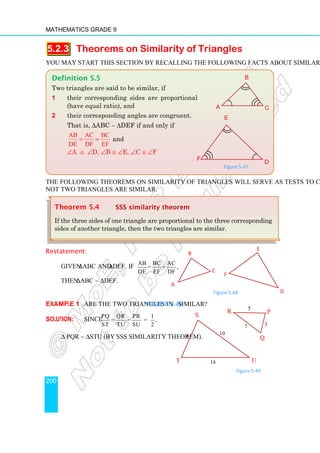
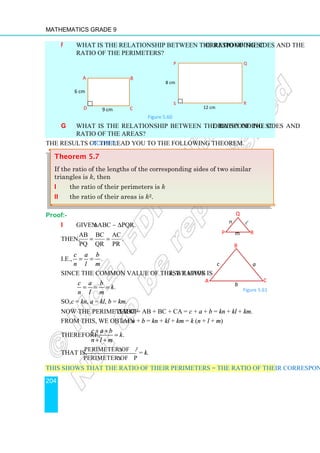
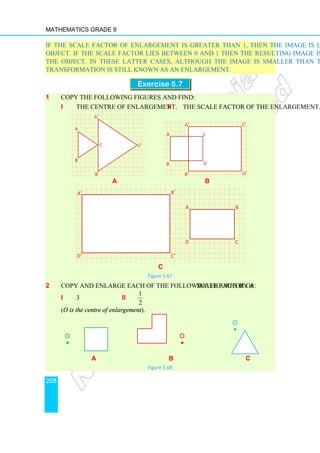
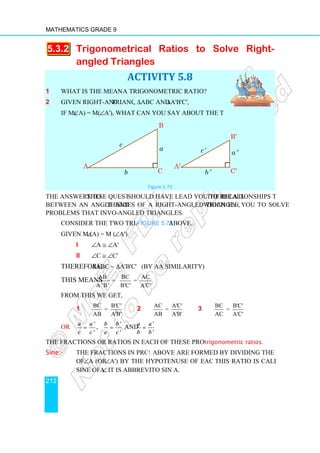
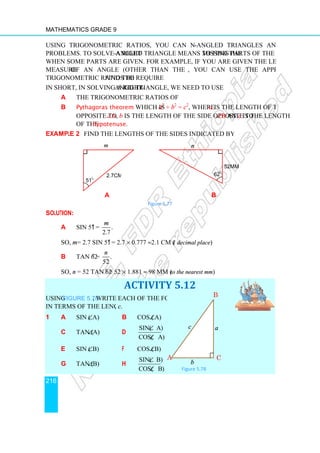
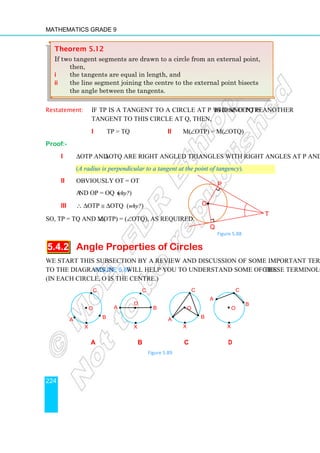
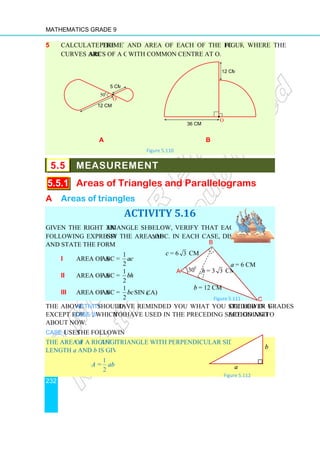
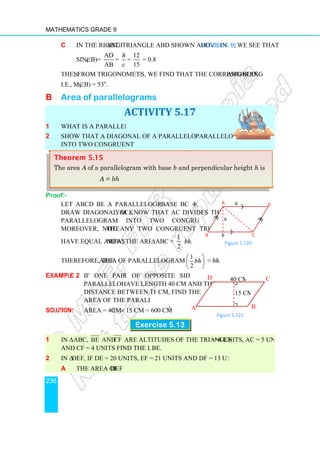
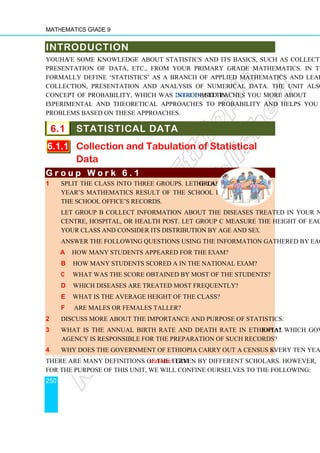
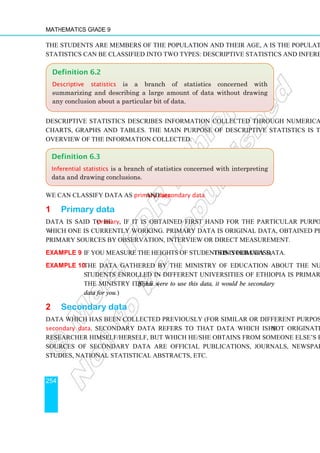
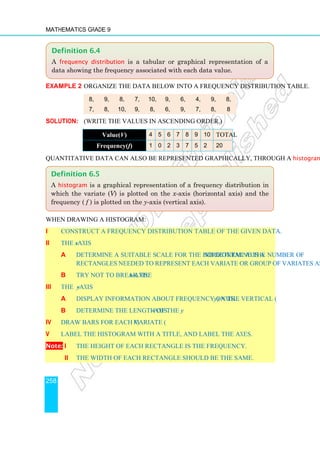
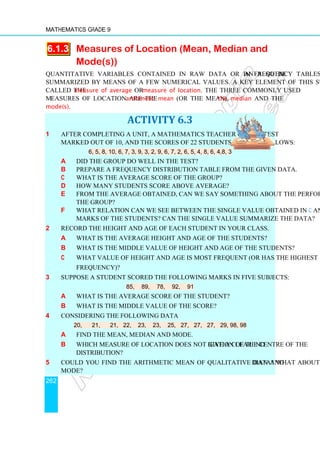
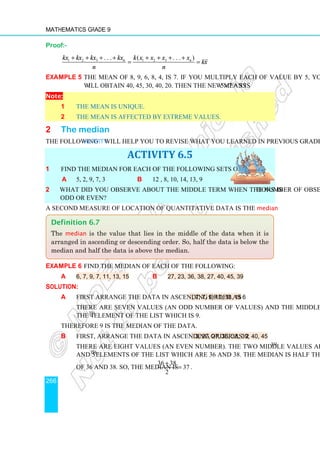
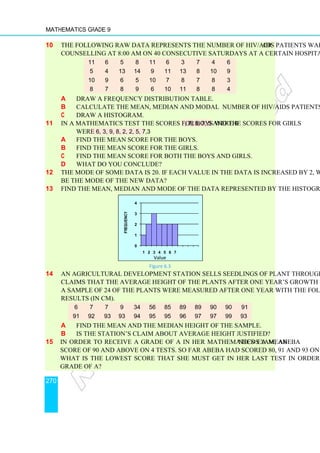
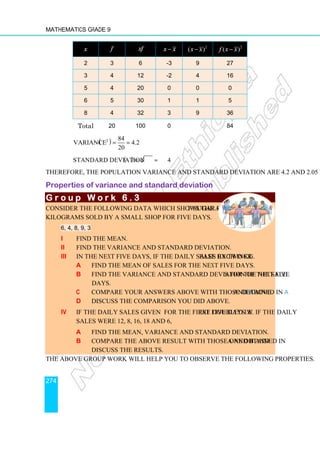
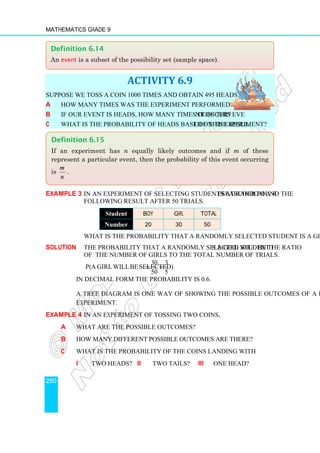
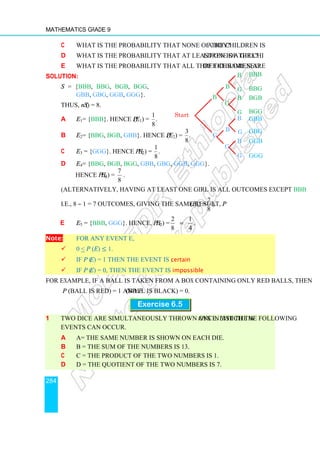
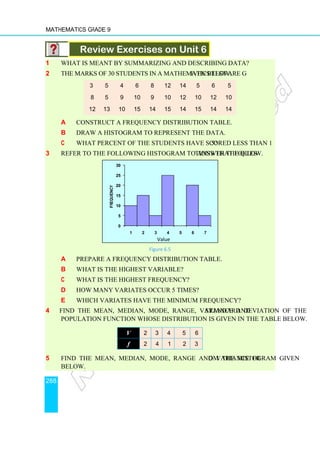
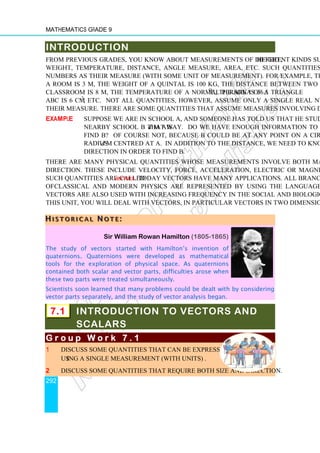
Example 15 Sketch the graph of f (x) = x2
+ 6x – 5 and
determine the minimum value of f (x).
Solution: f (x) = x2
+ 6x + 9 – 9 – 5 = (x + 3)2
– 14.
Hence the graph can be sketched by shifting the
graph of f (x) = x2
by 3 units to the left side and
then downward by 14 units.
Hence, the minimum value of f is –14.
In this case, the range of the function is
{y: y ≥ –14} = [–14, ∞).
Example 16 Find the maximum value of the function
f (x) = –x2
+ 6x – 8, and sketch its graph.
Solution: f (x) = –x2
+ 6x – 9 + 9 – 8
= –( x2
– 6x + 9) + 1;
f (x) = –(x – 3)2
+ 1.
The graph of f (x) = –(x – 3)2
+1 has vertex (3, 1)
and hence the maximum value of f is 1.
In this case, the range of the function is
{y: y ≤ 1} = (–∞, 1]
Figure 4.29
2 4 6 8
2
4
6
8
−2
−4
−6
−8
−2
−4
−6
−8
−10
−10
x
y
10
12
−12
−14
f (x) = (x + 3)2
– 14
f (x) = x2
f (x) = (x + 3)2
Figure 4.30
2 4 6 8
2
4
−2
−2
−4
−6
−8
−10
x
y
f (x) = −(x − 3)2
+ 1](https://image.slidesharecdn.com/mathematicsstudentg92-230929112719-9cd102fc/85/Mathematics-Student-G9_2-pdf-174-320.jpg)
![Mathematics Grade 9
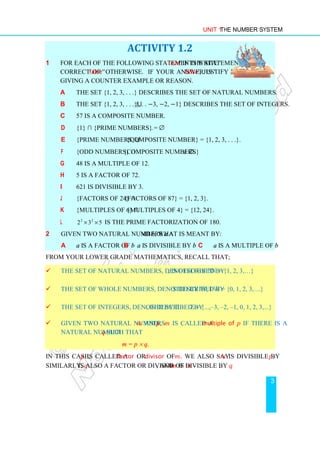
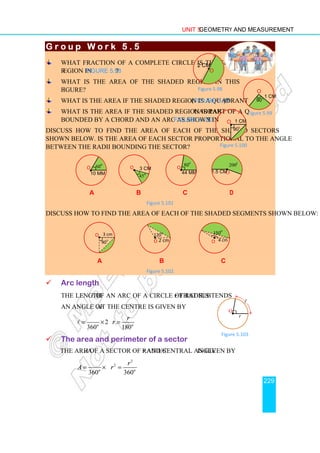
242
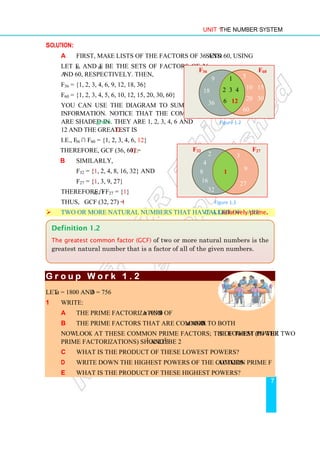
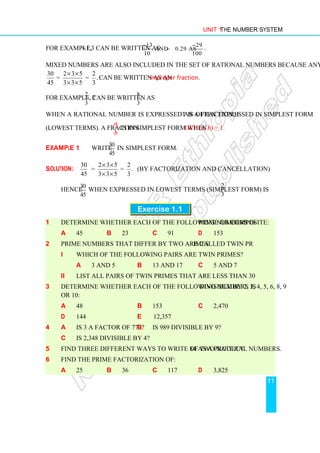
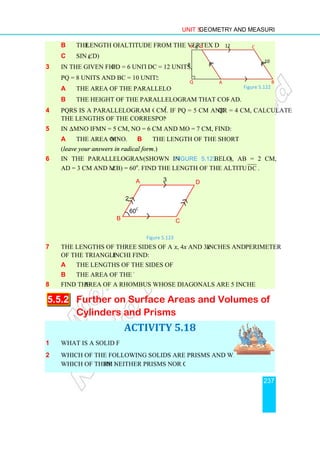
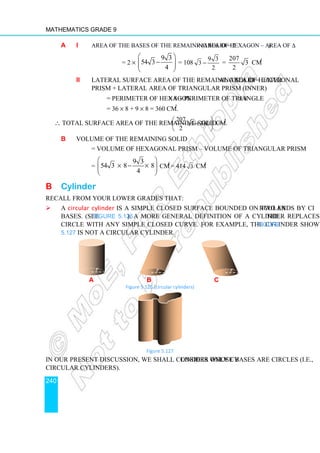
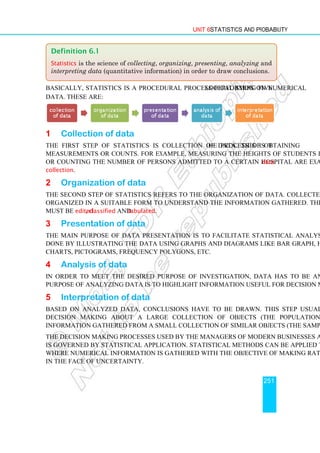
Solution: Let R be the radius of the bigger cylinder and r be the radius of the
smaller cylinder then
i Area of the resulting base = 2 (πR2
– πr2
)
= 2 (π × 32
– π × 22
) unit2
= 10π unit2
ii Lateral surface area of the resulting figure
= lateral surface area of the bigger cylinder
+ lateral surface area of inner (smaller) cylinder
= (2πRh + 2πrh) unit2
= [ 2π (3) 4 + 2π (2) 4] unit2
= 40 π unit2
Therefore, total surface area of the resulting figure = (10π + 40π) = 50π unit2
.
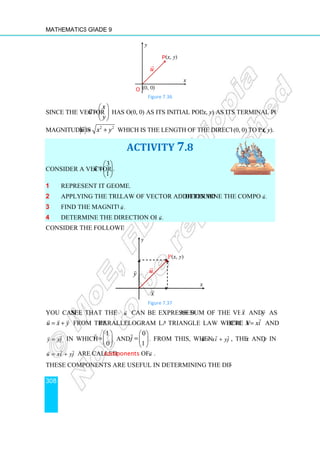
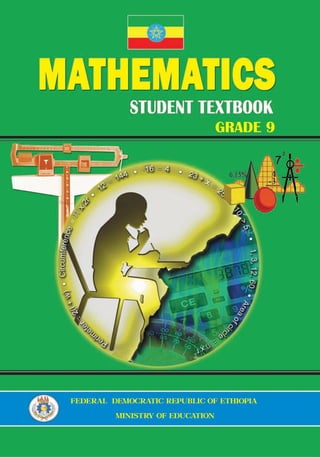
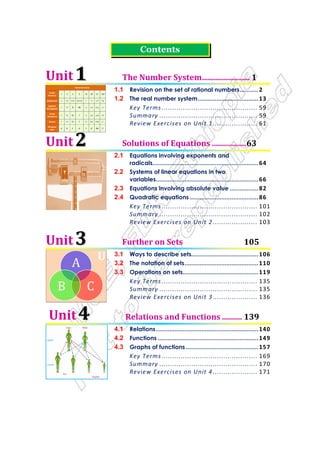
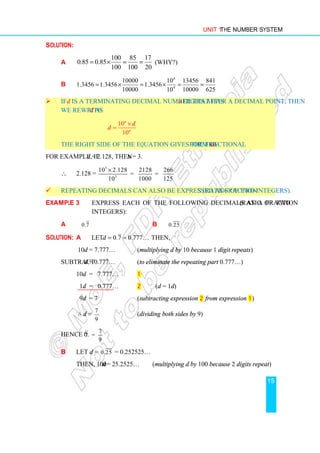
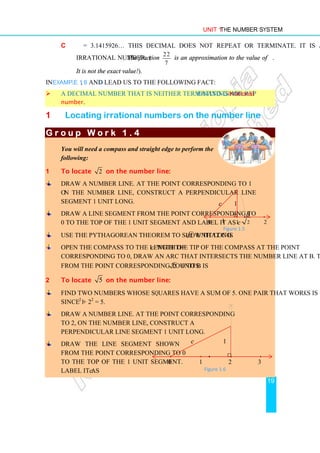
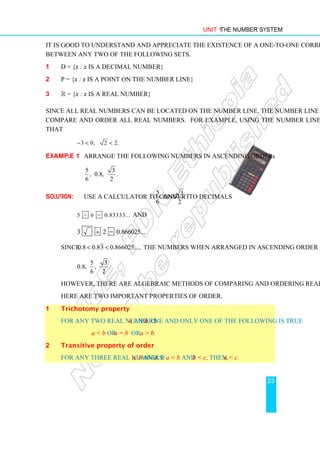
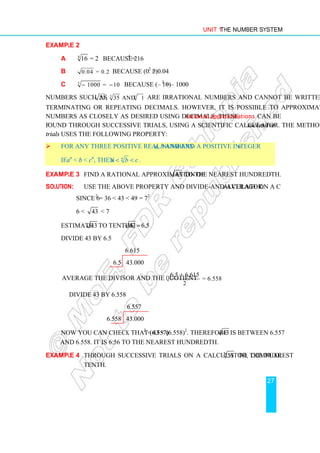
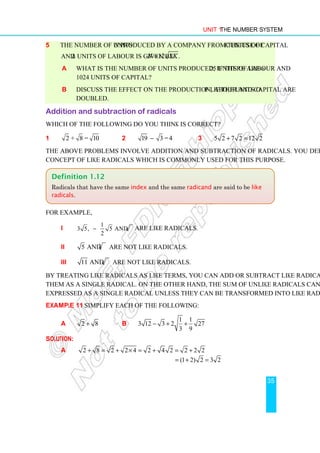
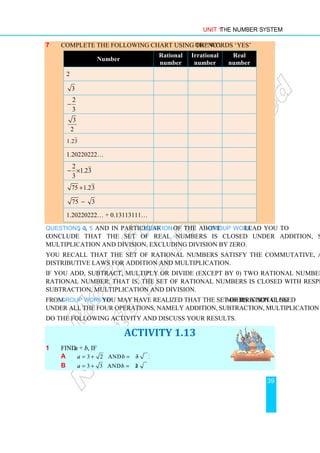
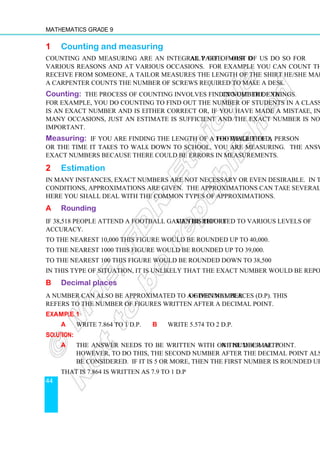
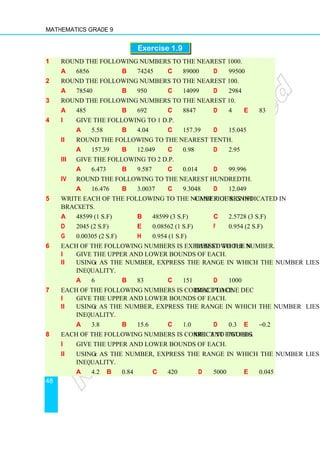
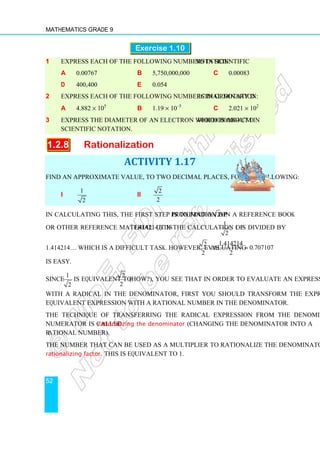
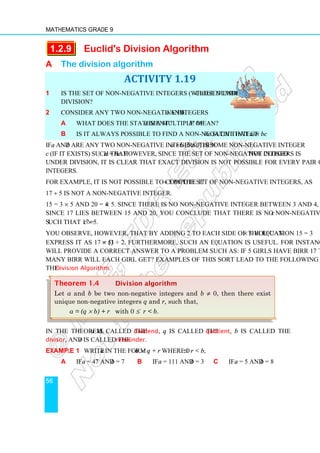
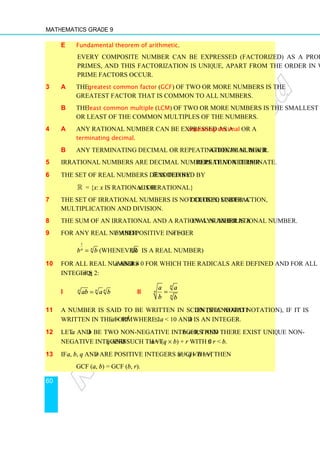
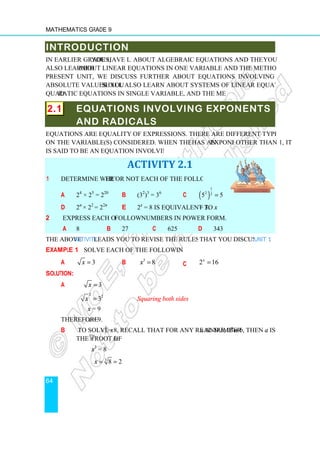
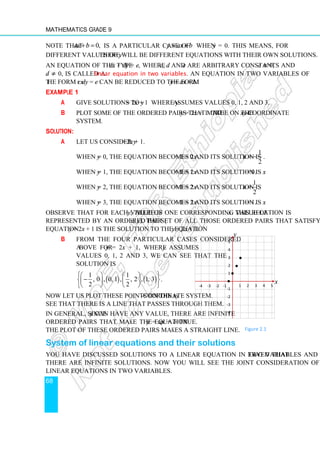
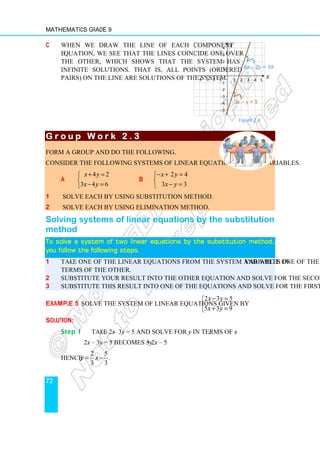
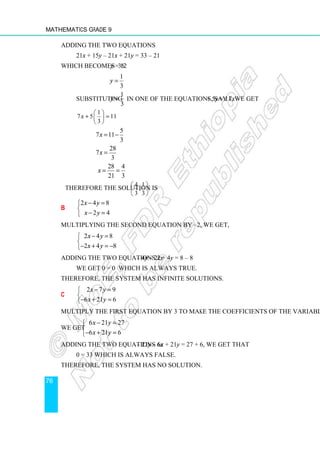
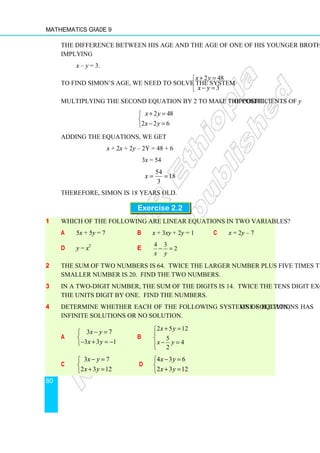
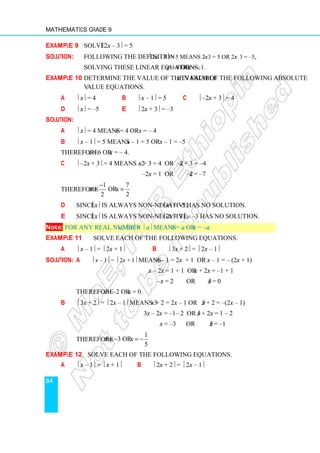
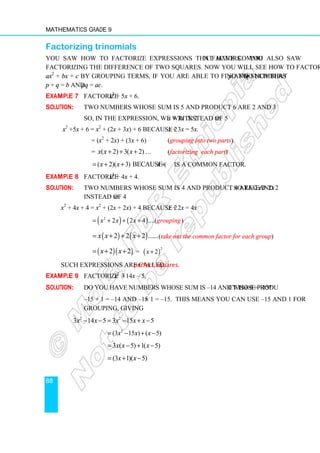
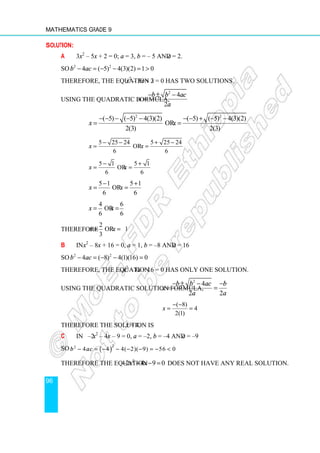
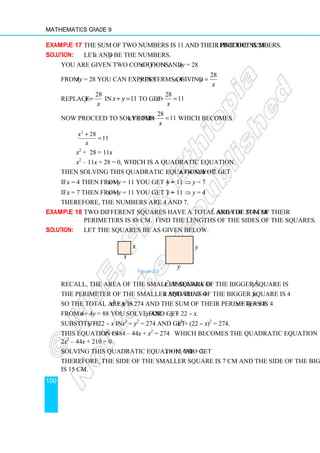
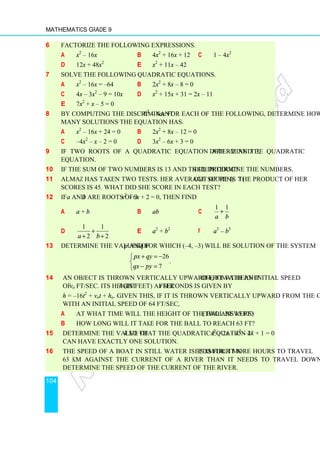
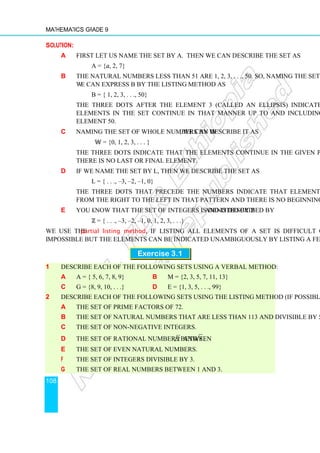
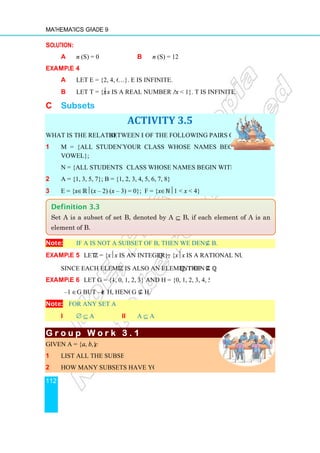
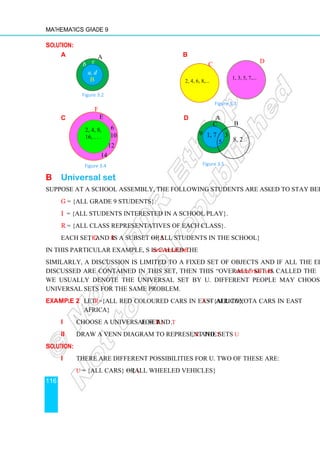
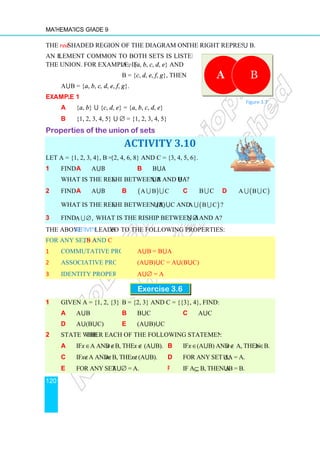
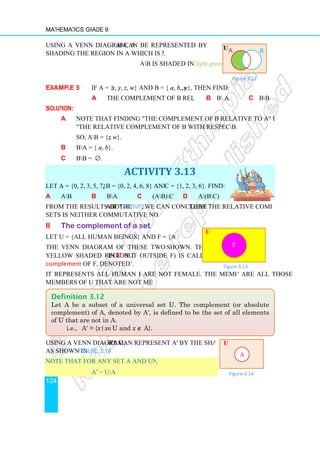
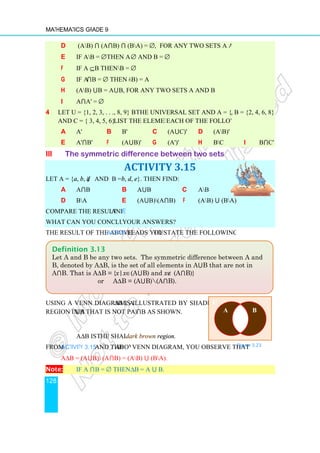
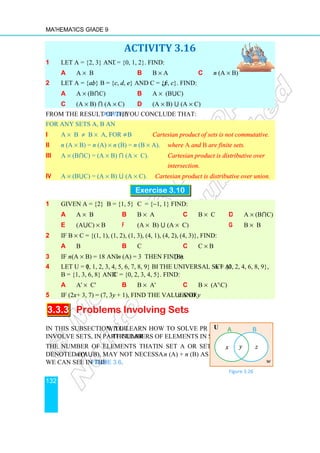
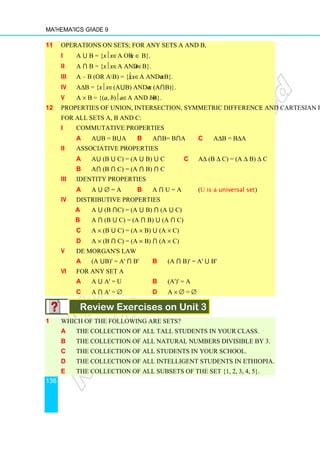
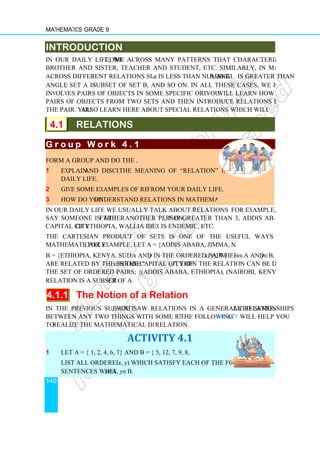
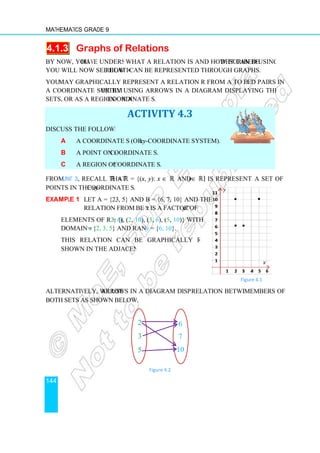
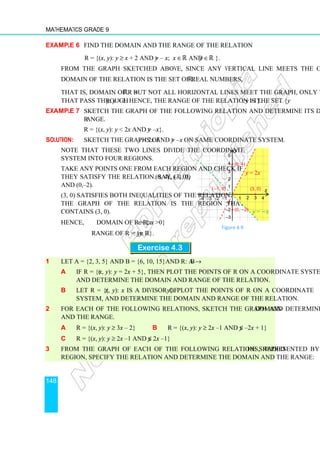
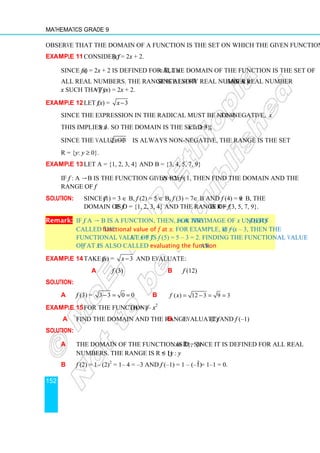
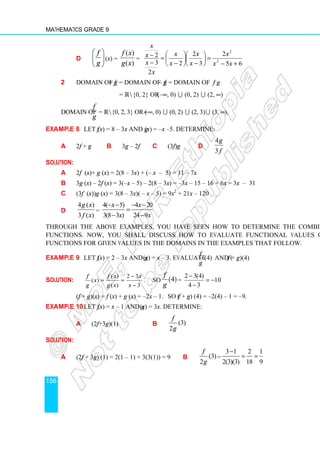
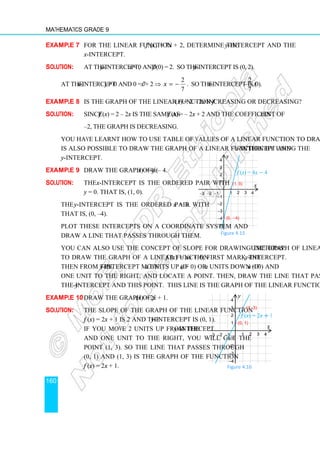
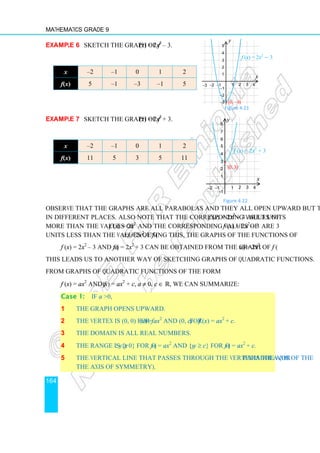
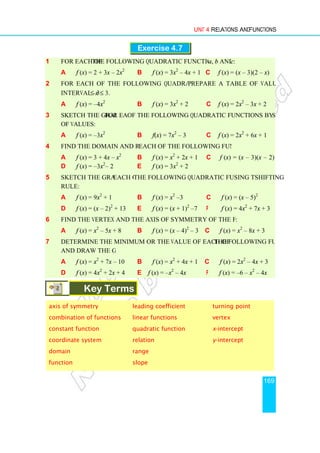
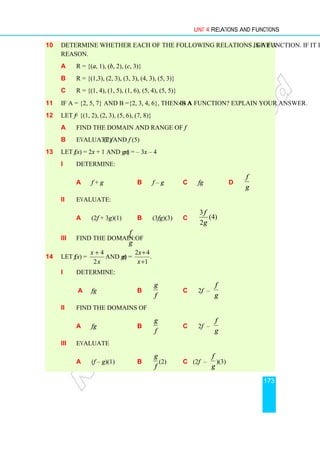
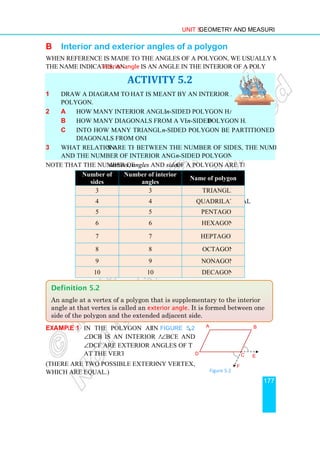
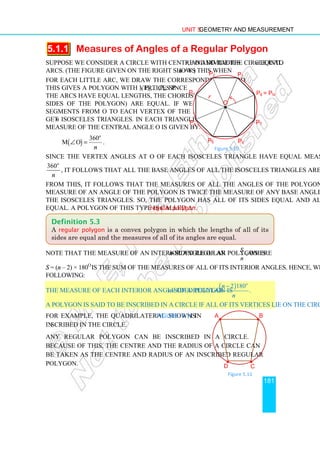
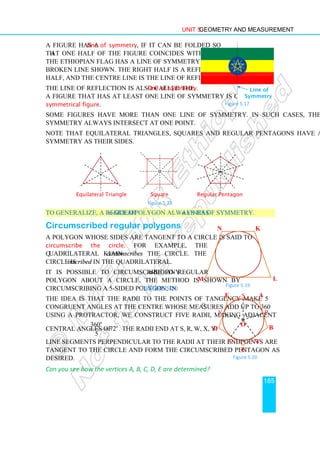
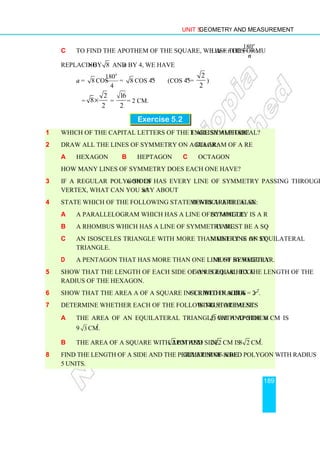
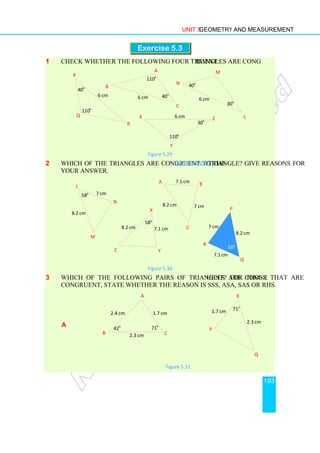
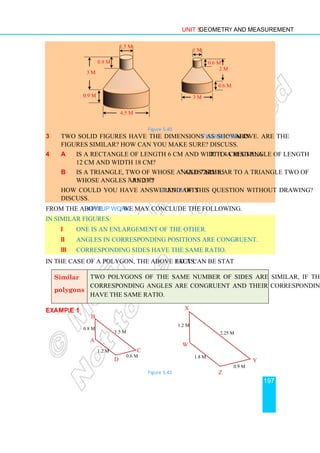
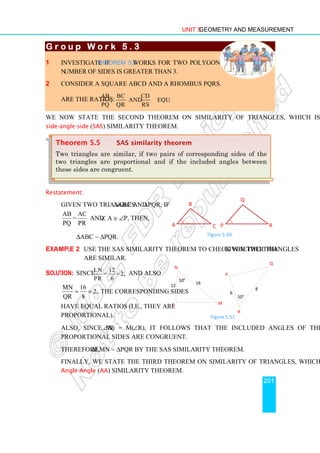
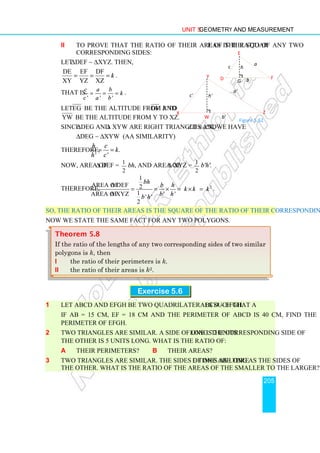
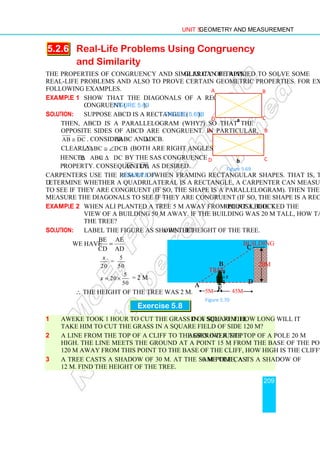
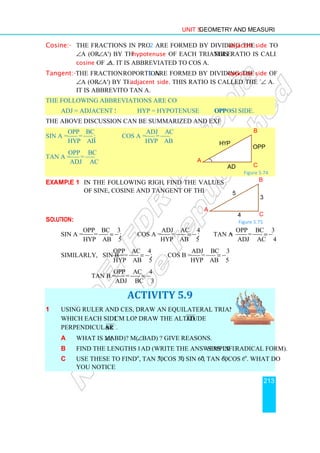
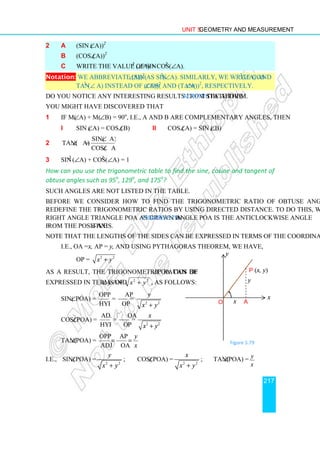
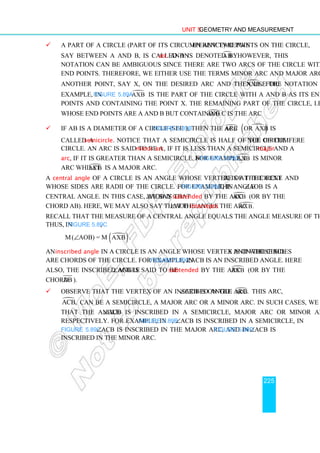
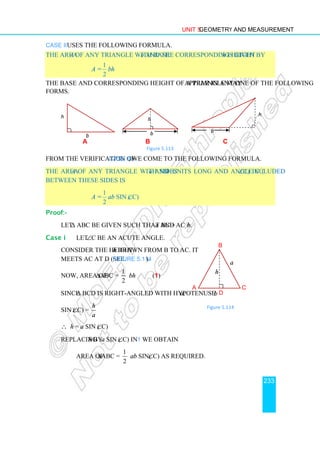
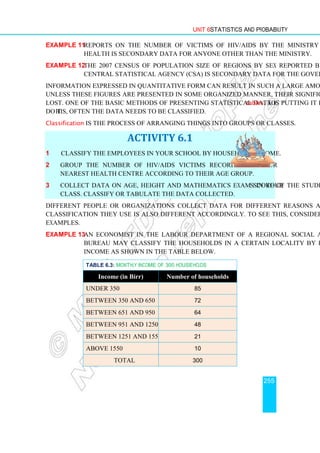
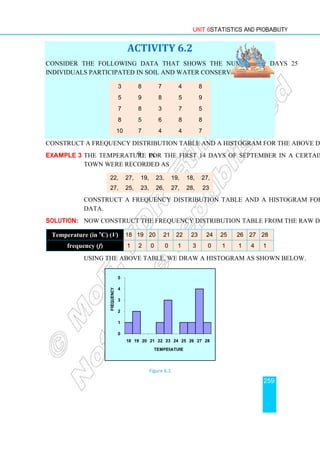
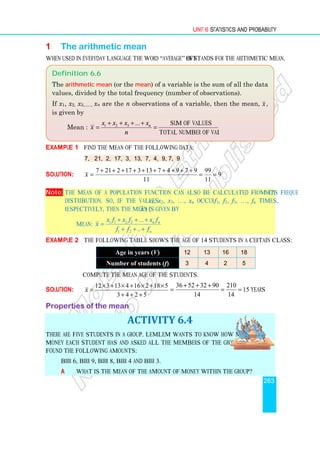
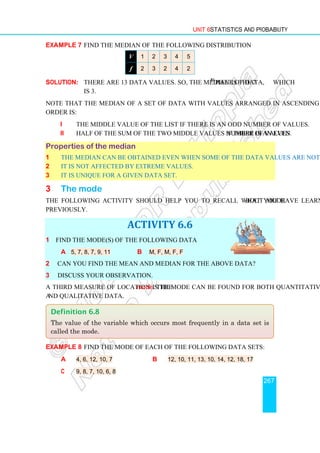
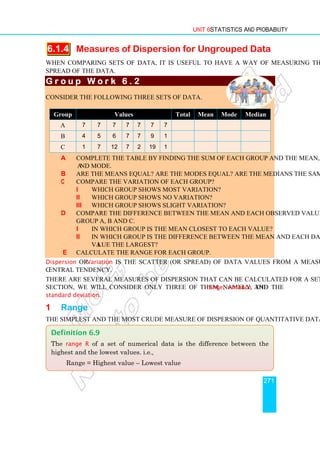
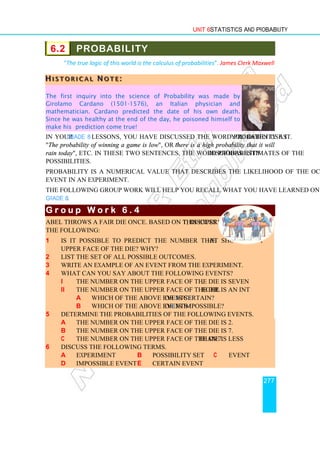
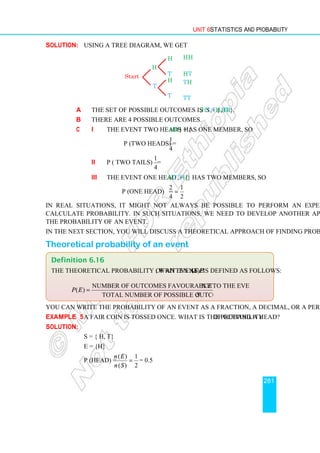
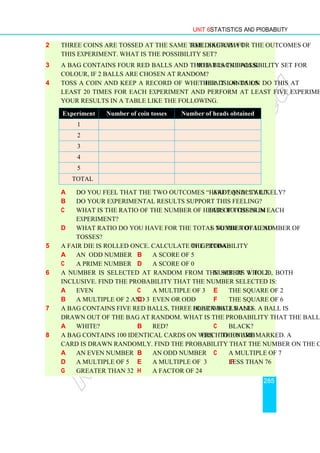
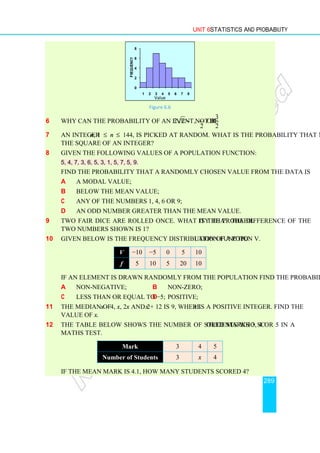
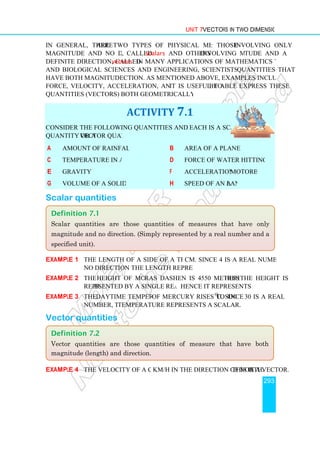
Exercise 5.14
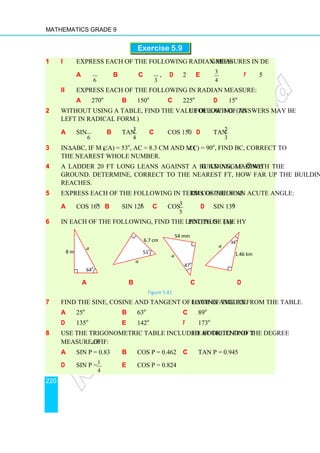
1 Using the measurements indicated in each of the following figures, find:
a the total surface area of each figure. b the volume of each figure.
i ii
iii iv
Figure 5.130
2 The base of a right prism is an isosceles triangle with equal sides 5 inches each,
and third side 4 inches. The altitude of the prism is 6 inches. Find:
a the total surface area of the prism. b the volume of the prism.
3 Find the lateral surface area and total surface area of a right circular cylinder in
which:
a r = 4 ft, h = 12 ft b r = 6.5 cm, h = 10 cm
8
4
3
4
9
5
i ii
13 4
15
6
4
7](https://image.slidesharecdn.com/mathematicsstudentg92-230929112719-9cd102fc/85/Mathematics-Student-G9_2-pdf-248-320.jpg)

![Unit 6 Statistics and Probability
275
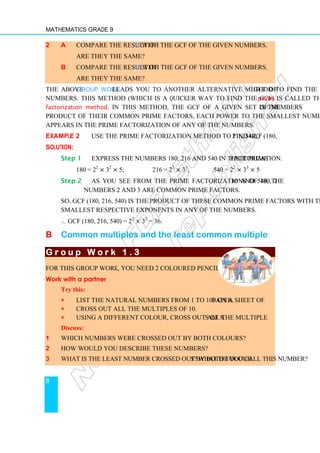
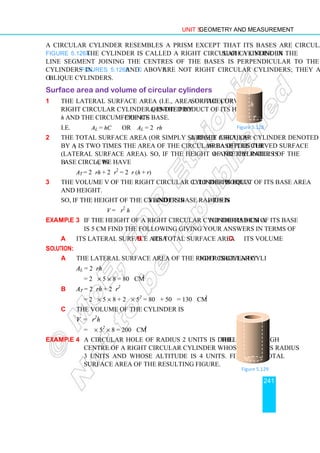
1 If a constant c is added to each value of a population function, then the new
variance is the same as the old variance. The new standard deviation is also the
same as the old standard deviation.
Proof:-
Let x1, x2, x3,..., xn be n observations with mean x and variance σ2
.
Adding c: 1 2 3
, , , . . ., .
n
x c x c x c x c
+ + + + Then the new mean is x c
+ .
New variance =
] [ ] [ ]
2
2 2
1 2
( ) ( ) ( ) ( ) ... ( ) ( )
n
x c x c x c x c x c x c
n
+ − + + + − + + + + − +
2 2 2
1 2
( ) ( ) . . . ( )
n
x x x x x x
n
− + − + + −
= = σ2
. (The original variance)
and the new standard deviation is variance =
2
σ = σ( the original standard
deviation)
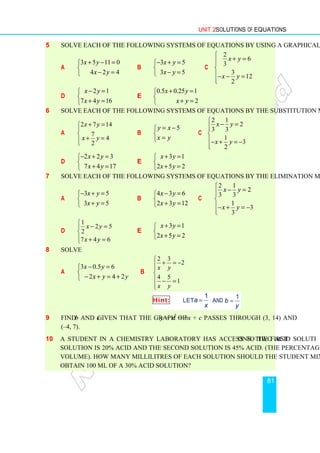
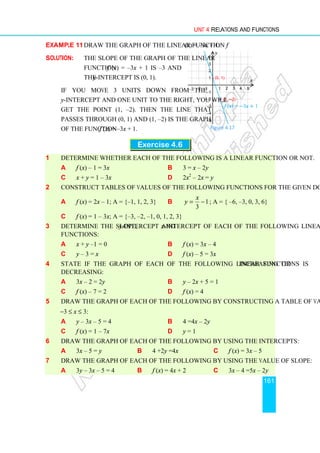
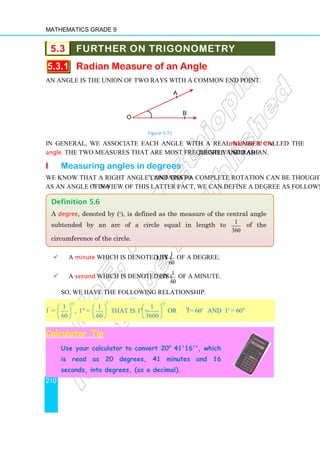
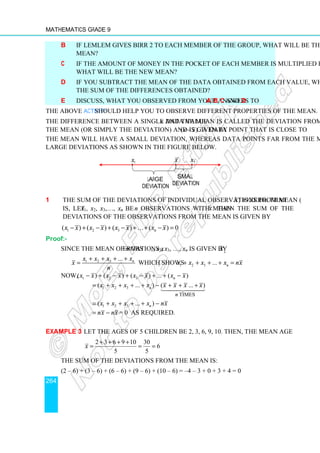
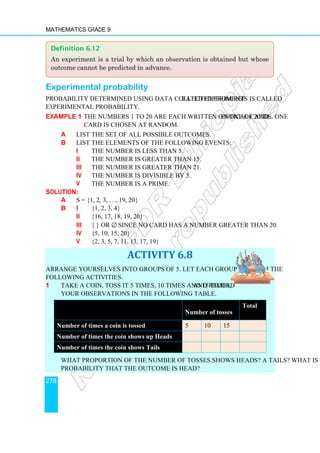
Example 5 Given 1, 2, 6, 3
a Find the variance b Find the standard deviation.
c Add 2 to each value and find the variance and standard deviation of the
resulting numbers
Solution:
1 2 6 3
3
4
x
+ + +
= =
2
: 2, 1 ,3, 0 and ( ) : 4, 1, 9, 0
x x x x
− − − −
a 2 4 + 1 + 9 + 0 14
= = = 3.5
4 4
σ
b σ = 3.5 1.87
≈
c Adding 2: 3, 4, 8, 5
New mean:
3 4 8 5 20
5 3 2
4 4
x
+ + +
= = = = +
2
: 2, 1 ,3, 0 and ( ) : 4, 1, 9, 0
x x x x
− − − −
New:
4 +1+9 + 0 14
= = 3.5
4 4
σ =
2
New = 3.5 1.87
σ ≈
Therefore, the old variance = the new variance
The old standard deviation = the new standard deviation.
2 If each value of a population function is multiplied by a constant c, then
i The new variance is c2
times the old variance
ii The new standard deviation is |c| times the old standard deviation.](https://image.slidesharecdn.com/mathematicsstudentg92-230929112719-9cd102fc/85/Mathematics-Student-G9_2-pdf-281-320.jpg)
![Mathematics Grade 9
276
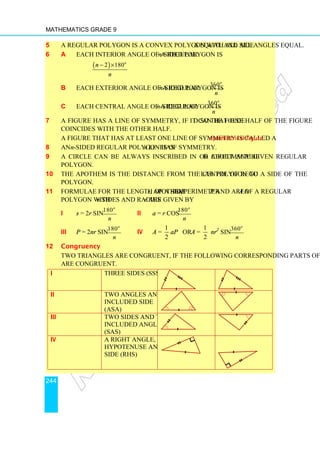
Proof:-
Consider x1, x2, . . ., xn whose mean is x and variance is σ2
.
Multiplying each data value by c gives us a new mean of c x .
Then, new variance =
2 2 2 2
1 2 3
( c ) ( ) ( ) . . . ( )
n
cx x cx cx cx cx cx cx
n
− + − + − + + −
2 2 2 2 2
1 2 3
[( ) ( ) ( ) . . . ( ) ]
n
c x x x x x x x x
n
− + − + − + + −
=
= c2
× the old variance = c2
σ2
Therefore, new standard deviation = 2 2
c c
σ σ
=
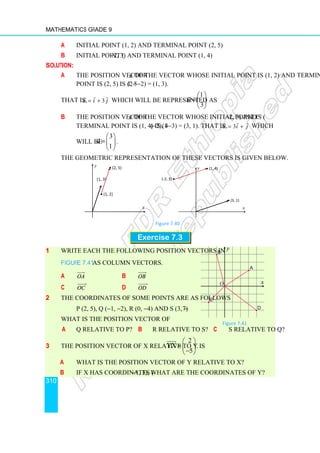
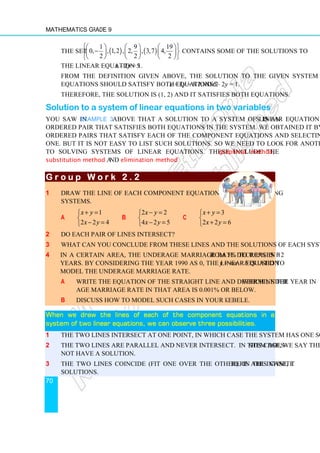
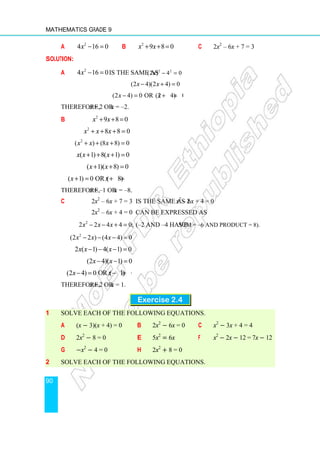
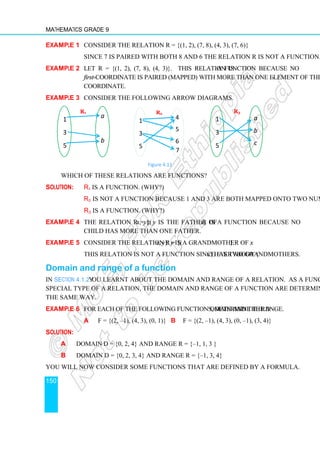
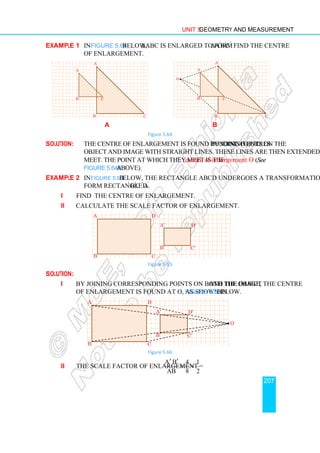
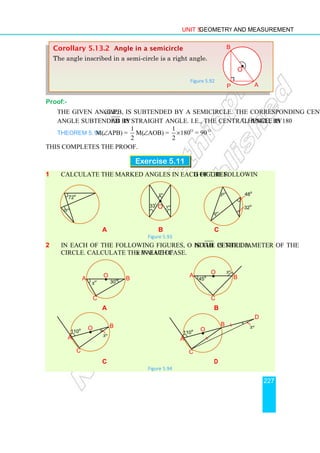
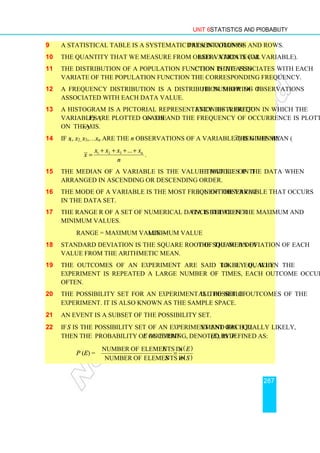
Exercise 6.4
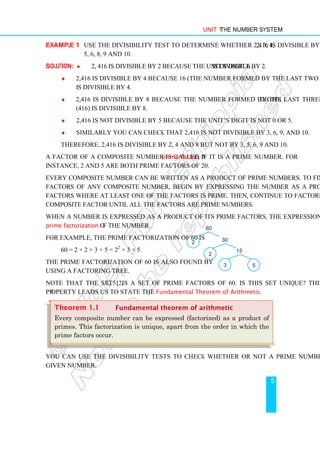
1 Find the range, variance and standard deviation of the following data.
4, 2, 3, 3, 2, 1, 4,3, 2, 6
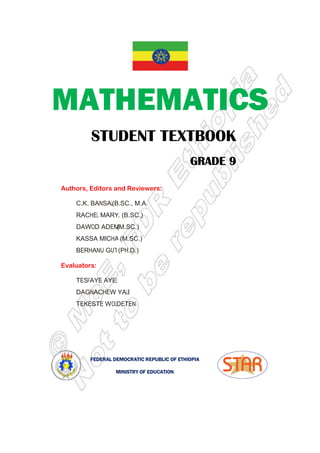
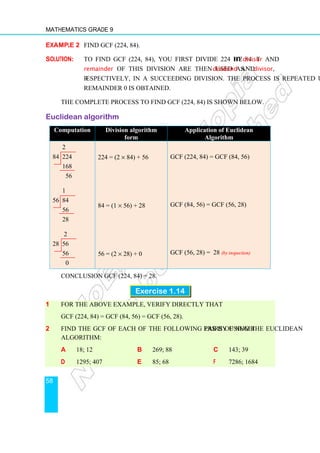
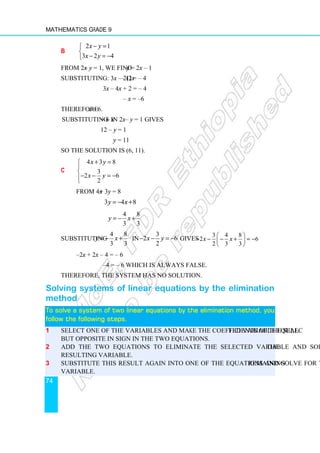
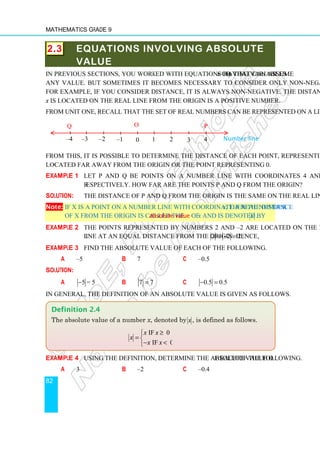
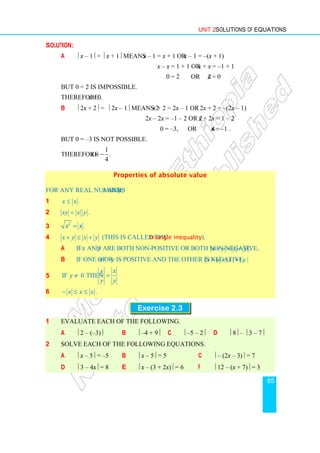
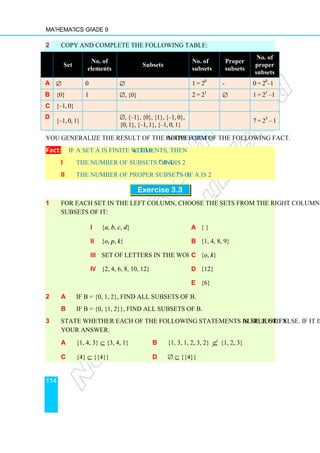
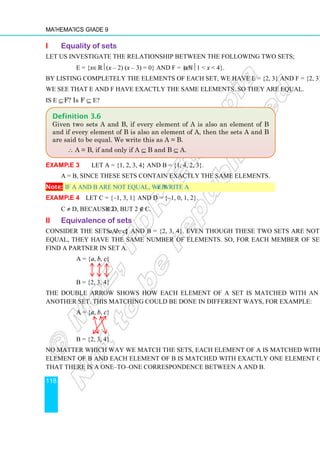
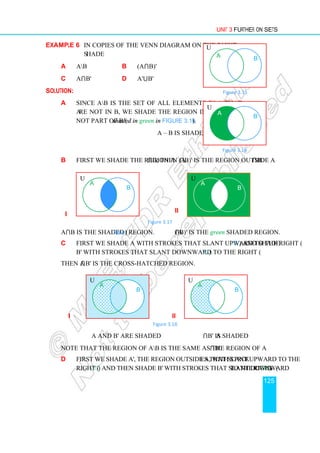
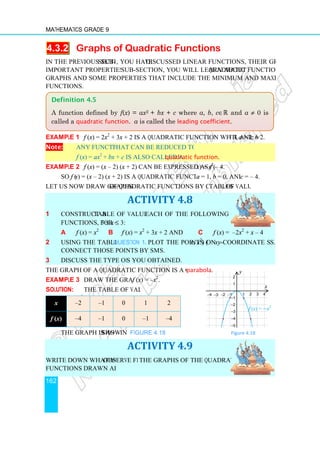
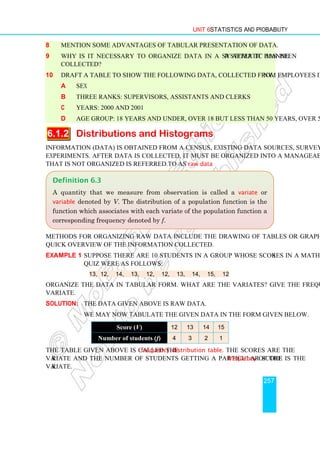
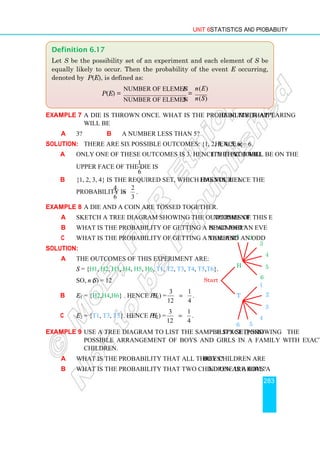
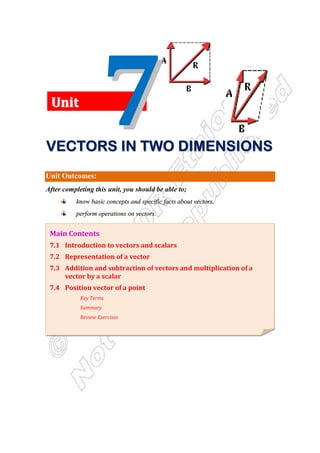
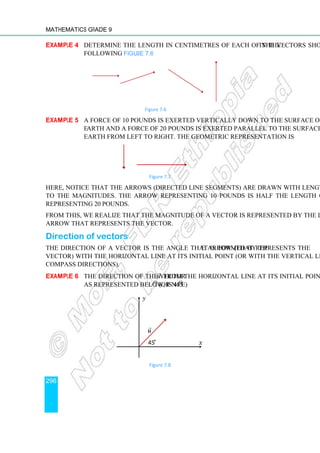
2 Find the range, variance and standard deviation of the distribution in the table below.
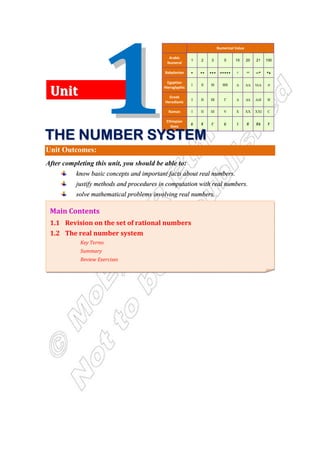
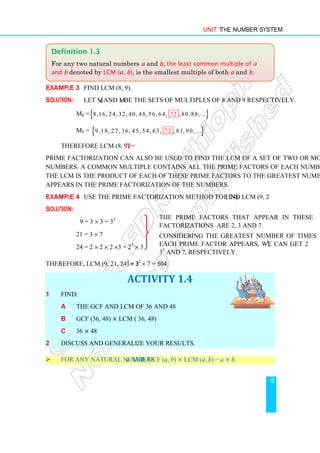
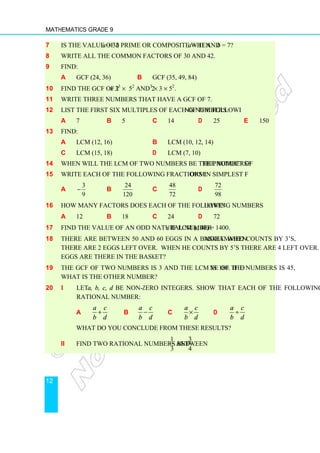
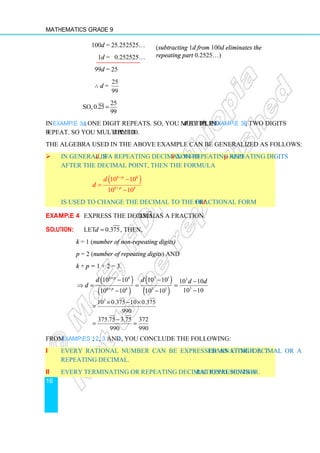
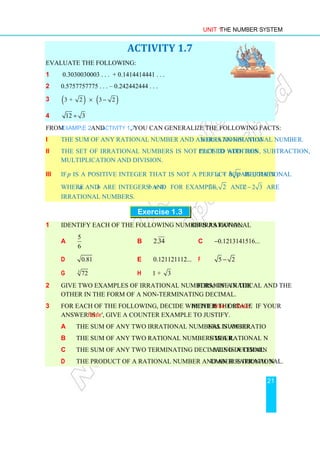
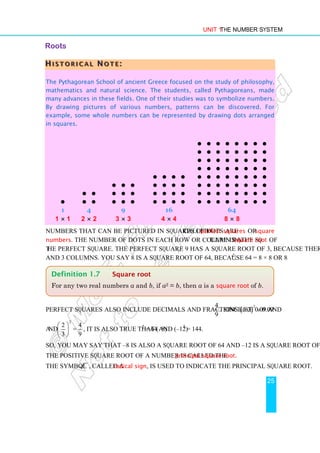
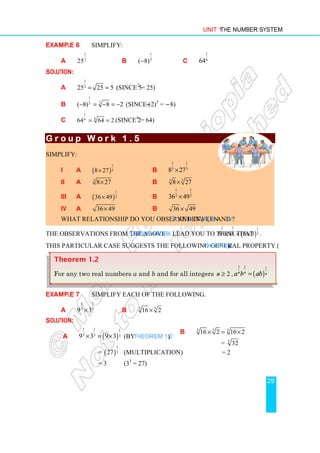
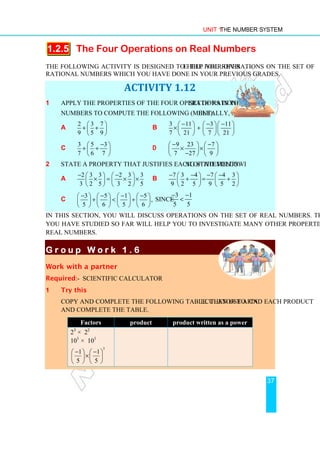
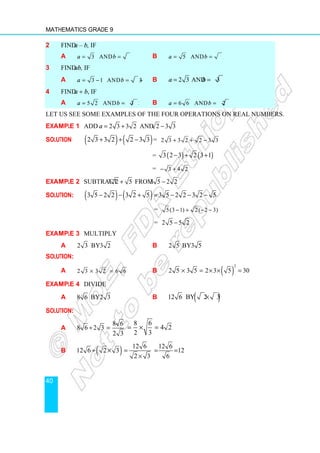
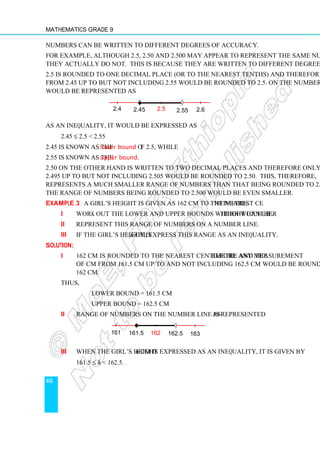
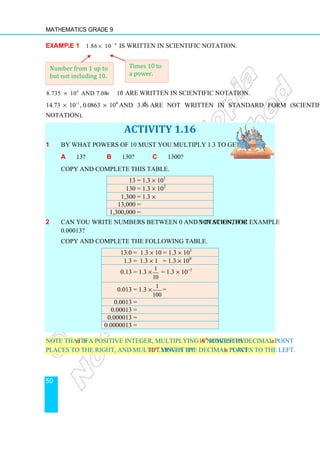
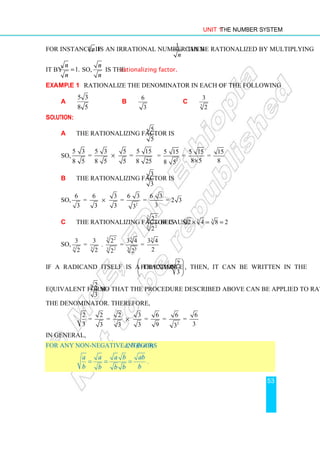
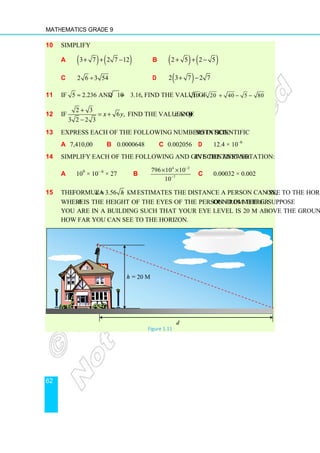
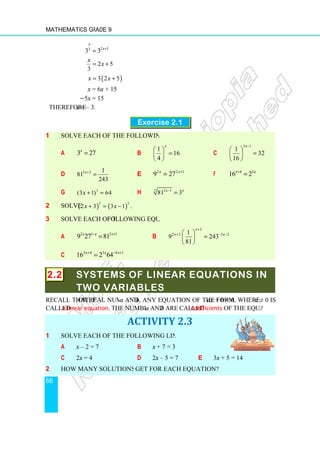
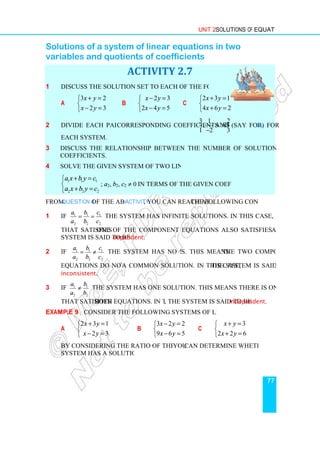
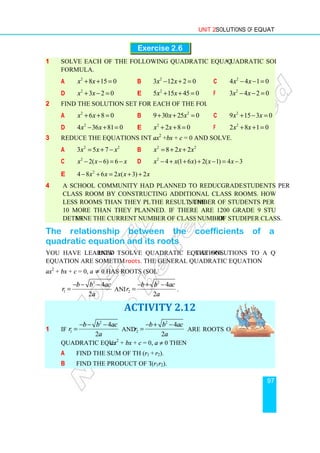
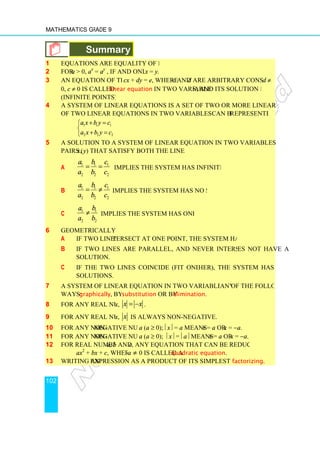
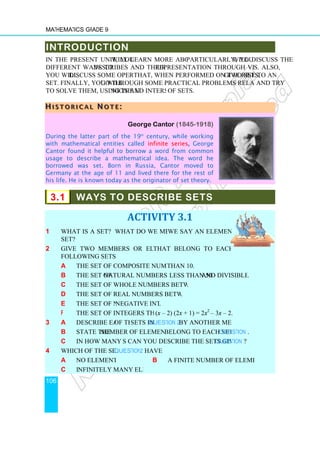
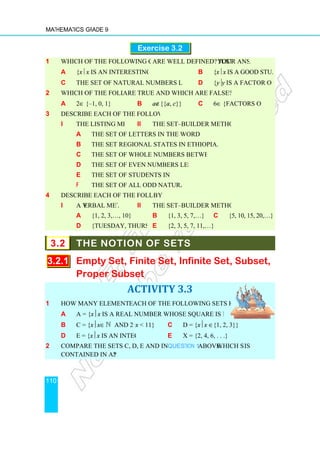
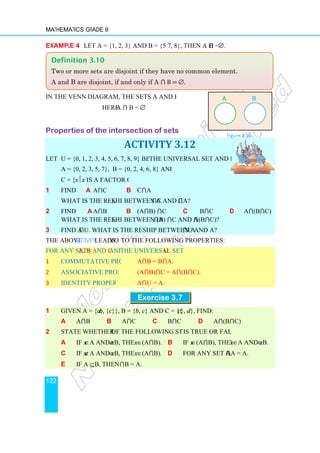
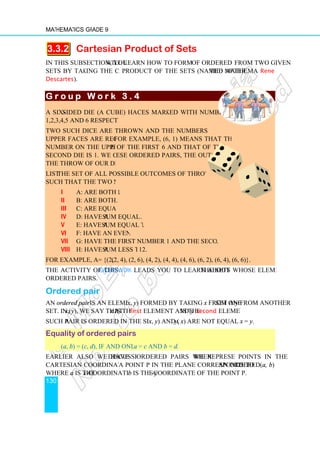
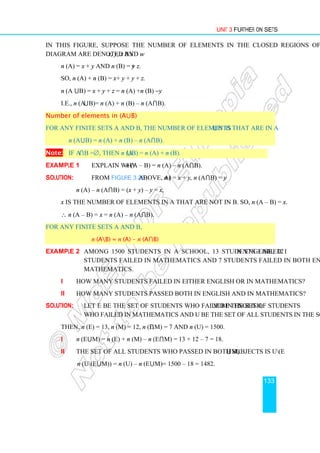
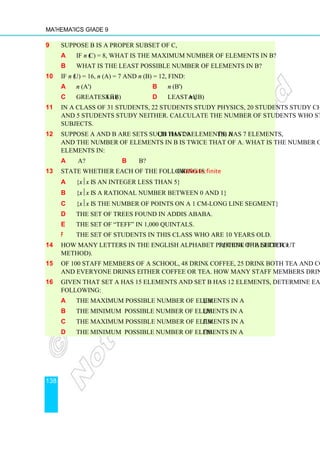
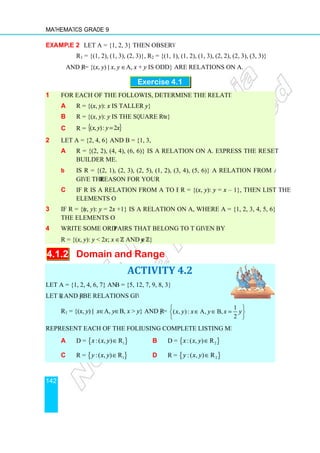
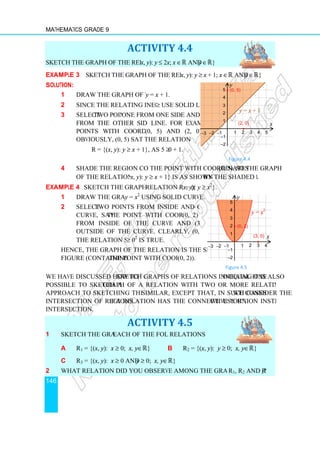
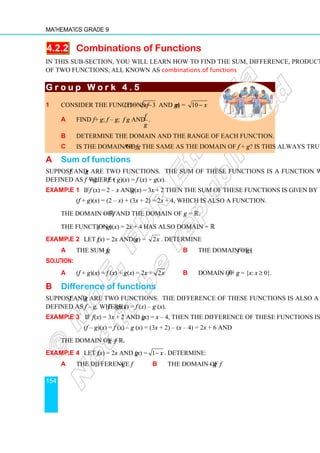
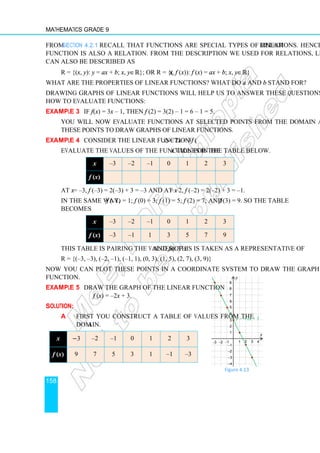
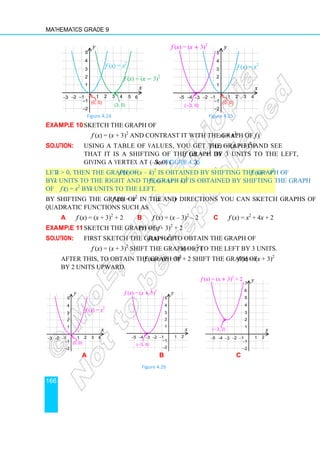
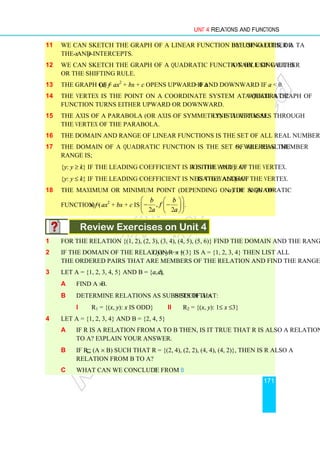
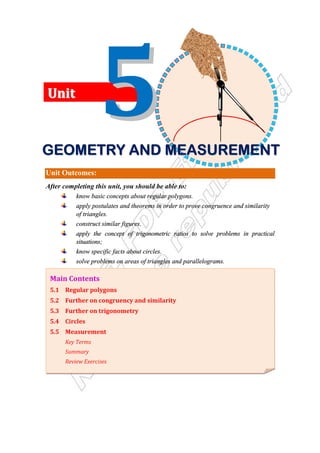
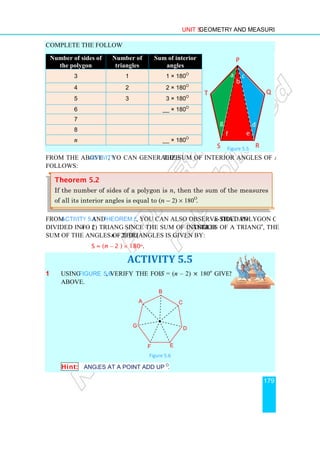
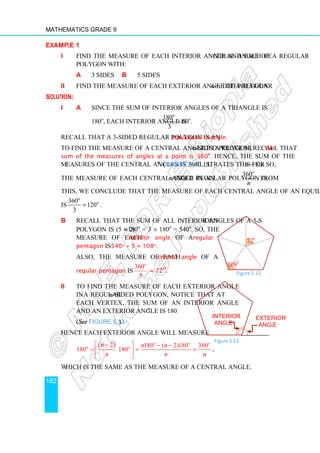
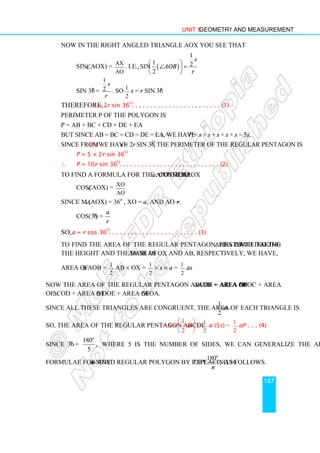
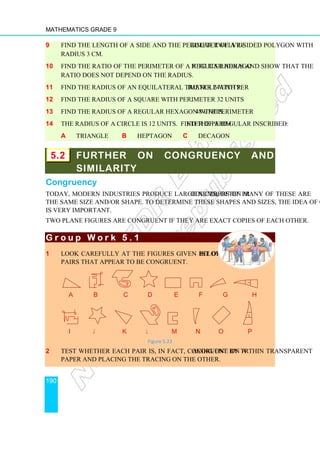
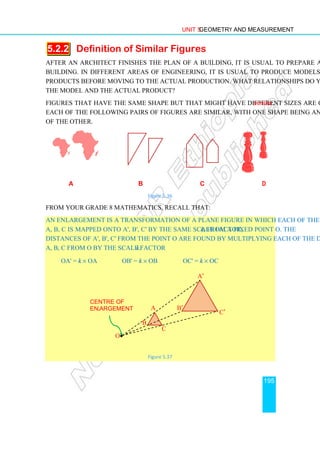
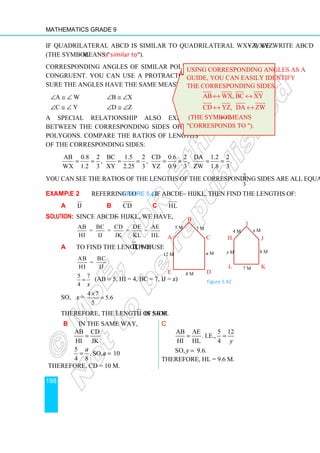
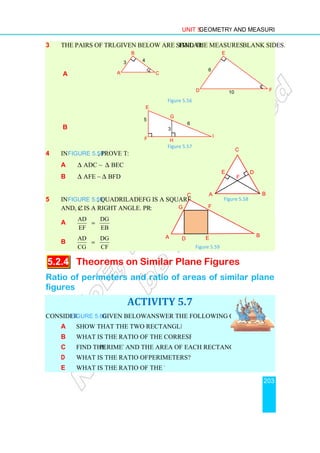
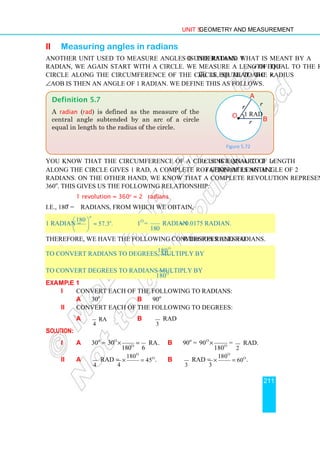
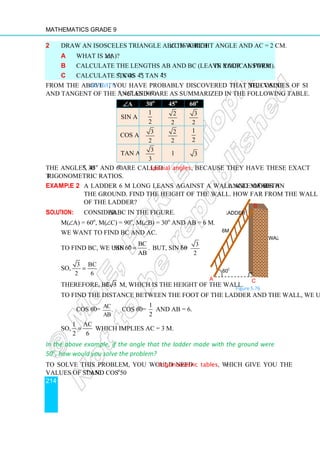
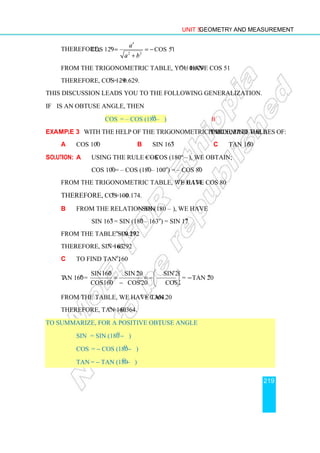
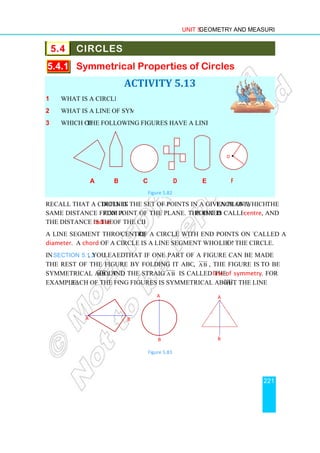
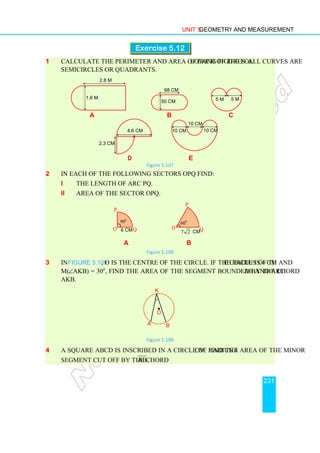
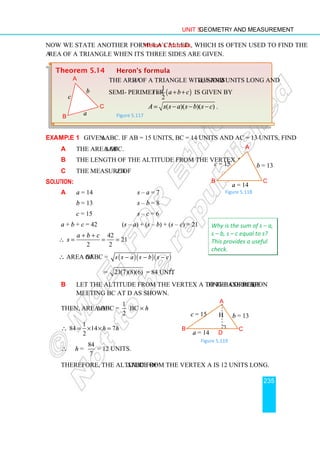
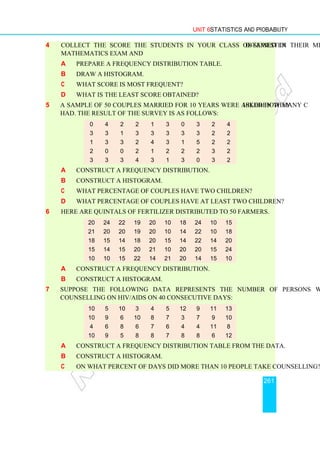
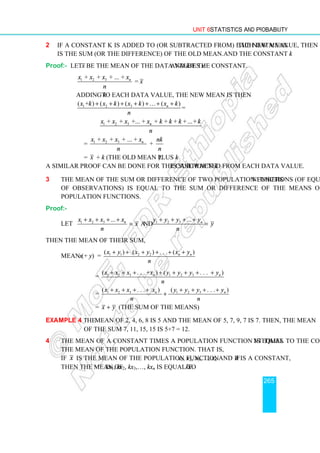
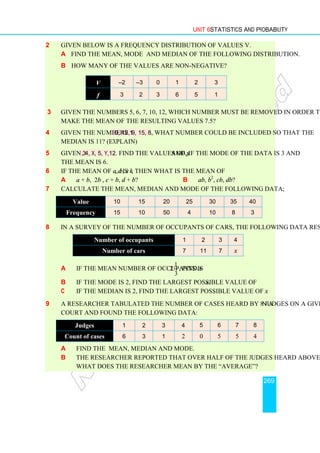
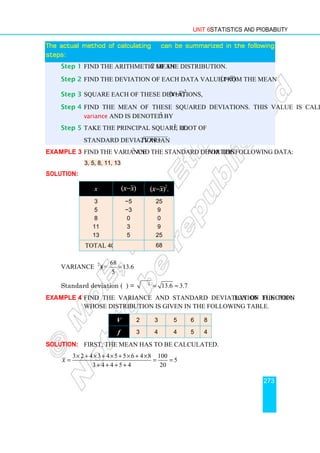
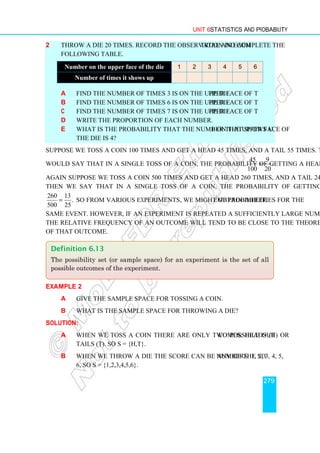
3 Find the range, variance and standard deviation from the histogram in the figure
below.
0
1
2
3
4
5
1 2 3 4
Frequency
Value
Figure 6.4
4 What is the value of y, if the standard deviation of 8, 8, 8, 8, y, 8 is 0?
5 If the variance of a, b, c, d is k, then what is
a the variance of a + c, b + c, 2c, d + c?
b the standard deviation of a + c, b + c, 2c, d + c?
c the variance of ac, bc, c2
, dc?
d the standard deviation of ac, bc, c2
, dc?
6 If a population function x has mean M(x) = 2 and M(x2
) = 8, find its standard
deviation.
V –1 –2 0 1 2
f 2 1 3 3 1](https://image.slidesharecdn.com/mathematicsstudentg92-230929112719-9cd102fc/85/Mathematics-Student-G9_2-pdf-282-320.jpg)
![Mathematics Grade 9
294
Example 5 Suppose Helen moves
North [N] to reach at B.
Solution: Taken together, the distance and direction of the line from A to B is
called the displacement
Figure 7.1.
The arrow-head tells us that we are talking
B. This is an example of a vector.
7.2 REPRESENTATION OF A VECTOR
1 Discuss algebraic and geometric representation
2 Represent the vector
and P = (2, 3) in the xy
3 Discuss the magnitude and direction of a vector.
4 Find the magnitude and the direction of the vector
5 When are two vectors equal?
A vector can be represented either algebraically
or geometrically. Often, the m
of representing vectors is geometrically, where a
vector is represented by an arrow or directed line
segment.
When a vector is represented by an arrow
initial point and P is called the
using letters or a letter with a bar over it such as
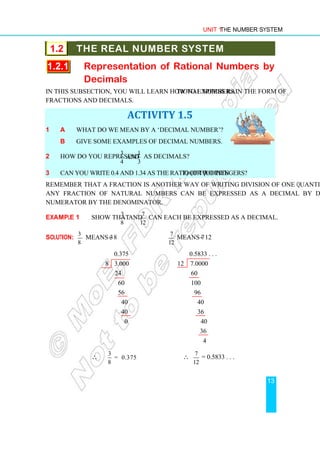
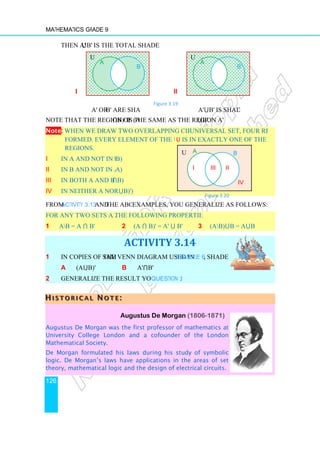
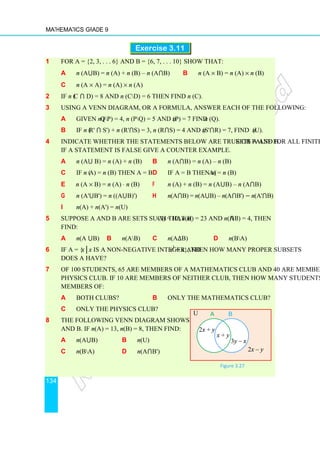
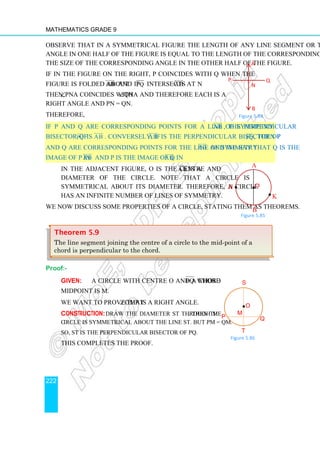
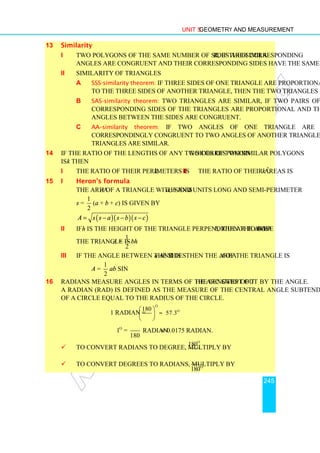
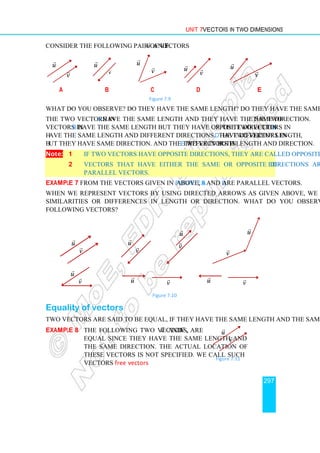
Suppose Helen moves, from A, 10 m to the East [E] and then 7
North [N] to reach at B. Show, as a vector, Helen’s final displacement
Figure 7.1
Taken together, the distance and direction of the line from A to B is
displacement from A to B, and is represented by the arrow in
head tells us that we are talking about the displacement of Helen from A to
B. This is an example of a vector.
REPRESENTATION OF A VECTOR
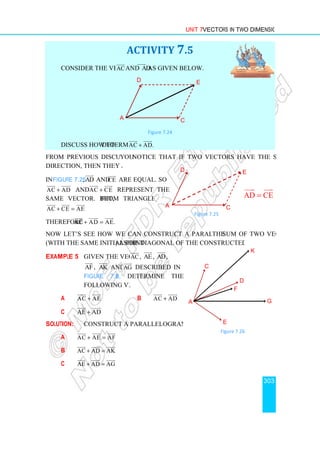
ACTIVITY 7.2
algebraic and geometric representations of vectors.
Represent the vector OP
geometrically, where O is the origin
xy-coordinate system.
magnitude and direction of a vector.
Find the magnitude and the direction of the vector OP
.
When are two vectors equal?
vector can be represented either algebraically
Often, the most convenient way
of representing vectors is geometrically, where a
vector is represented by an arrow or directed line
When a vector is represented by an arrow (see OP
above), the point O is called the
and P is called the terminal point. Sometimes, vectors are represented
using letters or a letter with a bar over it such as u
, v
, etc.
A
B
10 m
7 m
O
Figure 7.2
m to the East [E] and then 7 m to the
’s final displacement.
Taken together, the distance and direction of the line from A to B is
from A to B, and is represented by the arrow in
about the displacement of Helen from A to
REPRESENTATION OF A VECTOR
the point O is called the
. Sometimes, vectors are represented
P
Figure 7.2](https://image.slidesharecdn.com/mathematicsstudentg92-230929112719-9cd102fc/85/Mathematics-Student-G9_2-pdf-300-320.jpg)
![Unit 7 Vectors in Two Dimensions
295
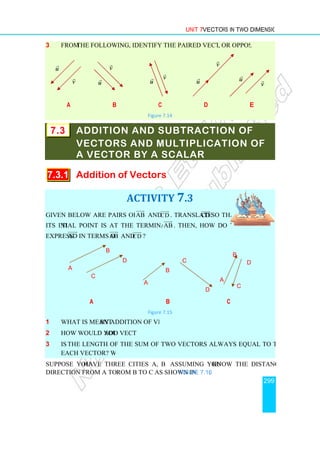
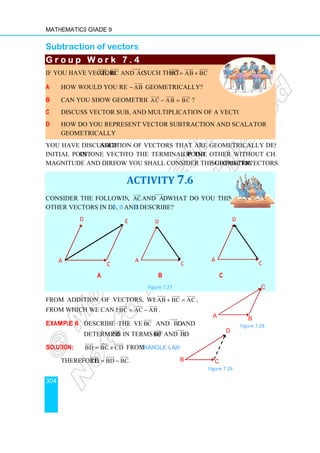
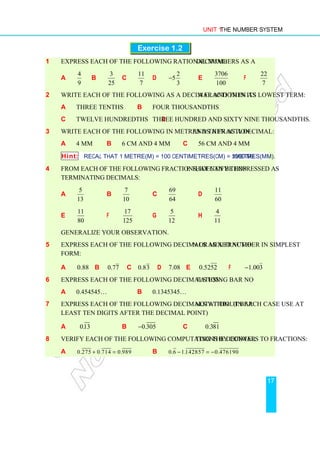
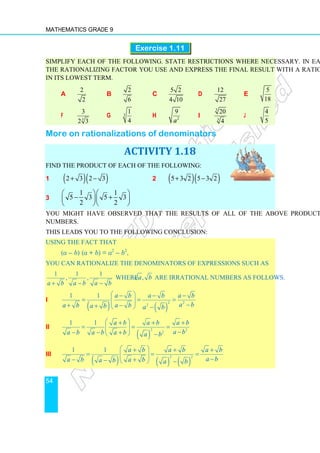
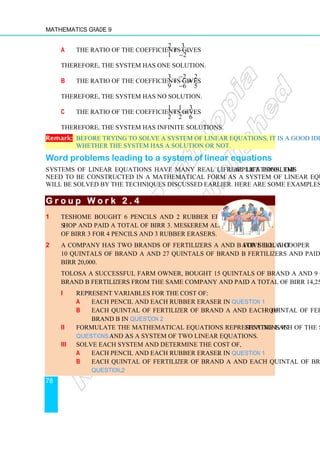
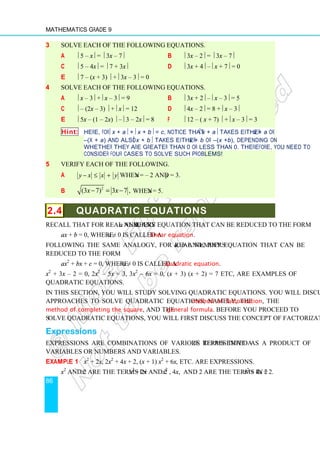
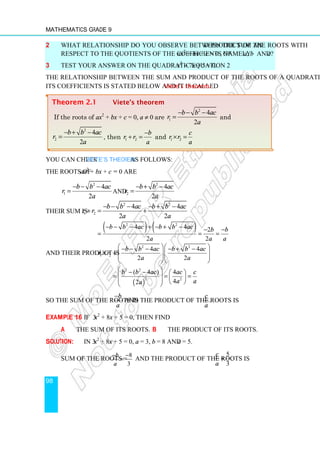
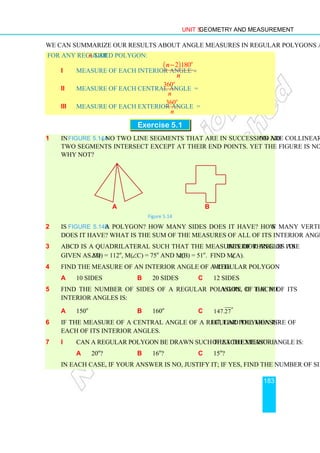
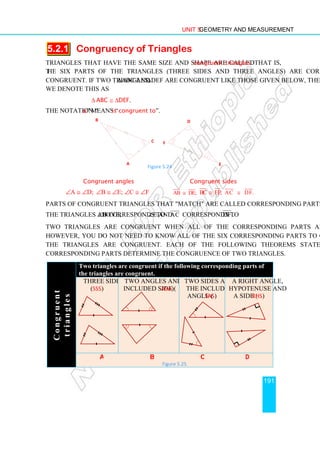
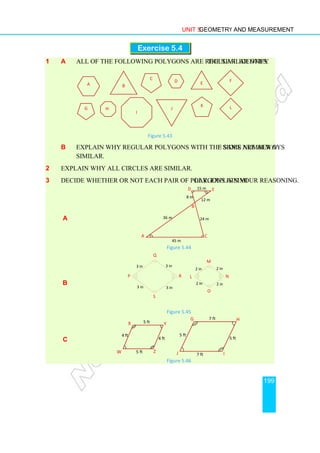
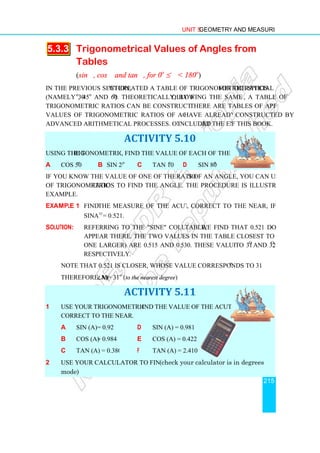
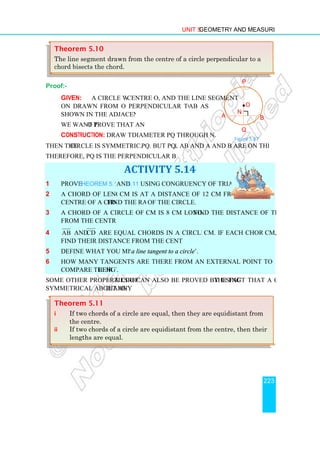
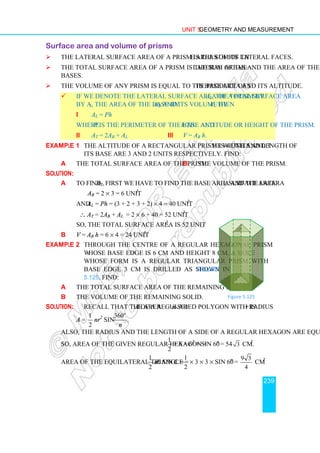
Example 1 What does the vector in the following figure represent?
Figure 7.3
Solution: The vector AB has a length of 7 m and direction of East 30o
North
[E30o
N] (or a direction of North 60o
East [N60o
E]. Its initial point is A
and its terminal point is B.
What do you think is the magnitude (length) of a vector and the direction of a vector?
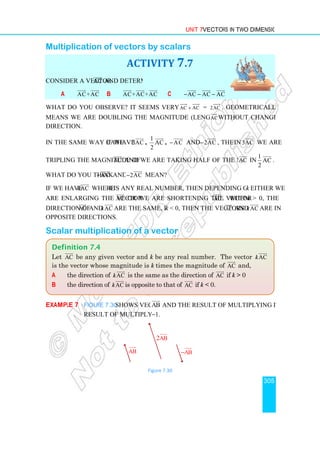
Example 2 The following are examples of vector representation. Can you determine
their lengths and directions?
Hint: Use ruler and protractor.
Figure 7.4
Magnitude (length) of vectors
The magnitude (length) of a vector OP
or simply u
is the length of the line segment
from the initial point O to the terminal point P, (the length of the directed line segment).
Notation: Magnitude of vector OP
is denoted as OP
.
Example 3 Determine the length of the vectorOP
.
Figure 7.5
Solution: The magnitude of the vector OP
is OP
= 5 (How?)
A
B
30o
7 m
A
B
60o
7 m
Figure 7.3
y
x
y
x
OR
O
P
(2, 3)
(1, 1)
y
x](https://image.slidesharecdn.com/mathematicsstudentg92-230929112719-9cd102fc/85/Mathematics-Student-G9_2-pdf-301-320.jpg)
![Mathematics Grade 9
298
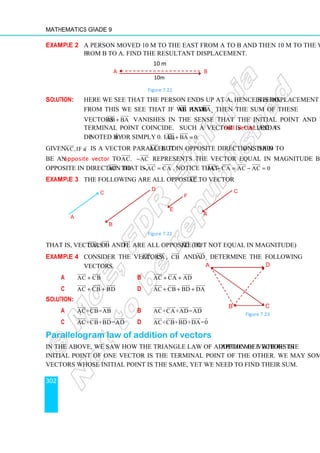
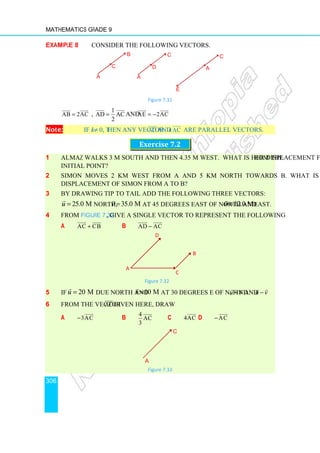
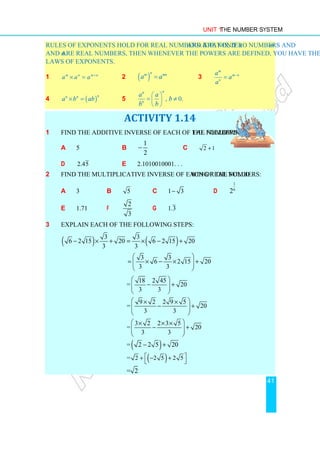
Example 9 In each of the diagrams below, all the vectors are equal.
a b
Figure 7.12
G r o u p W o r k 7 . 2
G r o u p W o r k 7 . 2
G r o u p W o r k 7 . 2
G r o u p W o r k 7 . 2
1 Suppose vectors u
and v
are equal,
a Can we conclude that they have the same initial point?
Why?
b Do they have the same length? Why?
c Do they have the same direction? Why?
2 Suppose vectors u
and v
are opposite,
a Can we conclude that they must start from the same initial point? Why?
b Do they have the same length? Why?
c Do they have the same direction? Why?
3 Summarize what you have concluded.
Exercise 7.1
1 Determine the magnitude and direction of each of the following vectors.
Figure 7.13
2 Locate each of the following vectors on a coordinate system.
a OP
whose length is 3 cm and direction is [N40o
E].
b AB
whose length is 5 cm and direction is [S45o
E].
c CD
whose initial point is (1, 2), length is 3 cm and direction is [N60o
W].
x
y
v
v
v
x
y
u
u
u
u](https://image.slidesharecdn.com/mathematicsstudentg92-230929112719-9cd102fc/85/Mathematics-Student-G9_2-pdf-304-320.jpg)