LESSON PLAN INMATH VI
I. Objectives
A. Content Standard: Demonstrates understanding of pie graphs and
experimental probability.
B. Performance Standard: Is able to create and interpret representations of data
(tables and pie graphs) and apply experimental probability in mathematical
problems and real-life situations.
C. Learning Competencies: Solves routine and non-routine problems using
data presented in a pie graph. M6SP-IVf-4.6
II. Learning Content
A. Skills:
a. Reading and interpreting data presented in a pie graph, and
b. Solving routine and non-routine problems using data presented in a pie graph.
Valuing: Waste Management and Energy Conservation
B. References:
SSES Curriculum (Math VI)- IV-1.1
Lesson Guides in Elementary Mathematics Grade 6. 2003. pp. 571-575, 583-
584.
DLP Grade 6 Module 64
Number Smart 6: Quest For Excellence. 2009. pp. 438-443
Math For Life: Worktext in Mathematics. 2015, pp. 340-347
C. Materials: Laptop, problem sets, cartolina/manila paper, marking pens, adhesive
tape
III. Learning Experiences
A. Preparatory Activities
1. Drill:
Five students will be selected through draw lots and will have a
chance to mend one broken heart.
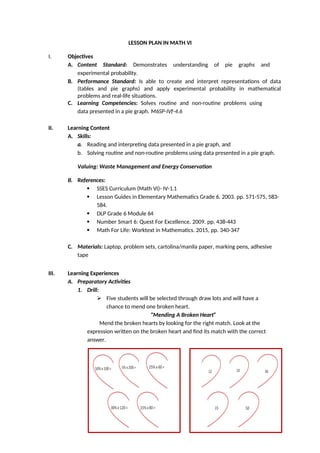
“Mending A Broken Heart”
Mend the broken hearts by looking for the right match. Look at the
expression written on the broken heart and find its match with the correct
answer.
2.
2. Review:
Eachgroup will be given a set of materials for this activity.
They will be given 3 minutes to answer the activity by completing
the paragraph with the correct terms.
As soon as they’re done with their work, they will post it on the area
assigned to them.
The teacher will check the answers.
Let the students read the paragraph orally.
“You Complete Me”
Complete the paragraph by filling in with correct terms.
3. Motivation: “Interactive Reading”
Each group will be assigned with one word (cans, bottles, papers, plastic,
recycle)
The teacher will read a composition in front of the class.
Every time the teacher speaks the word assigned for their group,
they will stand, do their moves and shout their yell.
A has the shape like a circle. It is divided into
that look like pieces of pie. So sometimes a circle graph is called
a . A pie graph is a circular region divided into
. It shows the of various parts of the
data to the whole.
sectors circle graph relationship parts pie graph
RECYCLE
By: Joyce Paultre
Cans! Bottles! Don’t throw it away- recycle!
Paper! Plastic! Don’t throw it away- recycle!
We’re on a mission to save the world.
Doesn’t matter if you’re a boy or girl.
Don’t put it off. Don’t hesitate.
Because tomorrow might be too late!
Reduce the trash
That’s in your can
Reusing things will help the land.
If you have paper,
Plastic, or tin
Help save the earth
Let’s recycle!
3.
B. Developmental Activities
1.Presentation
Present the lesson using different activities.
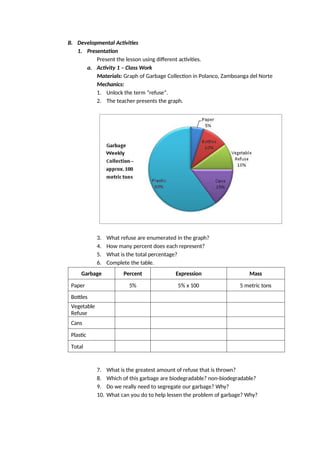
a. Activity 1 – Class Work
Materials: Graph of Garbage Collection in Polanco, Zamboanga del Norte
Mechanics:
1. Unlock the term “refuse”.
2. The teacher presents the graph.
3. What refuse are enumerated in the graph?
4. How many percent does each represent?
5. What is the total percentage?
6. Complete the table.
Garbage Percent Expression Mass
Paper 5% 5% x 100 5 metric tons
Bottles
Vegetable
Refuse
Cans
Plastic
Total
7. What is the greatest amount of refuse that is thrown?
8. Which of this garbage are biodegradable? non-biodegradable?
9. Do we really need to segregate our garbage? Why?
10. What can you do to help lessen the problem of garbage? Why?
4.
b. Activity 2– Cooperative/ Differentiated Learning
Materials: Problem Sets (see attached activity sheets), Manila Paper,
Marking Pens, Scotch Tape
Mechanics:
1. The class will be divided into three groups.
2. Each group will be given 1 set of materials for this activity.
3. Students will work cooperatively by group.
4. They will write their answers/composition in a cartolina/manila paper.
5. When they are done, they will shout their yell.
6. Group Presentations…
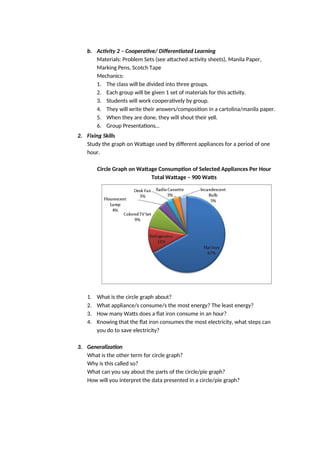
2. Fixing Skills
Study the graph on Wattage used by different appliances for a period of one
hour.
Circle Graph on Wattage Consumption of Selected Appliances Per Hour
Total Wattage – 900 Watts
1. What is the circle graph about?
2. What appliance/s consume/s the most energy? The least energy?
3. How many Watts does a flat iron consume in an hour?
4. Knowing that the flat iron consumes the most electricity, what steps can
you do to save electricity?
3. Generalization
What is the other term for circle graph?
Why is this called so?
What can you say about the parts of the circle/pie graph?
How will you interpret the data presented in a circle/pie graph?
5.
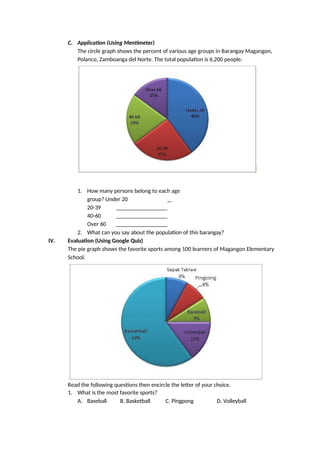
C. Application (UsingMentimeter)
The circle graph shows the percent of various age groups in Barangay Magangon,
Polanco, Zamboanga del Norte. The total population is 6,200 people.
1. How many persons belong to each age
group? Under 20
20-39
40-60
Over 60
2. What can you say about the population of this barangay?
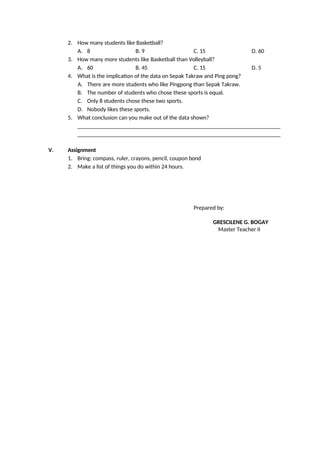
IV. Evaluation (Using Google Quiz)
The pie graph shows the favorite sports among 100 learners of Magangon Elementary
School.
Read the following questions then encircle the letter of your choice.
1. What is the most favorite sports?
A. Baseball B. Basketball C. Pingpong D. Volleyball
6.
2. How manystudents like Basketball?
A. 8 B. 9 C. 15 D. 60
3. How many more students like Basketball than Volleyball?
A. 60 B. 45 C. 15 D. 5
4. What is the implication of the data on Sepak Takraw and Ping pong?
A. There are more students who like Pingpong than Sepak Takraw.
B. The number of students who chose these sports is equal.
C. Only 8 students chose these two sports.
D. Nobody likes these sports.
5. What conclusion can you make out of the data shown?
V. Assignment
1. Bring: compass, ruler, crayons, pencil, coupon bond
2. Make a list of things you do within 24 hours.
Prepared by:
GRESCILENE G. BOGAY
Master Teacher II