SlideShare a Scribd company logo
1 of 4
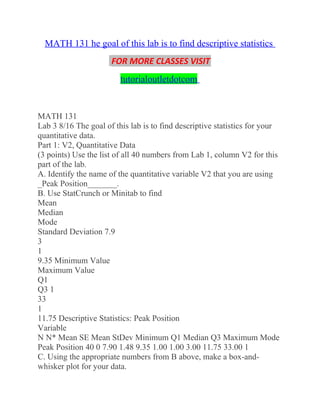
MATH 131 he goal of this lab is to find descriptive statistics
FOR MORE CLASSES VISIT
tutorialoutletdotcom
MATH 131
Lab 3 8/16 The goal of this lab is to find descriptive statistics for your
quantitative data.
Part 1: V2, Quantitative Data
(3 points) Use the list of all 40 numbers from Lab 1, column V2 for this
part of the lab.
A. Identify the name of the quantitative variable V2 that you are using
_Peak Position_______.
B. Use StatCrunch or Minitab to find
Mean
Median
Mode
Standard Deviation 7.9
3
1
9.35 Minimum Value
Maximum Value
Q1
Q3 1
33
1
11.75 Descriptive Statistics: Peak Position
Variable
N N* Mean SE Mean StDev Minimum Q1 Median Q3 Maximum Mode
Peak Position 40 0 7.90 1.48 9.35 1.00 1.00 3.00 11.75 33.00 1
C. Using the appropriate numbers from B above, make a box-and-
whisker plot for your data.
What does this plot tell you about your data? Boxplot of Peak Position
35 30 Peak Position 25 20 15 10 5 0 1 MATH 131
Lab 3
The data is positively skewed. 8/16 (2 Points) D. Looking at your list in
B, list your Minimum, Maximum and Mean data values. List below and
then find the z-score for each.
Data Value, x z-score ( z= Minimum 1 -0.726 Maximum 33 2.642 Mean
7.9 0 x−´x
)
s E. How do -scores indicate a data value is above the mean?
z
__positive__value___________________.
below the mean? _________negative value________________.
What -score always corresponds to the mean?
________zero___________________.
z
(2 Points) F. Use Chebychev's Theorem to write a statement about the
interval from 2 standard deviations
below the mean to 2 standard deviations above the mean. List the
specific interval you used for
your data. Interpret the result in the context of your data.
Based on chebyshevs theorem, about 75% of the data should be within
two standard deviations from the
mean.
interval for my data
Lower bound= -10.88
Upper bound =26.6
Values within the interval = 36
% of values within the interval = 90%
The data is not consistent with chebyshevs theorem.
Part 2: V3, Quantitative Data
(3 Points)
A. What is the name of your V3 variable? ____Weeks On
Chart________________________
2 MATH 131
Lab 3 8/16 B. Fill in the values in the chart below using the frequency
distribution in Lab 2, Part 3. You may not
need all of the rows below.
C. Use the appropriate values in the table to find the mean for your
grouped data.
Show your computations. Remember ∑ (x ∙ f )
´x =
n Data Groups,
using V3 Frequenc
y f Class
Midpoint 1-20
21-40
41-50
51-70
71-90
91-110
111-130
131-150 6
1
3
3
5
8
4
10 10.5
30.5
40.5
60.5
80.5
100.5
120.5
140.5 Total
Mean= x 40
87.25 D. Use StatCrunch or Minitab to find the mean and standard
deviation of the raw data.
(from Lab 1).
Descriptive Statistics: Weeks on Chart
Variable
Mean StDev
Weeks on Chart 40 0 77.28 49.64
E. Compare the answers in C and D. What accounts for any difference?
3 x∙f
63
30.5
121.5
181.5
402.5
804
482
1405
3490 MATH 131
8/16
Lab 3
For the frequency distribution, the result is an estimate as compared to
that of the Minitab output which
is exact as it is based on individual scores StatCrunch directions Minitab
directions 1. Stat
2. Summary stats
3. Columns 1. Stat
2. Basic Stat
3. Display descriptive statistics
*********************************************

More Related Content

What's hot

What's hot (19)

Data Analysis Assignment Help
Data Analysis Assignment HelpData Analysis Assignment Help
Data Analysis Assignment Help
 
How to draw a good graph
How to draw a good graphHow to draw a good graph
How to draw a good graph
 
FINALFINALFINAL
FINALFINALFINALFINALFINALFINAL
FINALFINALFINAL
 
2.5
2.52.5
2.5
 
2.1-2.2 Organizing Data
2.1-2.2 Organizing Data2.1-2.2 Organizing Data
2.1-2.2 Organizing Data
 
Functions
FunctionsFunctions
Functions
 
Writing quadratic equations
Writing quadratic equationsWriting quadratic equations
Writing quadratic equations
 
Workshop 04 Review
Workshop 04 ReviewWorkshop 04 Review
Workshop 04 Review
 
Basic formulas and functions
Basic formulas and functionsBasic formulas and functions
Basic formulas and functions
 
Multiplication of matrices and its application in biology
Multiplication of matrices and its application in biologyMultiplication of matrices and its application in biology
Multiplication of matrices and its application in biology
 
Grade 9 COMPUTER
Grade 9 COMPUTERGrade 9 COMPUTER
Grade 9 COMPUTER
 
Matrix and it's application
Matrix and it's application Matrix and it's application
Matrix and it's application
 
Chapter 2
Chapter 2Chapter 2
Chapter 2
 
Scalable machine learning
Scalable machine learningScalable machine learning
Scalable machine learning
 
T testcorrel
T testcorrelT testcorrel
T testcorrel
 
Graphing sytems inequalities
Graphing sytems inequalitiesGraphing sytems inequalities
Graphing sytems inequalities
 
Final Project
Final ProjectFinal Project
Final Project
 
Computing and Data Analysis for Environmental Applications
Computing and Data Analysis for Environmental ApplicationsComputing and Data Analysis for Environmental Applications
Computing and Data Analysis for Environmental Applications
 
Histogram
HistogramHistogram
Histogram
 

Similar to Math 131 he goal of this lab is to find descriptive statistics/tutorialoutlet

Missing Parts I don’t think you understood the assignment.docx
Missing Parts I don’t think you understood the assignment.docxMissing Parts I don’t think you understood the assignment.docx
Missing Parts I don’t think you understood the assignment.docxannandleola
 
UNIT III - Arrays - Measures of Center and Variation (2).ppt
UNIT III - Arrays - Measures of Center and Variation (2).pptUNIT III - Arrays - Measures of Center and Variation (2).ppt
UNIT III - Arrays - Measures of Center and Variation (2).pptAjithGhoyal
 
Chapter 2: Frequency Distribution and Graphs
Chapter 2: Frequency Distribution and GraphsChapter 2: Frequency Distribution and Graphs
Chapter 2: Frequency Distribution and GraphsMong Mara
 
JF608: Quality Control - Unit 3
JF608: Quality Control - Unit 3JF608: Quality Control - Unit 3
JF608: Quality Control - Unit 3Asraf Malik
 
Nota Bab 1 JF608
Nota Bab 1 JF608Nota Bab 1 JF608
Nota Bab 1 JF608Mira Awang
 
lesson 4 measures of central tendency copy
lesson 4 measures of central tendency   copylesson 4 measures of central tendency   copy
lesson 4 measures of central tendency copyNerz Baldres
 
Math 533 week 6 more help
Math 533 week 6   more helpMath 533 week 6   more help
Math 533 week 6 more helpBrent Heard
 
Workshop 4
Workshop 4Workshop 4
Workshop 4eeetq
 
Page 1 of 18Part A Multiple Choice (1–11)______1. Using.docx
Page 1 of 18Part A Multiple Choice (1–11)______1. Using.docxPage 1 of 18Part A Multiple Choice (1–11)______1. Using.docx
Page 1 of 18Part A Multiple Choice (1–11)______1. Using.docxalfred4lewis58146
 
Steps for q3 q4
Steps for q3 q4Steps for q3 q4
Steps for q3 q4IIUM
 
Summarizing Data : Listing and Grouping pdf
Summarizing Data : Listing and Grouping pdfSummarizing Data : Listing and Grouping pdf
Summarizing Data : Listing and Grouping pdfJustynOwen
 
Empirics of standard deviation
Empirics of standard deviationEmpirics of standard deviation
Empirics of standard deviationAdebanji Ayeni
 
Assessment 3 – Hypothesis, Effect Size, Power, and t Tests.docx
Assessment 3 – Hypothesis, Effect Size, Power, and t Tests.docxAssessment 3 – Hypothesis, Effect Size, Power, and t Tests.docx
Assessment 3 – Hypothesis, Effect Size, Power, and t Tests.docxcargillfilberto
 
X Bar And S Charts Mini Tutorial
X Bar And S Charts Mini TutorialX Bar And S Charts Mini Tutorial
X Bar And S Charts Mini Tutorialahmad bassiouny
 
Using excel to convert raw score to z score
Using excel to convert raw score to z scoreUsing excel to convert raw score to z score
Using excel to convert raw score to z scoreSandra Nicks
 
Chapter 1 descriptive_stats_2_rev_2009
Chapter 1 descriptive_stats_2_rev_2009Chapter 1 descriptive_stats_2_rev_2009
Chapter 1 descriptive_stats_2_rev_2009ayimsevenfold
 
Heart disease classification
Heart disease classificationHeart disease classification
Heart disease classificationSnehaDey21
 
Matrices and linear algebra
Matrices and linear algebraMatrices and linear algebra
Matrices and linear algebraCarolina Camacho
 

Similar to Math 131 he goal of this lab is to find descriptive statistics/tutorialoutlet (20)

Missing Parts I don’t think you understood the assignment.docx
Missing Parts I don’t think you understood the assignment.docxMissing Parts I don’t think you understood the assignment.docx
Missing Parts I don’t think you understood the assignment.docx
 
UNIT III - Arrays - Measures of Center and Variation (2).ppt
UNIT III - Arrays - Measures of Center and Variation (2).pptUNIT III - Arrays - Measures of Center and Variation (2).ppt
UNIT III - Arrays - Measures of Center and Variation (2).ppt
 
Chapter 2: Frequency Distribution and Graphs
Chapter 2: Frequency Distribution and GraphsChapter 2: Frequency Distribution and Graphs
Chapter 2: Frequency Distribution and Graphs
 
JF608: Quality Control - Unit 3
JF608: Quality Control - Unit 3JF608: Quality Control - Unit 3
JF608: Quality Control - Unit 3
 
Nota Bab 1 JF608
Nota Bab 1 JF608Nota Bab 1 JF608
Nota Bab 1 JF608
 
lesson 4 measures of central tendency copy
lesson 4 measures of central tendency   copylesson 4 measures of central tendency   copy
lesson 4 measures of central tendency copy
 
Math 533 week 6 more help
Math 533 week 6   more helpMath 533 week 6   more help
Math 533 week 6 more help
 
Workshop 4
Workshop 4Workshop 4
Workshop 4
 
Page 1 of 18Part A Multiple Choice (1–11)______1. Using.docx
Page 1 of 18Part A Multiple Choice (1–11)______1. Using.docxPage 1 of 18Part A Multiple Choice (1–11)______1. Using.docx
Page 1 of 18Part A Multiple Choice (1–11)______1. Using.docx
 
9618821.pdf
9618821.pdf9618821.pdf
9618821.pdf
 
9618821.ppt
9618821.ppt9618821.ppt
9618821.ppt
 
Steps for q3 q4
Steps for q3 q4Steps for q3 q4
Steps for q3 q4
 
Summarizing Data : Listing and Grouping pdf
Summarizing Data : Listing and Grouping pdfSummarizing Data : Listing and Grouping pdf
Summarizing Data : Listing and Grouping pdf
 
Empirics of standard deviation
Empirics of standard deviationEmpirics of standard deviation
Empirics of standard deviation
 
Assessment 3 – Hypothesis, Effect Size, Power, and t Tests.docx
Assessment 3 – Hypothesis, Effect Size, Power, and t Tests.docxAssessment 3 – Hypothesis, Effect Size, Power, and t Tests.docx
Assessment 3 – Hypothesis, Effect Size, Power, and t Tests.docx
 
X Bar And S Charts Mini Tutorial
X Bar And S Charts Mini TutorialX Bar And S Charts Mini Tutorial
X Bar And S Charts Mini Tutorial
 
Using excel to convert raw score to z score
Using excel to convert raw score to z scoreUsing excel to convert raw score to z score
Using excel to convert raw score to z score
 
Chapter 1 descriptive_stats_2_rev_2009
Chapter 1 descriptive_stats_2_rev_2009Chapter 1 descriptive_stats_2_rev_2009
Chapter 1 descriptive_stats_2_rev_2009
 
Heart disease classification
Heart disease classificationHeart disease classification
Heart disease classification
 
Matrices and linear algebra
Matrices and linear algebraMatrices and linear algebra
Matrices and linear algebra
 

Recently uploaded

How to Make a Pirate ship Primary Education.pptx
How to Make a Pirate ship Primary Education.pptxHow to Make a Pirate ship Primary Education.pptx
How to Make a Pirate ship Primary Education.pptxmanuelaromero2013
 
Enzyme, Pharmaceutical Aids, Miscellaneous Last Part of Chapter no 5th.pdf
Enzyme, Pharmaceutical Aids, Miscellaneous Last Part of Chapter no 5th.pdfEnzyme, Pharmaceutical Aids, Miscellaneous Last Part of Chapter no 5th.pdf
Enzyme, Pharmaceutical Aids, Miscellaneous Last Part of Chapter no 5th.pdfSumit Tiwari
 
KSHARA STURA .pptx---KSHARA KARMA THERAPY (CAUSTIC THERAPY)————IMP.OF KSHARA ...
KSHARA STURA .pptx---KSHARA KARMA THERAPY (CAUSTIC THERAPY)————IMP.OF KSHARA ...KSHARA STURA .pptx---KSHARA KARMA THERAPY (CAUSTIC THERAPY)————IMP.OF KSHARA ...
KSHARA STURA .pptx---KSHARA KARMA THERAPY (CAUSTIC THERAPY)————IMP.OF KSHARA ...M56BOOKSTORE PRODUCT/SERVICE
 
Employee wellbeing at the workplace.pptx
Employee wellbeing at the workplace.pptxEmployee wellbeing at the workplace.pptx
Employee wellbeing at the workplace.pptxNirmalaLoungPoorunde1
 
Full Stack Web Development Course for Beginners
Full Stack Web Development Course  for BeginnersFull Stack Web Development Course  for Beginners
Full Stack Web Development Course for BeginnersSabitha Banu
 
Biting mechanism of poisonous snakes.pdf
Biting mechanism of poisonous snakes.pdfBiting mechanism of poisonous snakes.pdf
Biting mechanism of poisonous snakes.pdfadityarao40181
 
How to Configure Email Server in Odoo 17
How to Configure Email Server in Odoo 17How to Configure Email Server in Odoo 17
How to Configure Email Server in Odoo 17Celine George
 
“Oh GOSH! Reflecting on Hackteria's Collaborative Practices in a Global Do-It...
“Oh GOSH! Reflecting on Hackteria's Collaborative Practices in a Global Do-It...“Oh GOSH! Reflecting on Hackteria's Collaborative Practices in a Global Do-It...
“Oh GOSH! Reflecting on Hackteria's Collaborative Practices in a Global Do-It...Marc Dusseiller Dusjagr
 
Historical philosophical, theoretical, and legal foundations of special and i...
Historical philosophical, theoretical, and legal foundations of special and i...Historical philosophical, theoretical, and legal foundations of special and i...
Historical philosophical, theoretical, and legal foundations of special and i...jaredbarbolino94
 
Proudly South Africa powerpoint Thorisha.pptx
Proudly South Africa powerpoint Thorisha.pptxProudly South Africa powerpoint Thorisha.pptx
Proudly South Africa powerpoint Thorisha.pptxthorishapillay1
 
CARE OF CHILD IN INCUBATOR..........pptx
CARE OF CHILD IN INCUBATOR..........pptxCARE OF CHILD IN INCUBATOR..........pptx
CARE OF CHILD IN INCUBATOR..........pptxGaneshChakor2
 
Presiding Officer Training module 2024 lok sabha elections
Presiding Officer Training module 2024 lok sabha electionsPresiding Officer Training module 2024 lok sabha elections
Presiding Officer Training module 2024 lok sabha electionsanshu789521
 
internship ppt on smartinternz platform as salesforce developer
internship ppt on smartinternz platform as salesforce developerinternship ppt on smartinternz platform as salesforce developer
internship ppt on smartinternz platform as salesforce developerunnathinaik
 
Computed Fields and api Depends in the Odoo 17
Computed Fields and api Depends in the Odoo 17Computed Fields and api Depends in the Odoo 17
Computed Fields and api Depends in the Odoo 17Celine George
 
Software Engineering Methodologies (overview)
Software Engineering Methodologies (overview)Software Engineering Methodologies (overview)
Software Engineering Methodologies (overview)eniolaolutunde
 
POINT- BIOCHEMISTRY SEM 2 ENZYMES UNIT 5.pptx
POINT- BIOCHEMISTRY SEM 2 ENZYMES UNIT 5.pptxPOINT- BIOCHEMISTRY SEM 2 ENZYMES UNIT 5.pptx
POINT- BIOCHEMISTRY SEM 2 ENZYMES UNIT 5.pptxSayali Powar
 
CELL CYCLE Division Science 8 quarter IV.pptx
CELL CYCLE Division Science 8 quarter IV.pptxCELL CYCLE Division Science 8 quarter IV.pptx
CELL CYCLE Division Science 8 quarter IV.pptxJiesonDelaCerna
 

Recently uploaded (20)

How to Make a Pirate ship Primary Education.pptx
How to Make a Pirate ship Primary Education.pptxHow to Make a Pirate ship Primary Education.pptx
How to Make a Pirate ship Primary Education.pptx
 
Enzyme, Pharmaceutical Aids, Miscellaneous Last Part of Chapter no 5th.pdf
Enzyme, Pharmaceutical Aids, Miscellaneous Last Part of Chapter no 5th.pdfEnzyme, Pharmaceutical Aids, Miscellaneous Last Part of Chapter no 5th.pdf
Enzyme, Pharmaceutical Aids, Miscellaneous Last Part of Chapter no 5th.pdf
 
KSHARA STURA .pptx---KSHARA KARMA THERAPY (CAUSTIC THERAPY)————IMP.OF KSHARA ...
KSHARA STURA .pptx---KSHARA KARMA THERAPY (CAUSTIC THERAPY)————IMP.OF KSHARA ...KSHARA STURA .pptx---KSHARA KARMA THERAPY (CAUSTIC THERAPY)————IMP.OF KSHARA ...
KSHARA STURA .pptx---KSHARA KARMA THERAPY (CAUSTIC THERAPY)————IMP.OF KSHARA ...
 
Employee wellbeing at the workplace.pptx
Employee wellbeing at the workplace.pptxEmployee wellbeing at the workplace.pptx
Employee wellbeing at the workplace.pptx
 
Full Stack Web Development Course for Beginners
Full Stack Web Development Course  for BeginnersFull Stack Web Development Course  for Beginners
Full Stack Web Development Course for Beginners
 
Biting mechanism of poisonous snakes.pdf
Biting mechanism of poisonous snakes.pdfBiting mechanism of poisonous snakes.pdf
Biting mechanism of poisonous snakes.pdf
 
How to Configure Email Server in Odoo 17
How to Configure Email Server in Odoo 17How to Configure Email Server in Odoo 17
How to Configure Email Server in Odoo 17
 
“Oh GOSH! Reflecting on Hackteria's Collaborative Practices in a Global Do-It...
“Oh GOSH! Reflecting on Hackteria's Collaborative Practices in a Global Do-It...“Oh GOSH! Reflecting on Hackteria's Collaborative Practices in a Global Do-It...
“Oh GOSH! Reflecting on Hackteria's Collaborative Practices in a Global Do-It...
 
Historical philosophical, theoretical, and legal foundations of special and i...
Historical philosophical, theoretical, and legal foundations of special and i...Historical philosophical, theoretical, and legal foundations of special and i...
Historical philosophical, theoretical, and legal foundations of special and i...
 
OS-operating systems- ch04 (Threads) ...
OS-operating systems- ch04 (Threads) ...OS-operating systems- ch04 (Threads) ...
OS-operating systems- ch04 (Threads) ...
 
Proudly South Africa powerpoint Thorisha.pptx
Proudly South Africa powerpoint Thorisha.pptxProudly South Africa powerpoint Thorisha.pptx
Proudly South Africa powerpoint Thorisha.pptx
 
Model Call Girl in Tilak Nagar Delhi reach out to us at 🔝9953056974🔝
Model Call Girl in Tilak Nagar Delhi reach out to us at 🔝9953056974🔝Model Call Girl in Tilak Nagar Delhi reach out to us at 🔝9953056974🔝
Model Call Girl in Tilak Nagar Delhi reach out to us at 🔝9953056974🔝
 
CARE OF CHILD IN INCUBATOR..........pptx
CARE OF CHILD IN INCUBATOR..........pptxCARE OF CHILD IN INCUBATOR..........pptx
CARE OF CHILD IN INCUBATOR..........pptx
 
Presiding Officer Training module 2024 lok sabha elections
Presiding Officer Training module 2024 lok sabha electionsPresiding Officer Training module 2024 lok sabha elections
Presiding Officer Training module 2024 lok sabha elections
 
internship ppt on smartinternz platform as salesforce developer
internship ppt on smartinternz platform as salesforce developerinternship ppt on smartinternz platform as salesforce developer
internship ppt on smartinternz platform as salesforce developer
 
ESSENTIAL of (CS/IT/IS) class 06 (database)
ESSENTIAL of (CS/IT/IS) class 06 (database)ESSENTIAL of (CS/IT/IS) class 06 (database)
ESSENTIAL of (CS/IT/IS) class 06 (database)
 
Computed Fields and api Depends in the Odoo 17
Computed Fields and api Depends in the Odoo 17Computed Fields and api Depends in the Odoo 17
Computed Fields and api Depends in the Odoo 17
 
Software Engineering Methodologies (overview)
Software Engineering Methodologies (overview)Software Engineering Methodologies (overview)
Software Engineering Methodologies (overview)
 
POINT- BIOCHEMISTRY SEM 2 ENZYMES UNIT 5.pptx
POINT- BIOCHEMISTRY SEM 2 ENZYMES UNIT 5.pptxPOINT- BIOCHEMISTRY SEM 2 ENZYMES UNIT 5.pptx
POINT- BIOCHEMISTRY SEM 2 ENZYMES UNIT 5.pptx
 
CELL CYCLE Division Science 8 quarter IV.pptx
CELL CYCLE Division Science 8 quarter IV.pptxCELL CYCLE Division Science 8 quarter IV.pptx
CELL CYCLE Division Science 8 quarter IV.pptx
 

Math 131 he goal of this lab is to find descriptive statistics/tutorialoutlet

  • 1. MATH 131 he goal of this lab is to find descriptive statistics FOR MORE CLASSES VISIT tutorialoutletdotcom MATH 131 Lab 3 8/16 The goal of this lab is to find descriptive statistics for your quantitative data. Part 1: V2, Quantitative Data (3 points) Use the list of all 40 numbers from Lab 1, column V2 for this part of the lab. A. Identify the name of the quantitative variable V2 that you are using _Peak Position_______. B. Use StatCrunch or Minitab to find Mean Median Mode Standard Deviation 7.9 3 1 9.35 Minimum Value Maximum Value Q1 Q3 1 33 1 11.75 Descriptive Statistics: Peak Position Variable N N* Mean SE Mean StDev Minimum Q1 Median Q3 Maximum Mode Peak Position 40 0 7.90 1.48 9.35 1.00 1.00 3.00 11.75 33.00 1 C. Using the appropriate numbers from B above, make a box-and- whisker plot for your data.
  • 2. What does this plot tell you about your data? Boxplot of Peak Position 35 30 Peak Position 25 20 15 10 5 0 1 MATH 131 Lab 3 The data is positively skewed. 8/16 (2 Points) D. Looking at your list in B, list your Minimum, Maximum and Mean data values. List below and then find the z-score for each. Data Value, x z-score ( z= Minimum 1 -0.726 Maximum 33 2.642 Mean 7.9 0 x−´x ) s E. How do -scores indicate a data value is above the mean? z __positive__value___________________. below the mean? _________negative value________________. What -score always corresponds to the mean? ________zero___________________. z (2 Points) F. Use Chebychev's Theorem to write a statement about the interval from 2 standard deviations below the mean to 2 standard deviations above the mean. List the specific interval you used for your data. Interpret the result in the context of your data. Based on chebyshevs theorem, about 75% of the data should be within two standard deviations from the mean. interval for my data Lower bound= -10.88 Upper bound =26.6 Values within the interval = 36 % of values within the interval = 90% The data is not consistent with chebyshevs theorem. Part 2: V3, Quantitative Data (3 Points) A. What is the name of your V3 variable? ____Weeks On Chart________________________ 2 MATH 131
  • 3. Lab 3 8/16 B. Fill in the values in the chart below using the frequency distribution in Lab 2, Part 3. You may not need all of the rows below. C. Use the appropriate values in the table to find the mean for your grouped data. Show your computations. Remember ∑ (x ∙ f ) ´x = n Data Groups, using V3 Frequenc y f Class Midpoint 1-20 21-40 41-50 51-70 71-90 91-110 111-130 131-150 6 1 3 3 5 8 4 10 10.5 30.5 40.5 60.5 80.5 100.5 120.5 140.5 Total Mean= x 40 87.25 D. Use StatCrunch or Minitab to find the mean and standard deviation of the raw data.
  • 4. (from Lab 1). Descriptive Statistics: Weeks on Chart Variable Mean StDev Weeks on Chart 40 0 77.28 49.64 E. Compare the answers in C and D. What accounts for any difference? 3 x∙f 63 30.5 121.5 181.5 402.5 804 482 1405 3490 MATH 131 8/16 Lab 3 For the frequency distribution, the result is an estimate as compared to that of the Minitab output which is exact as it is based on individual scores StatCrunch directions Minitab directions 1. Stat 2. Summary stats 3. Columns 1. Stat 2. Basic Stat 3. Display descriptive statistics *********************************************