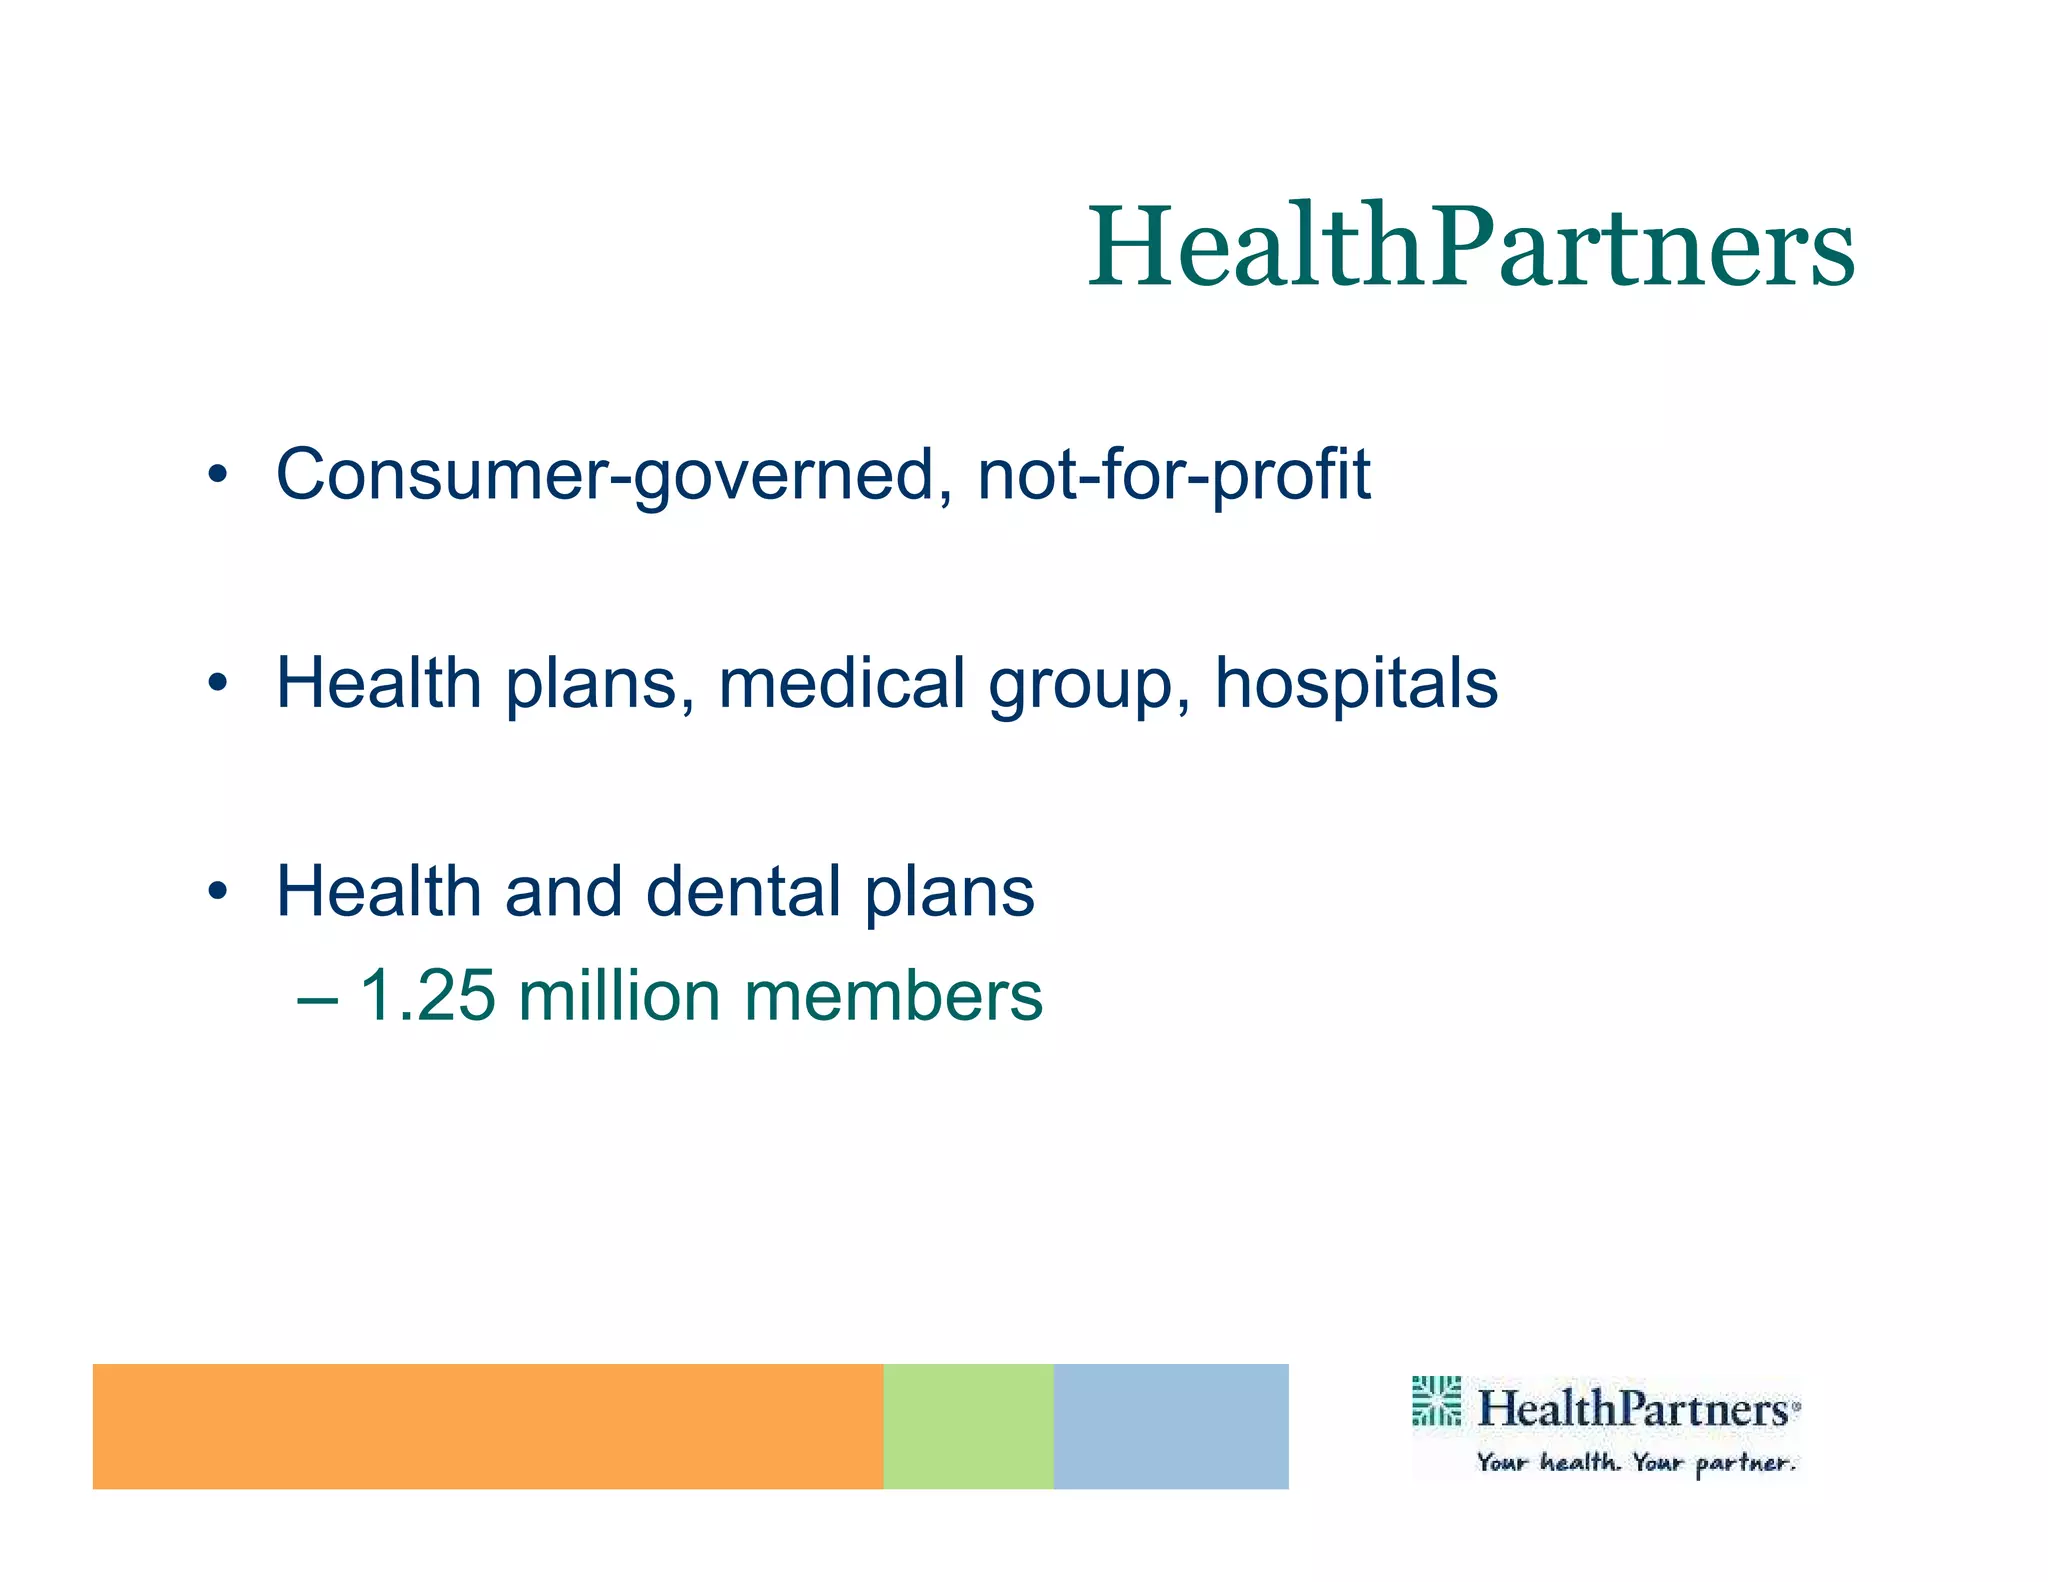
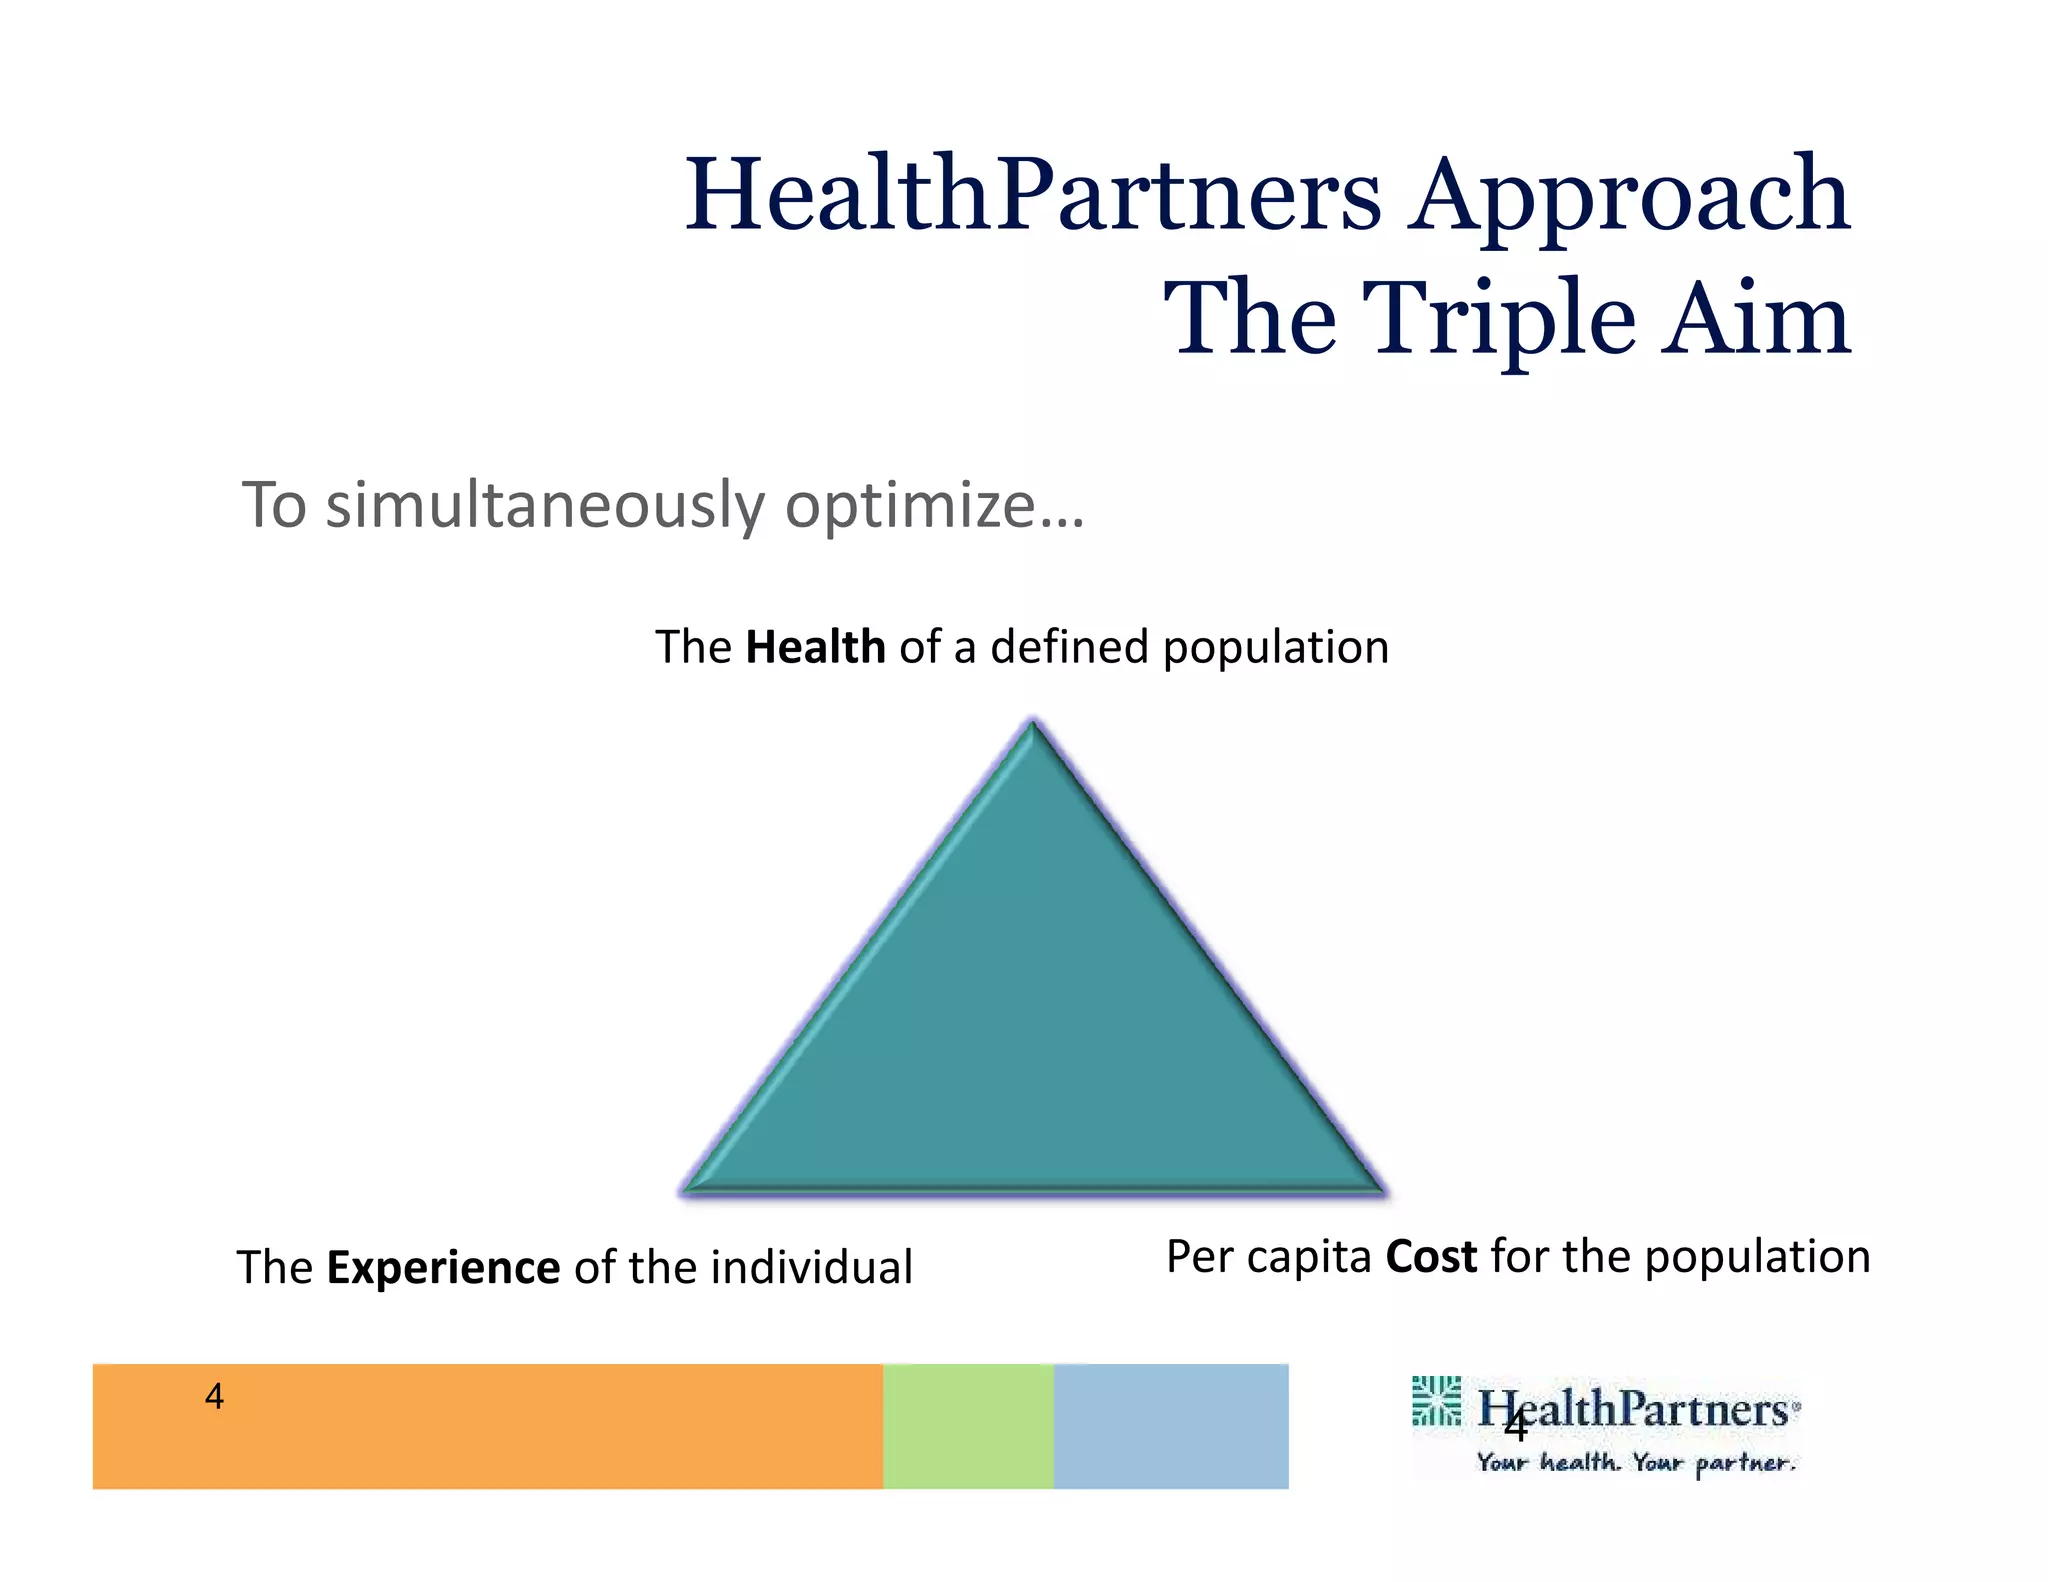
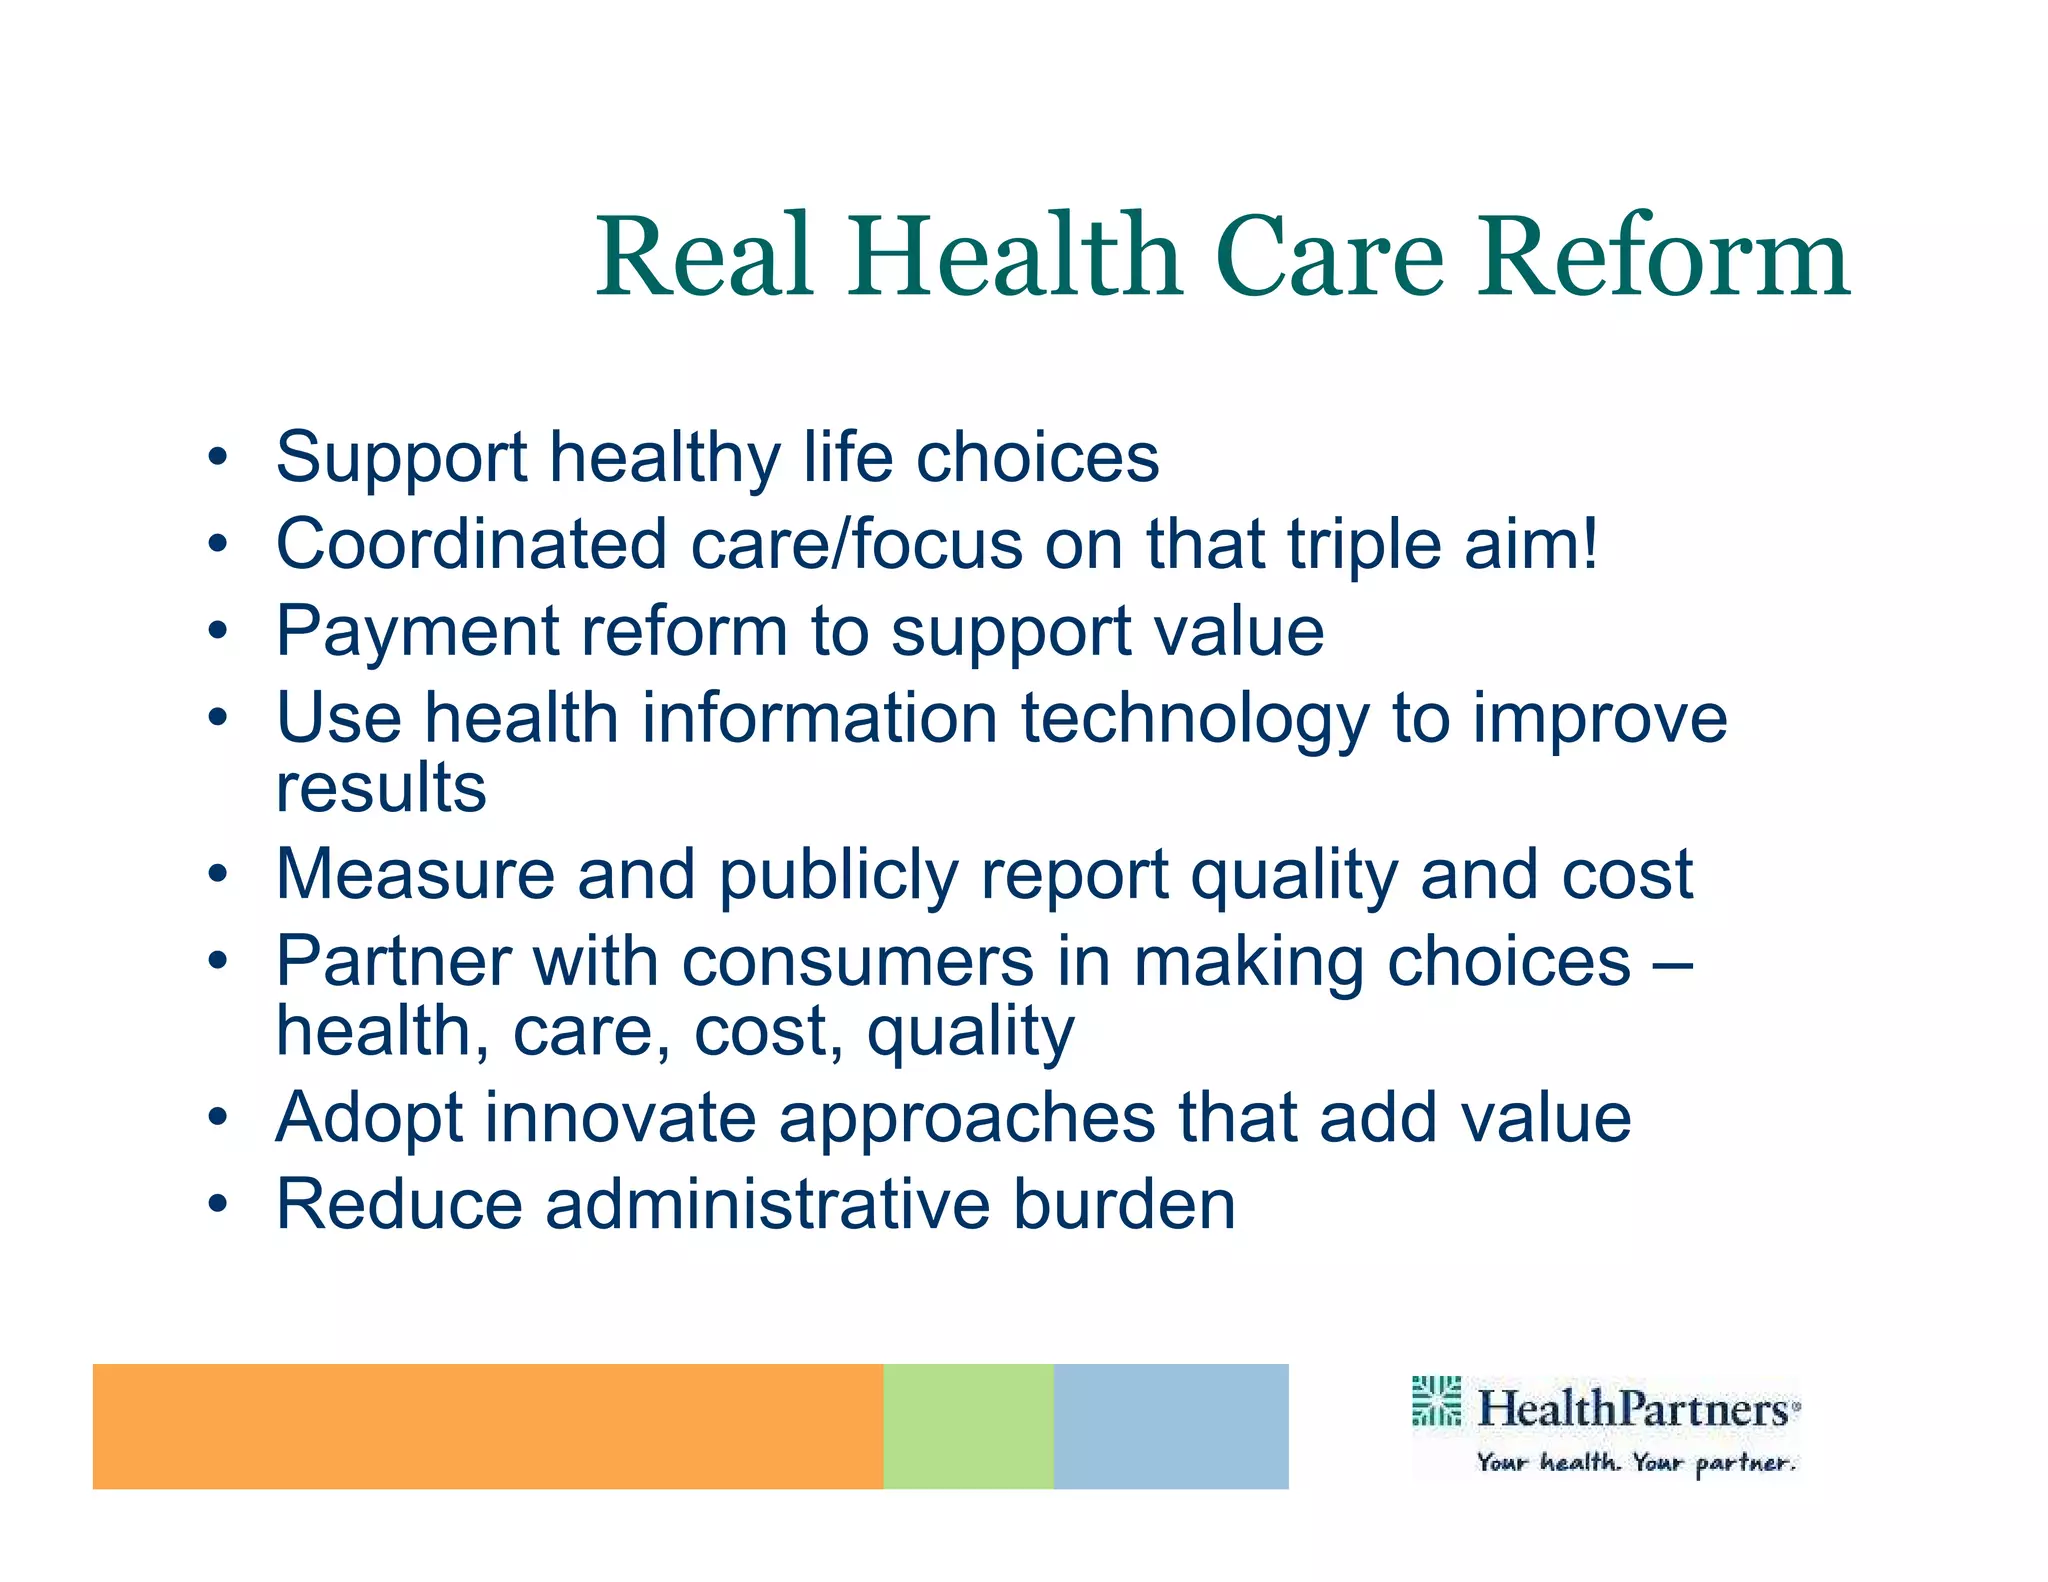
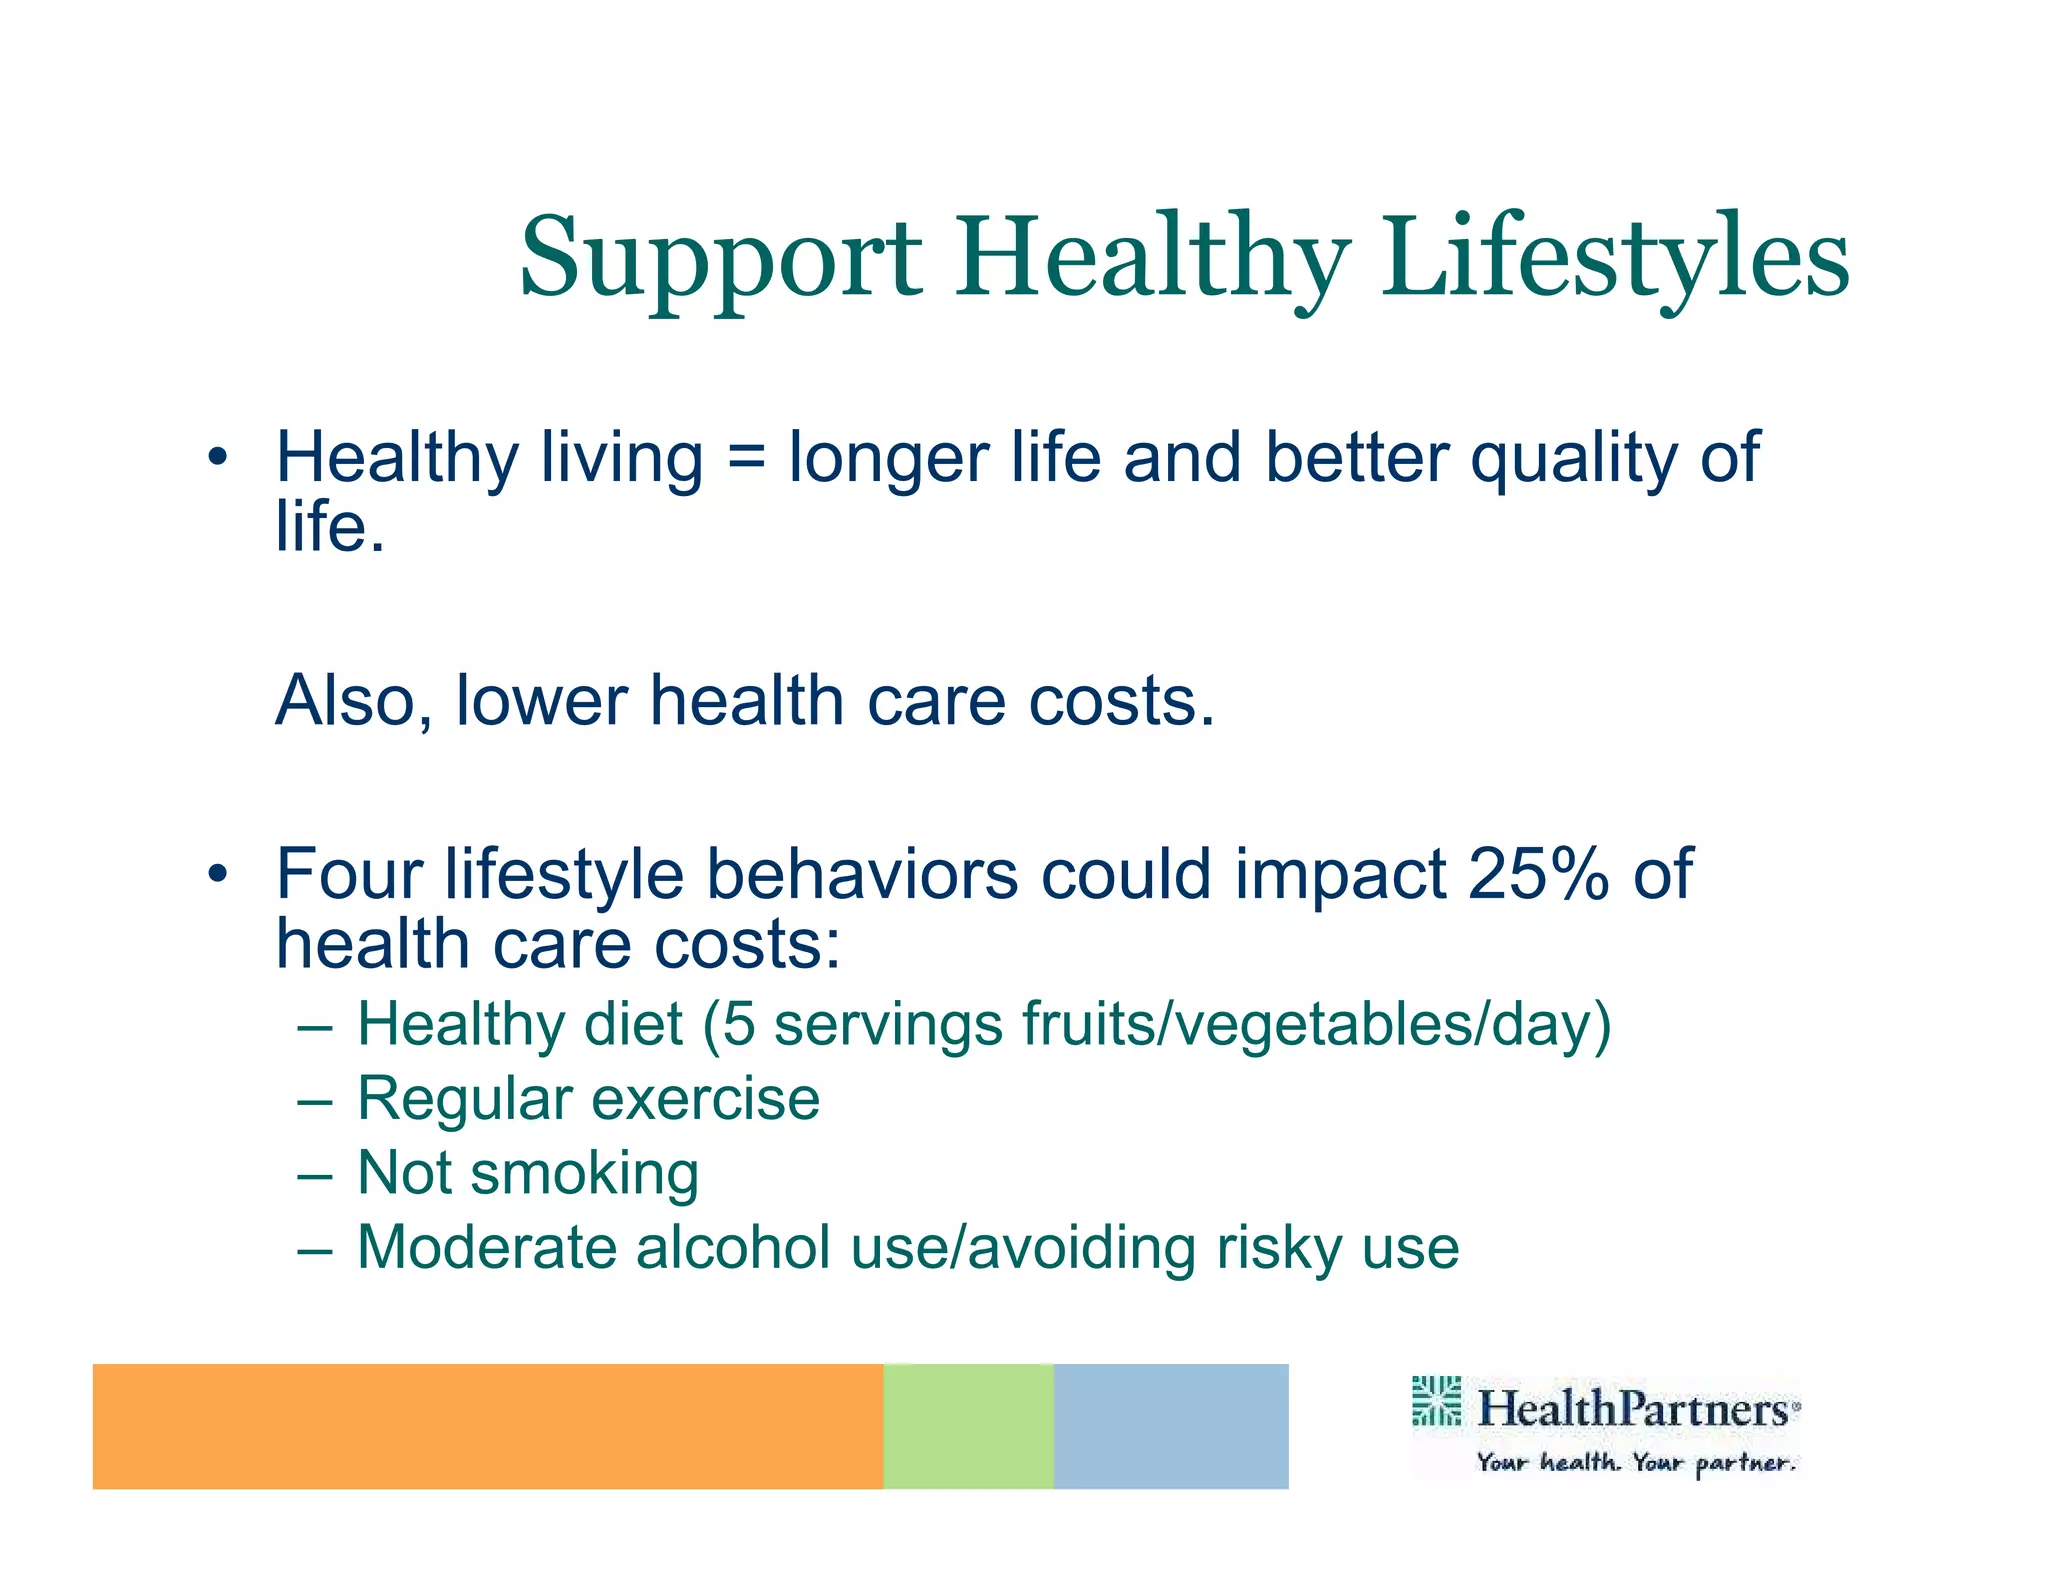
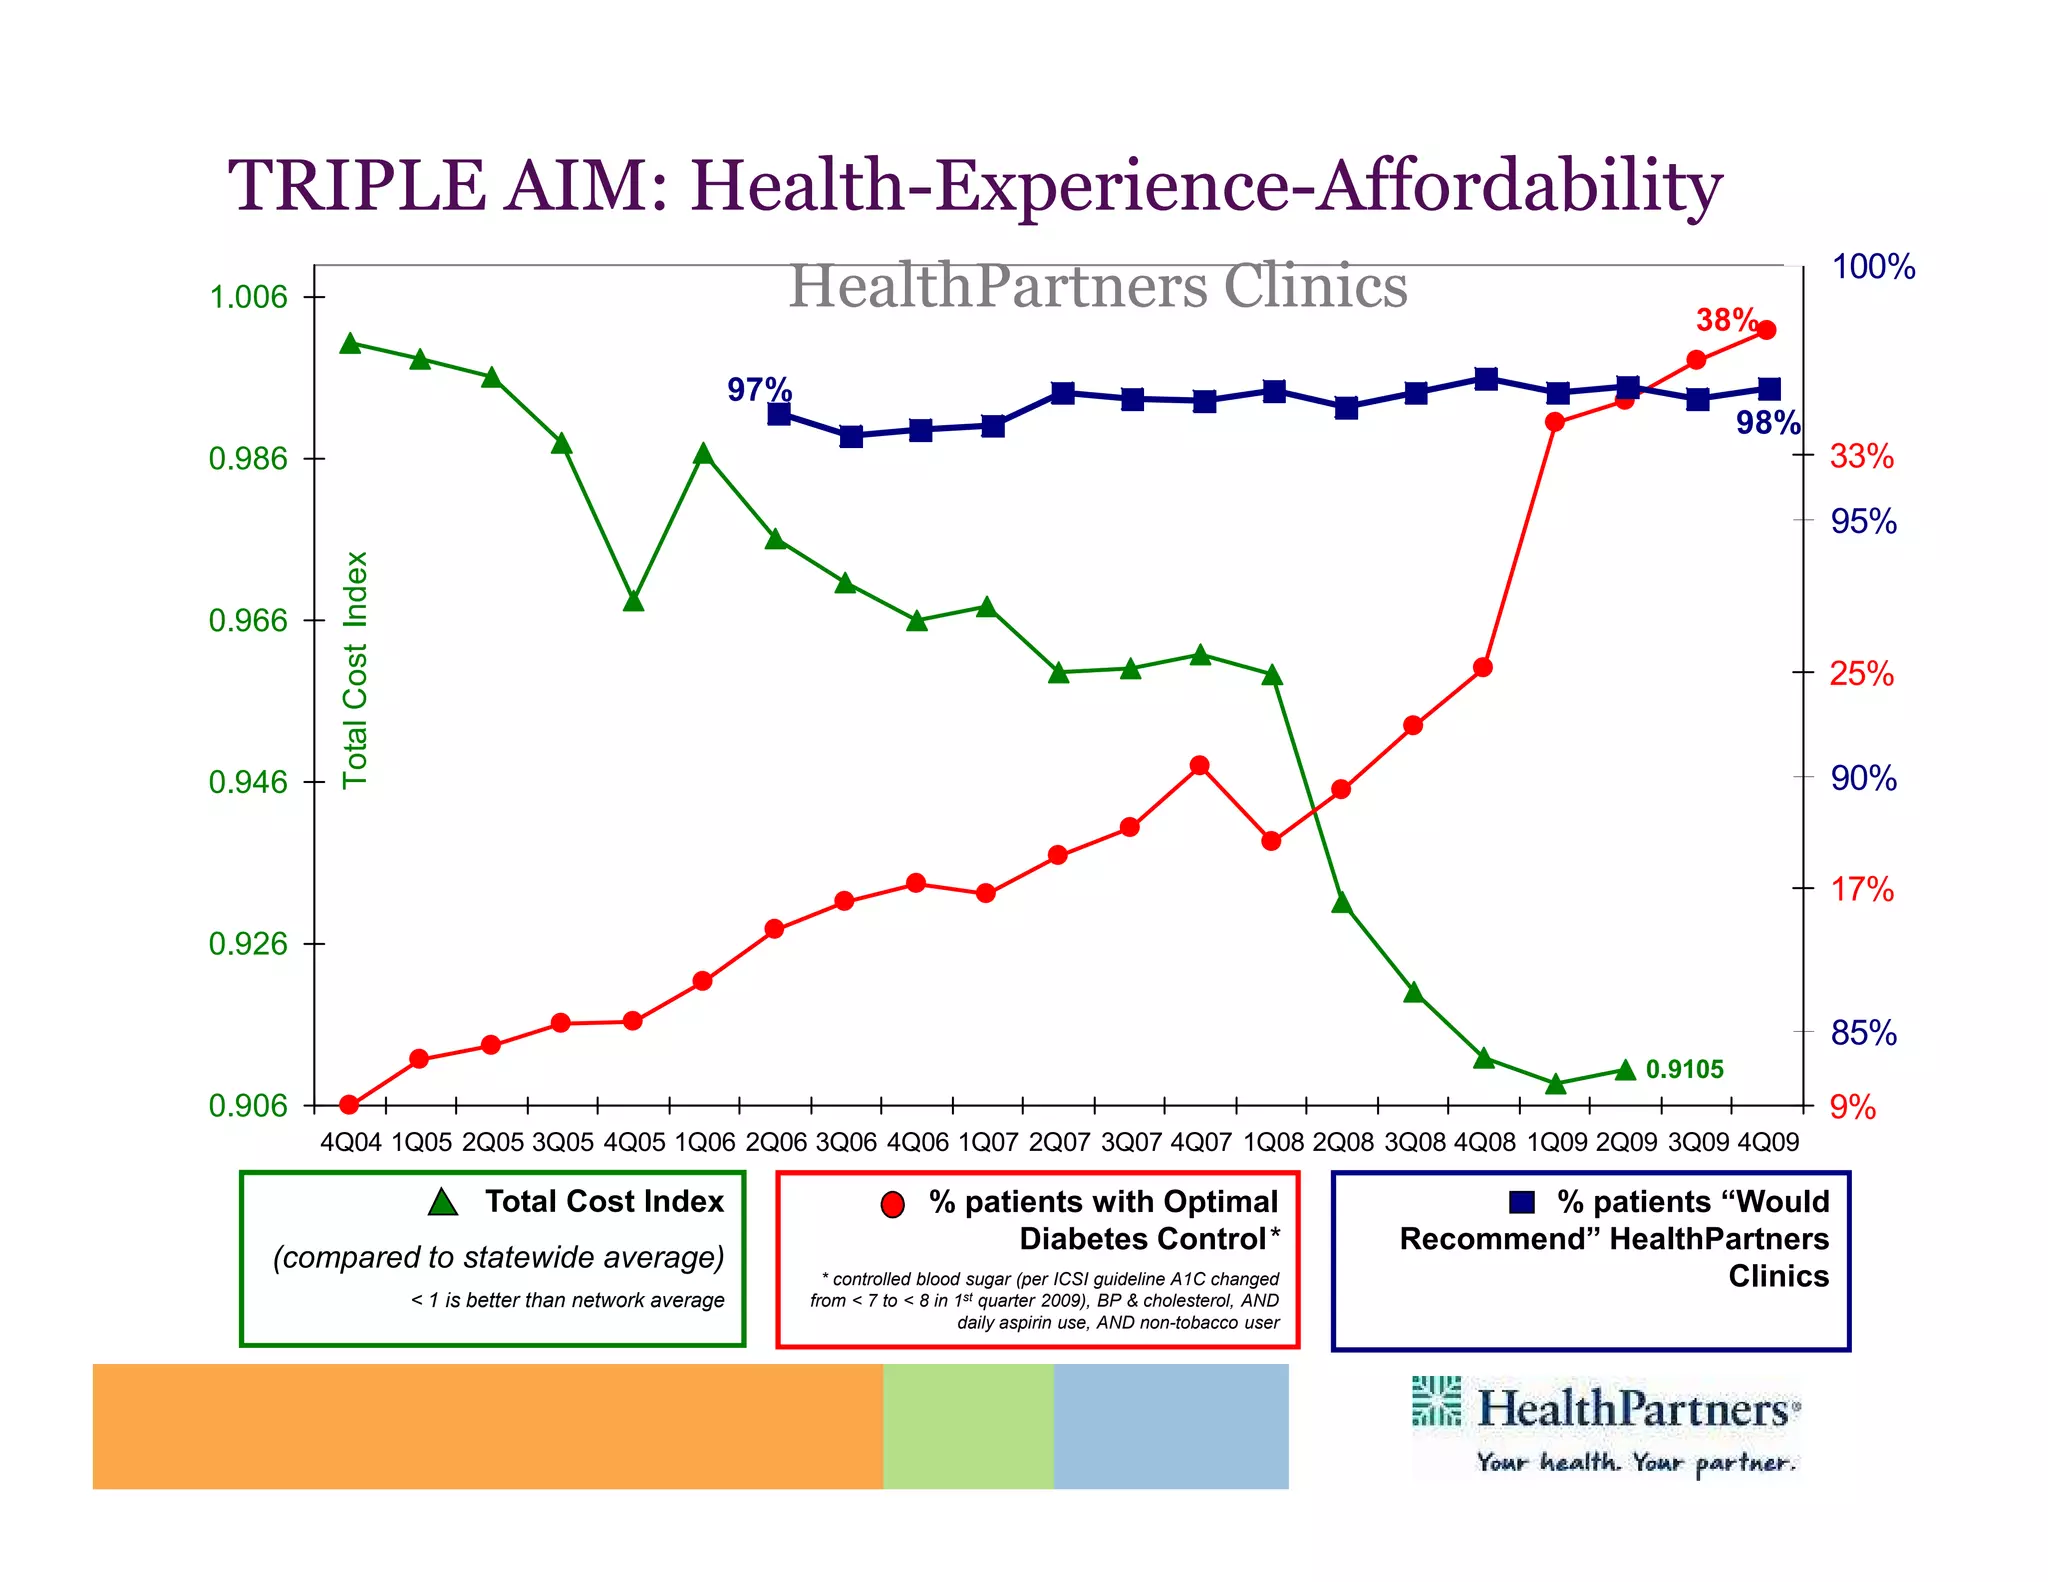
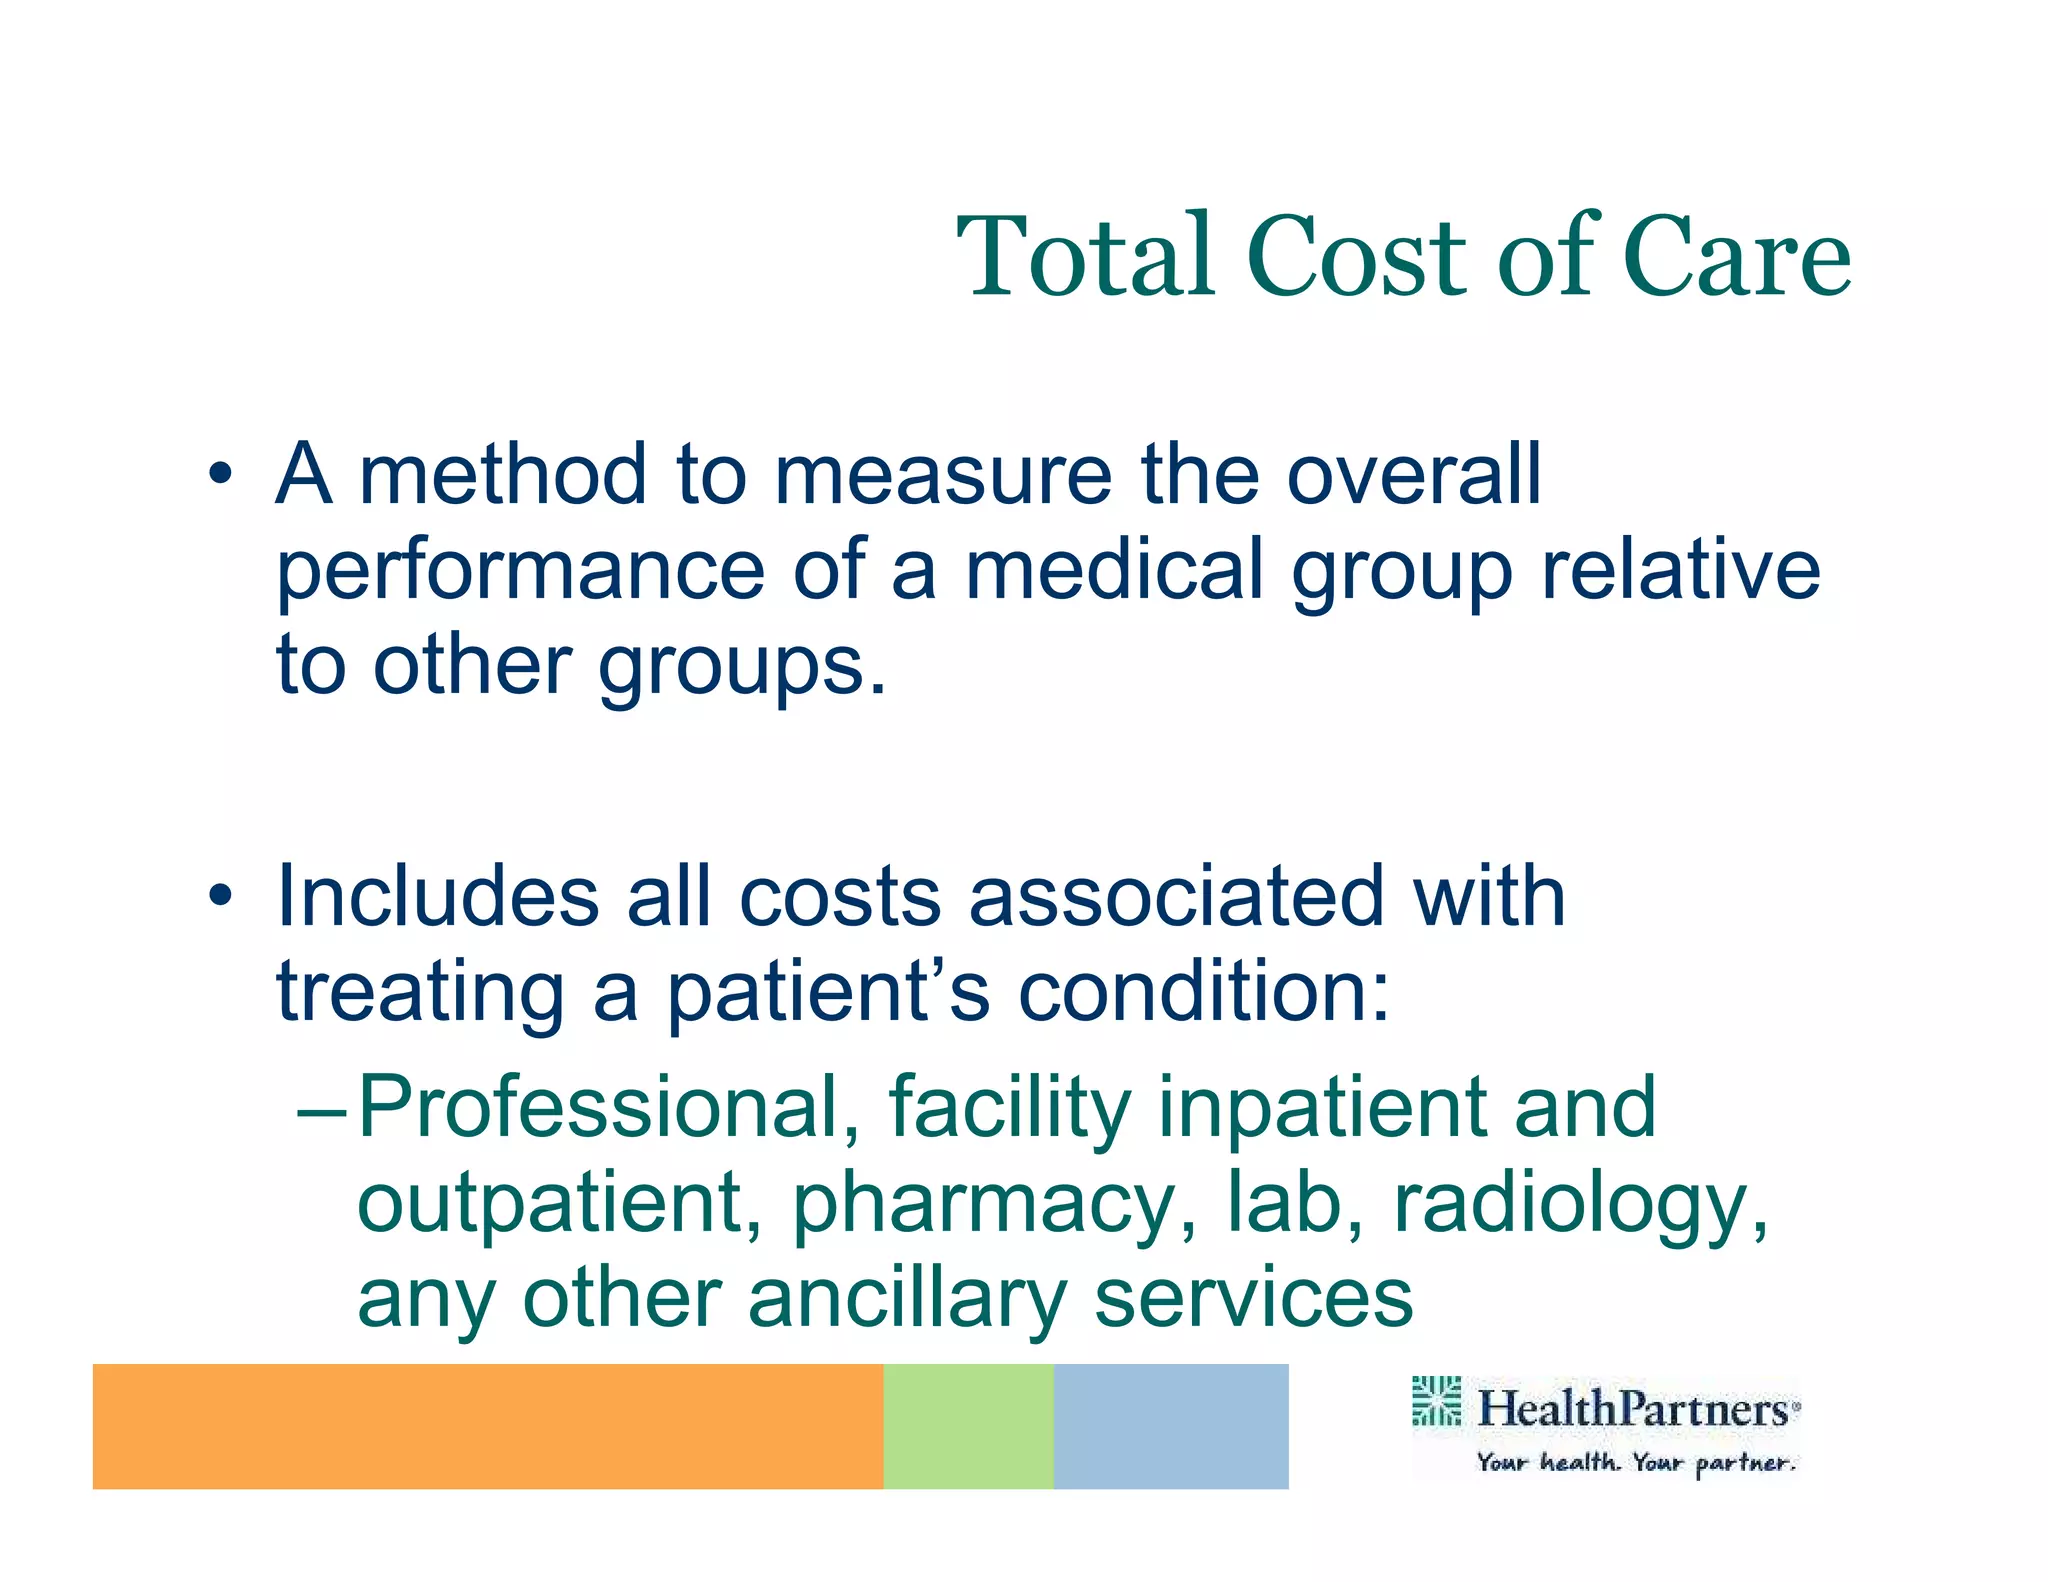
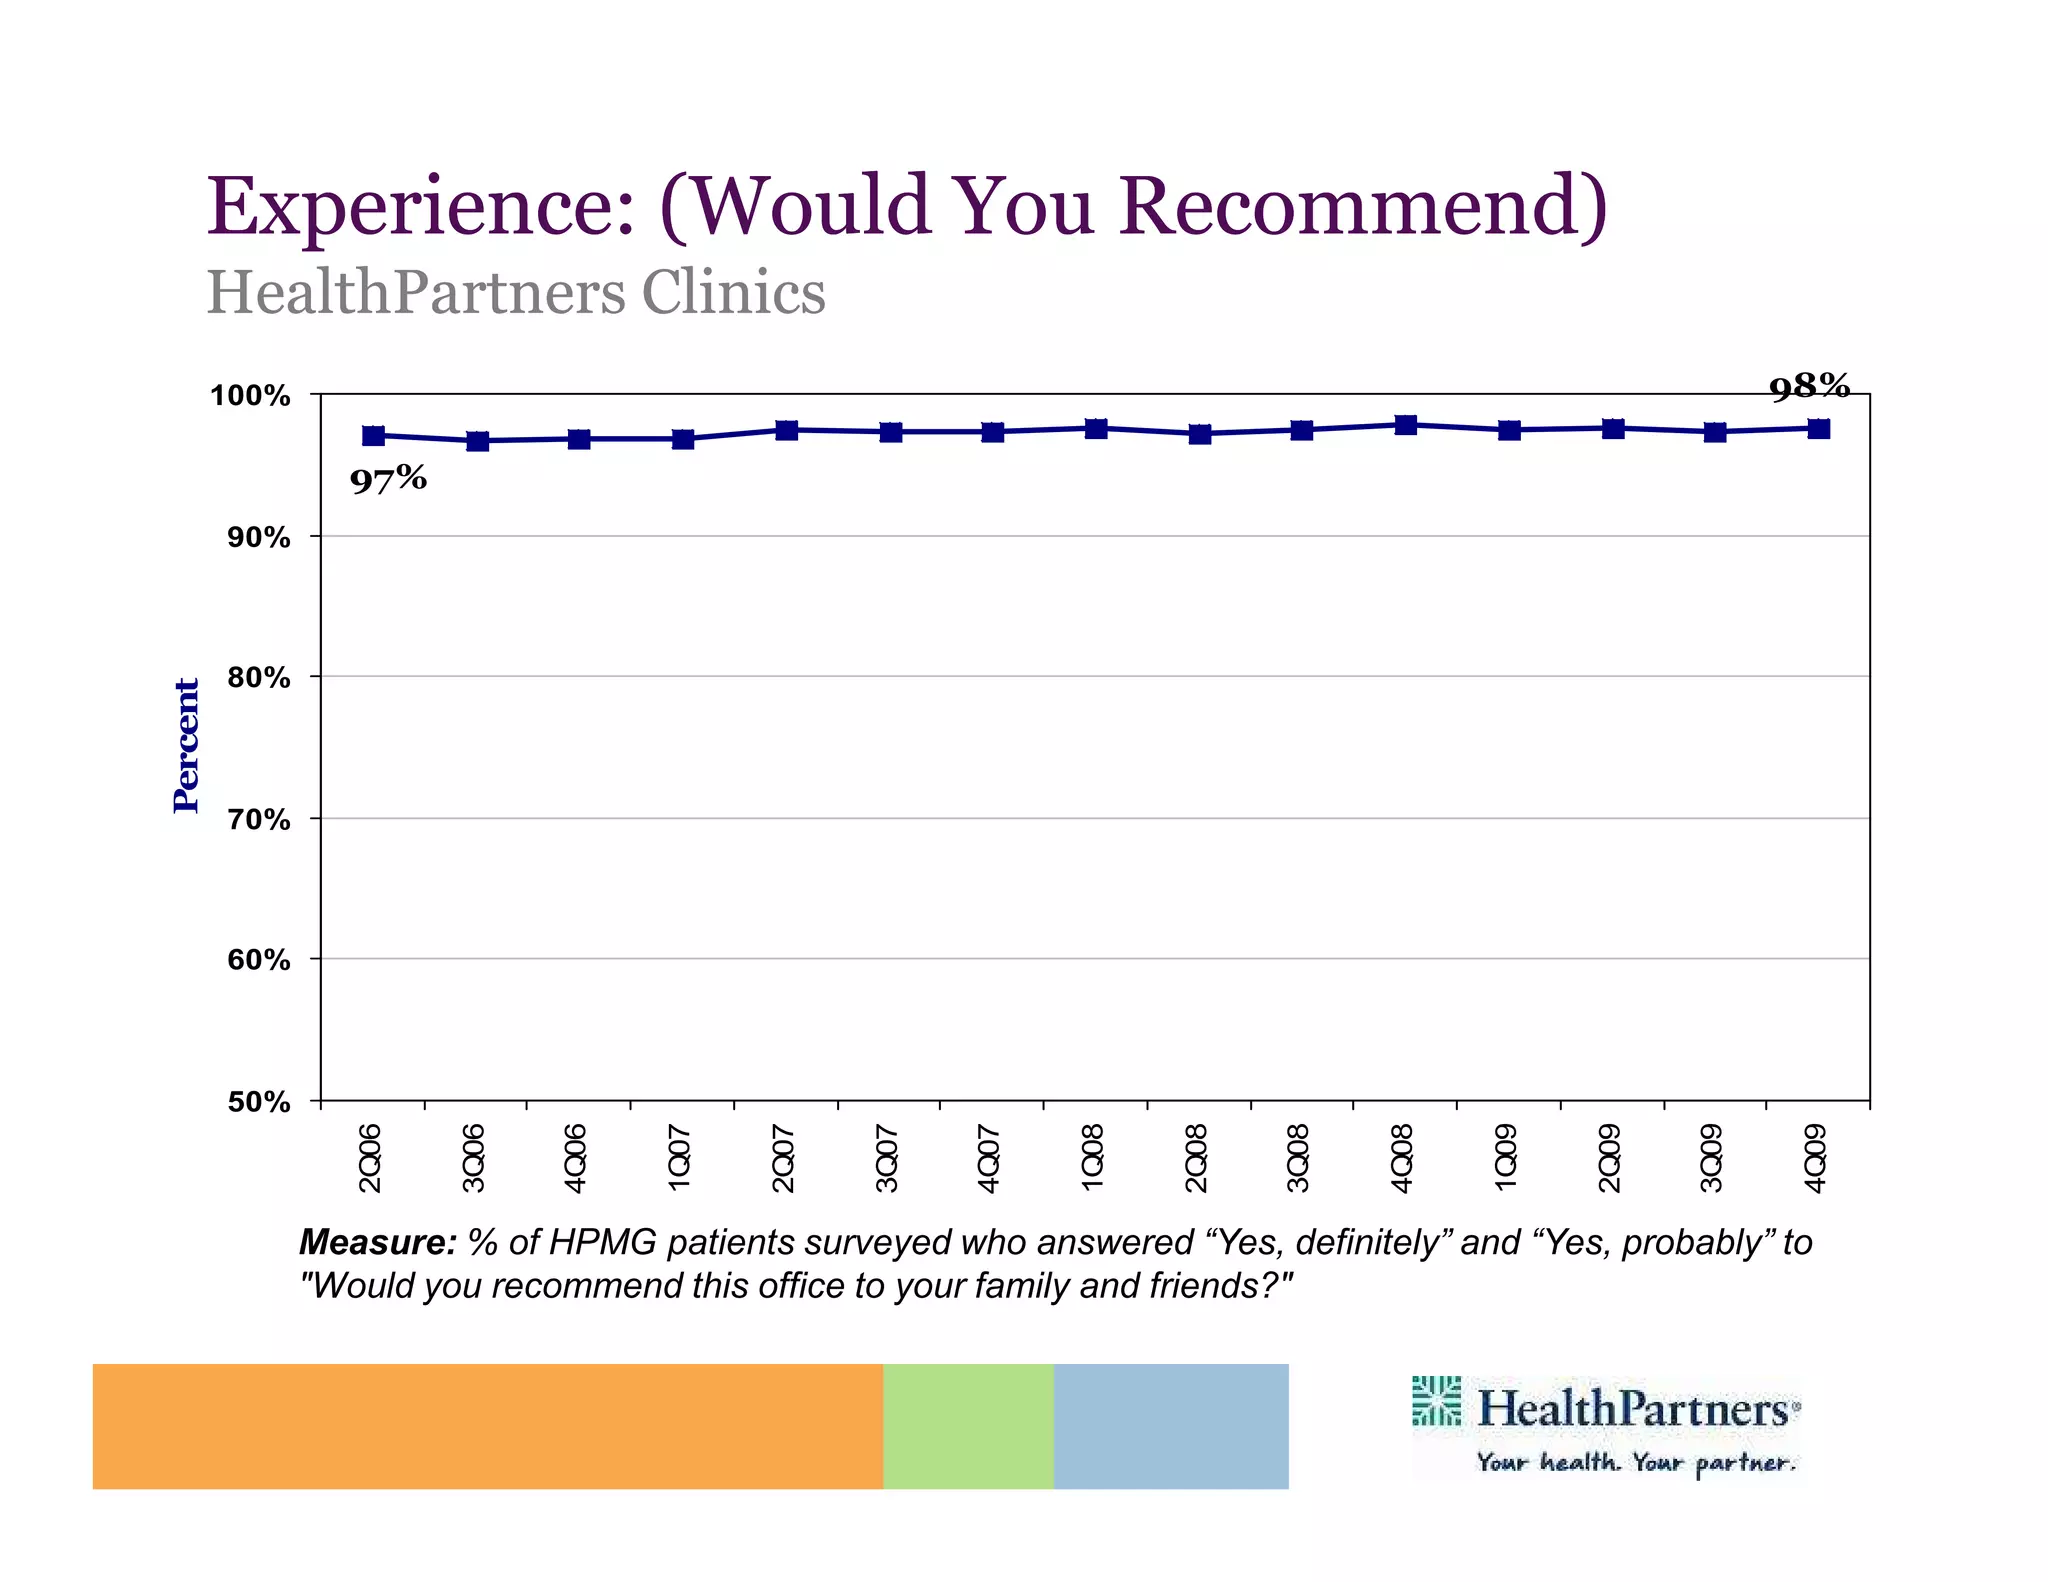
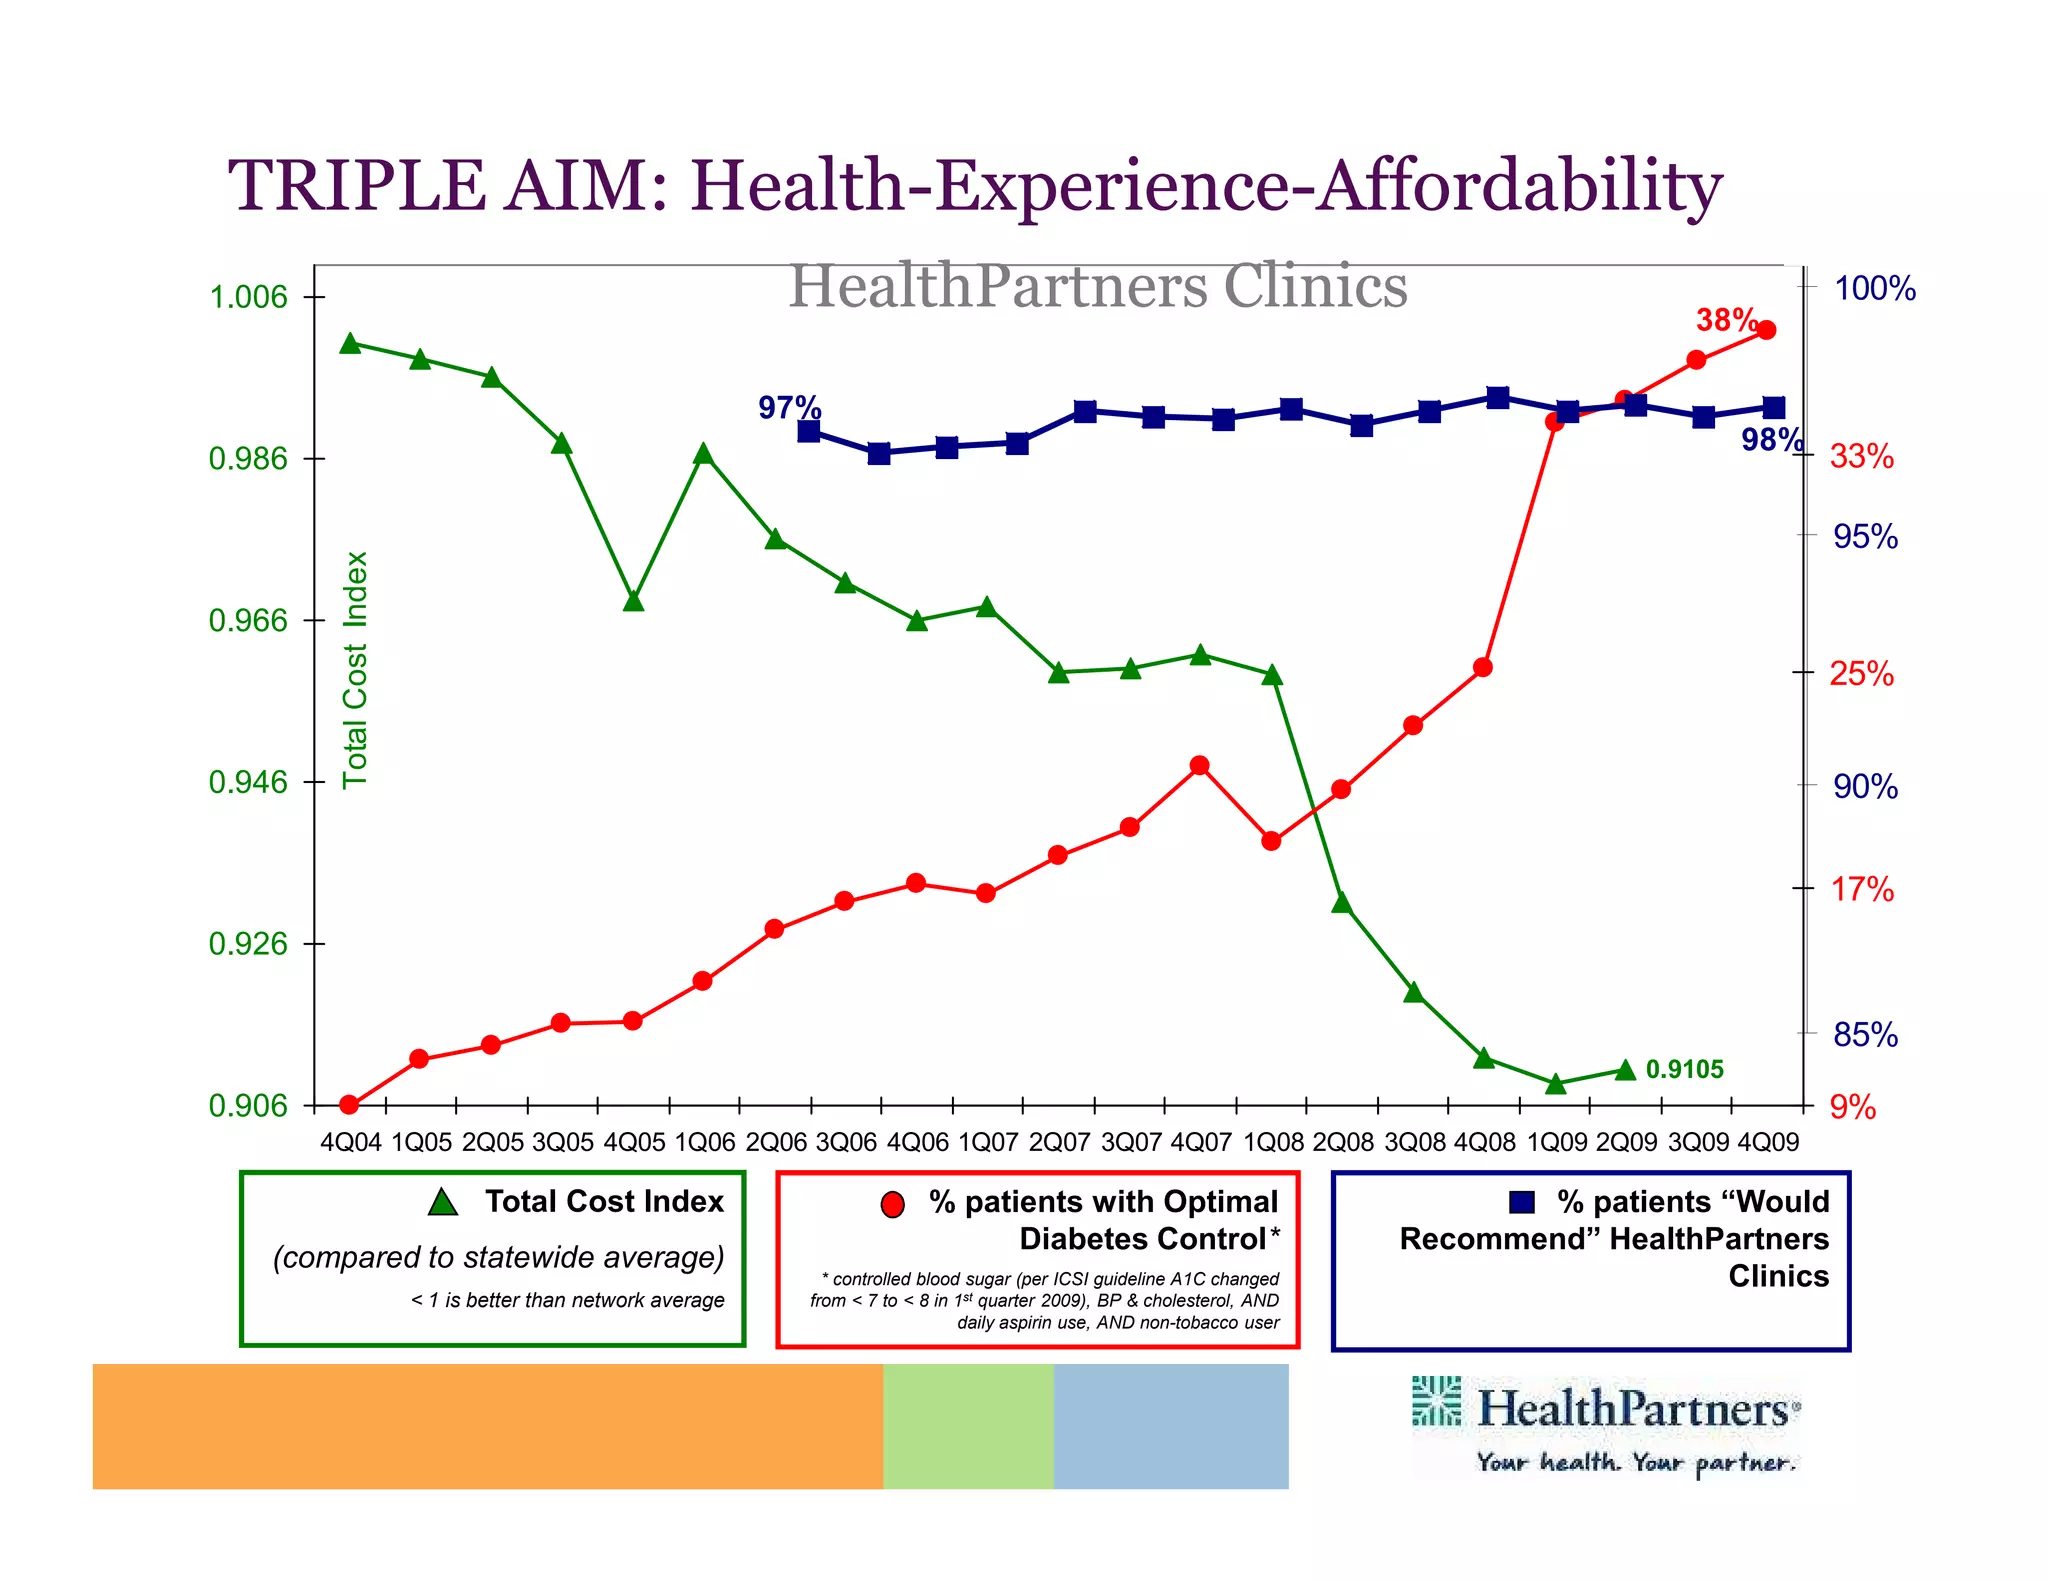
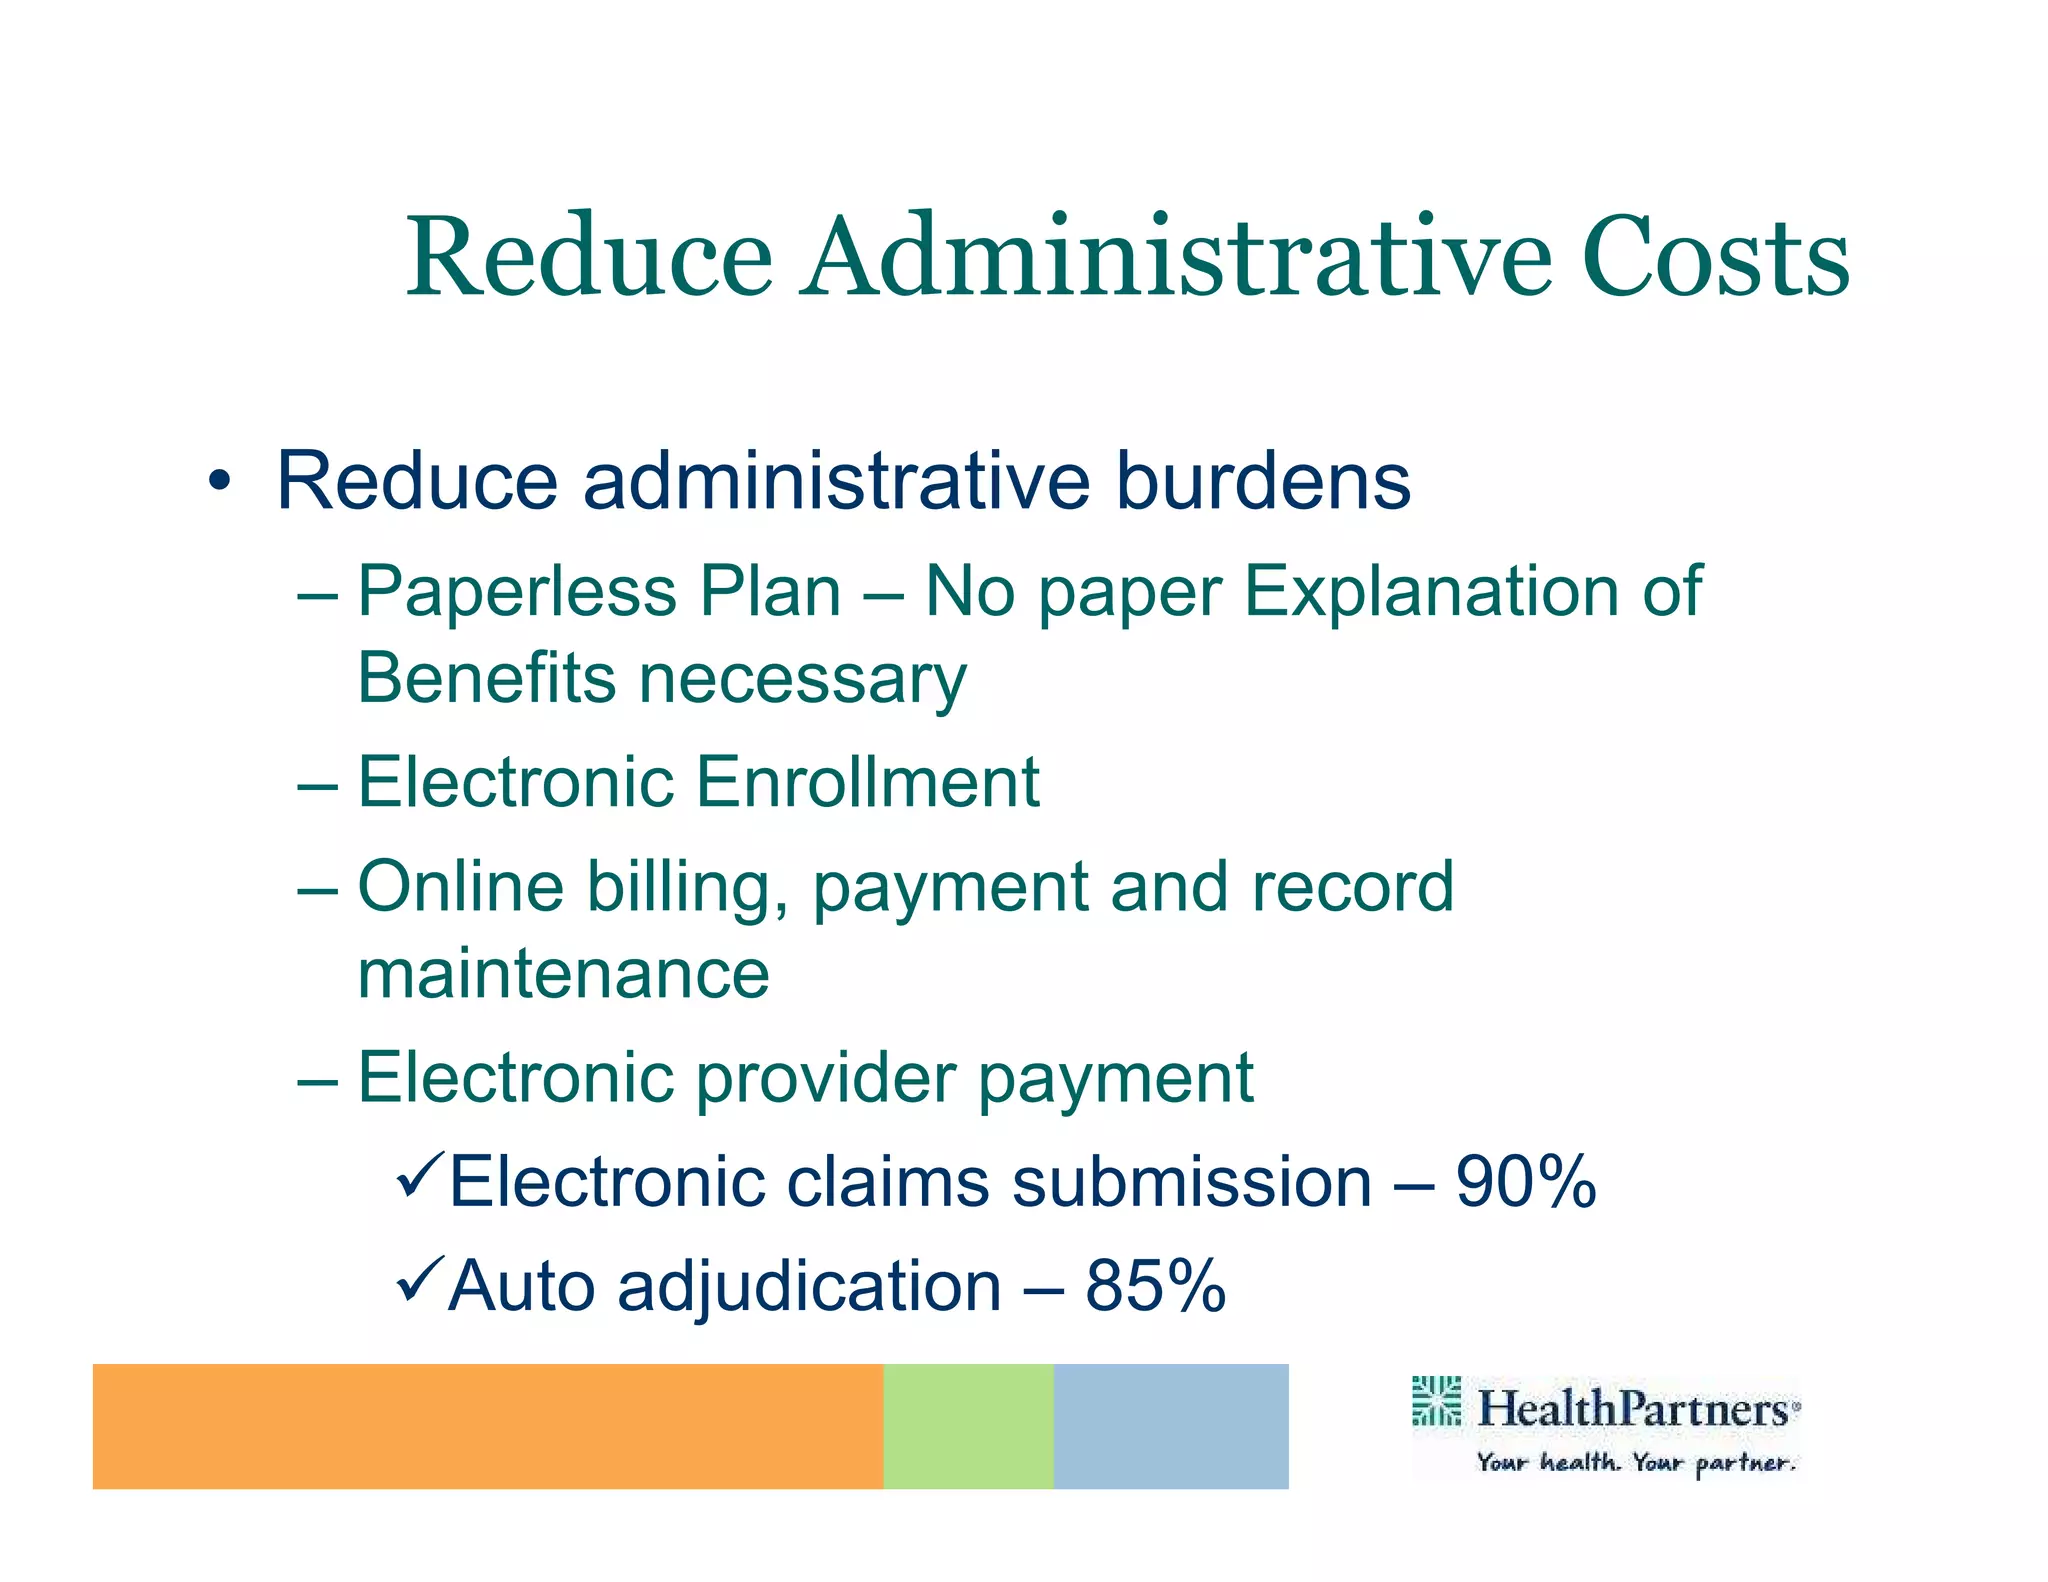
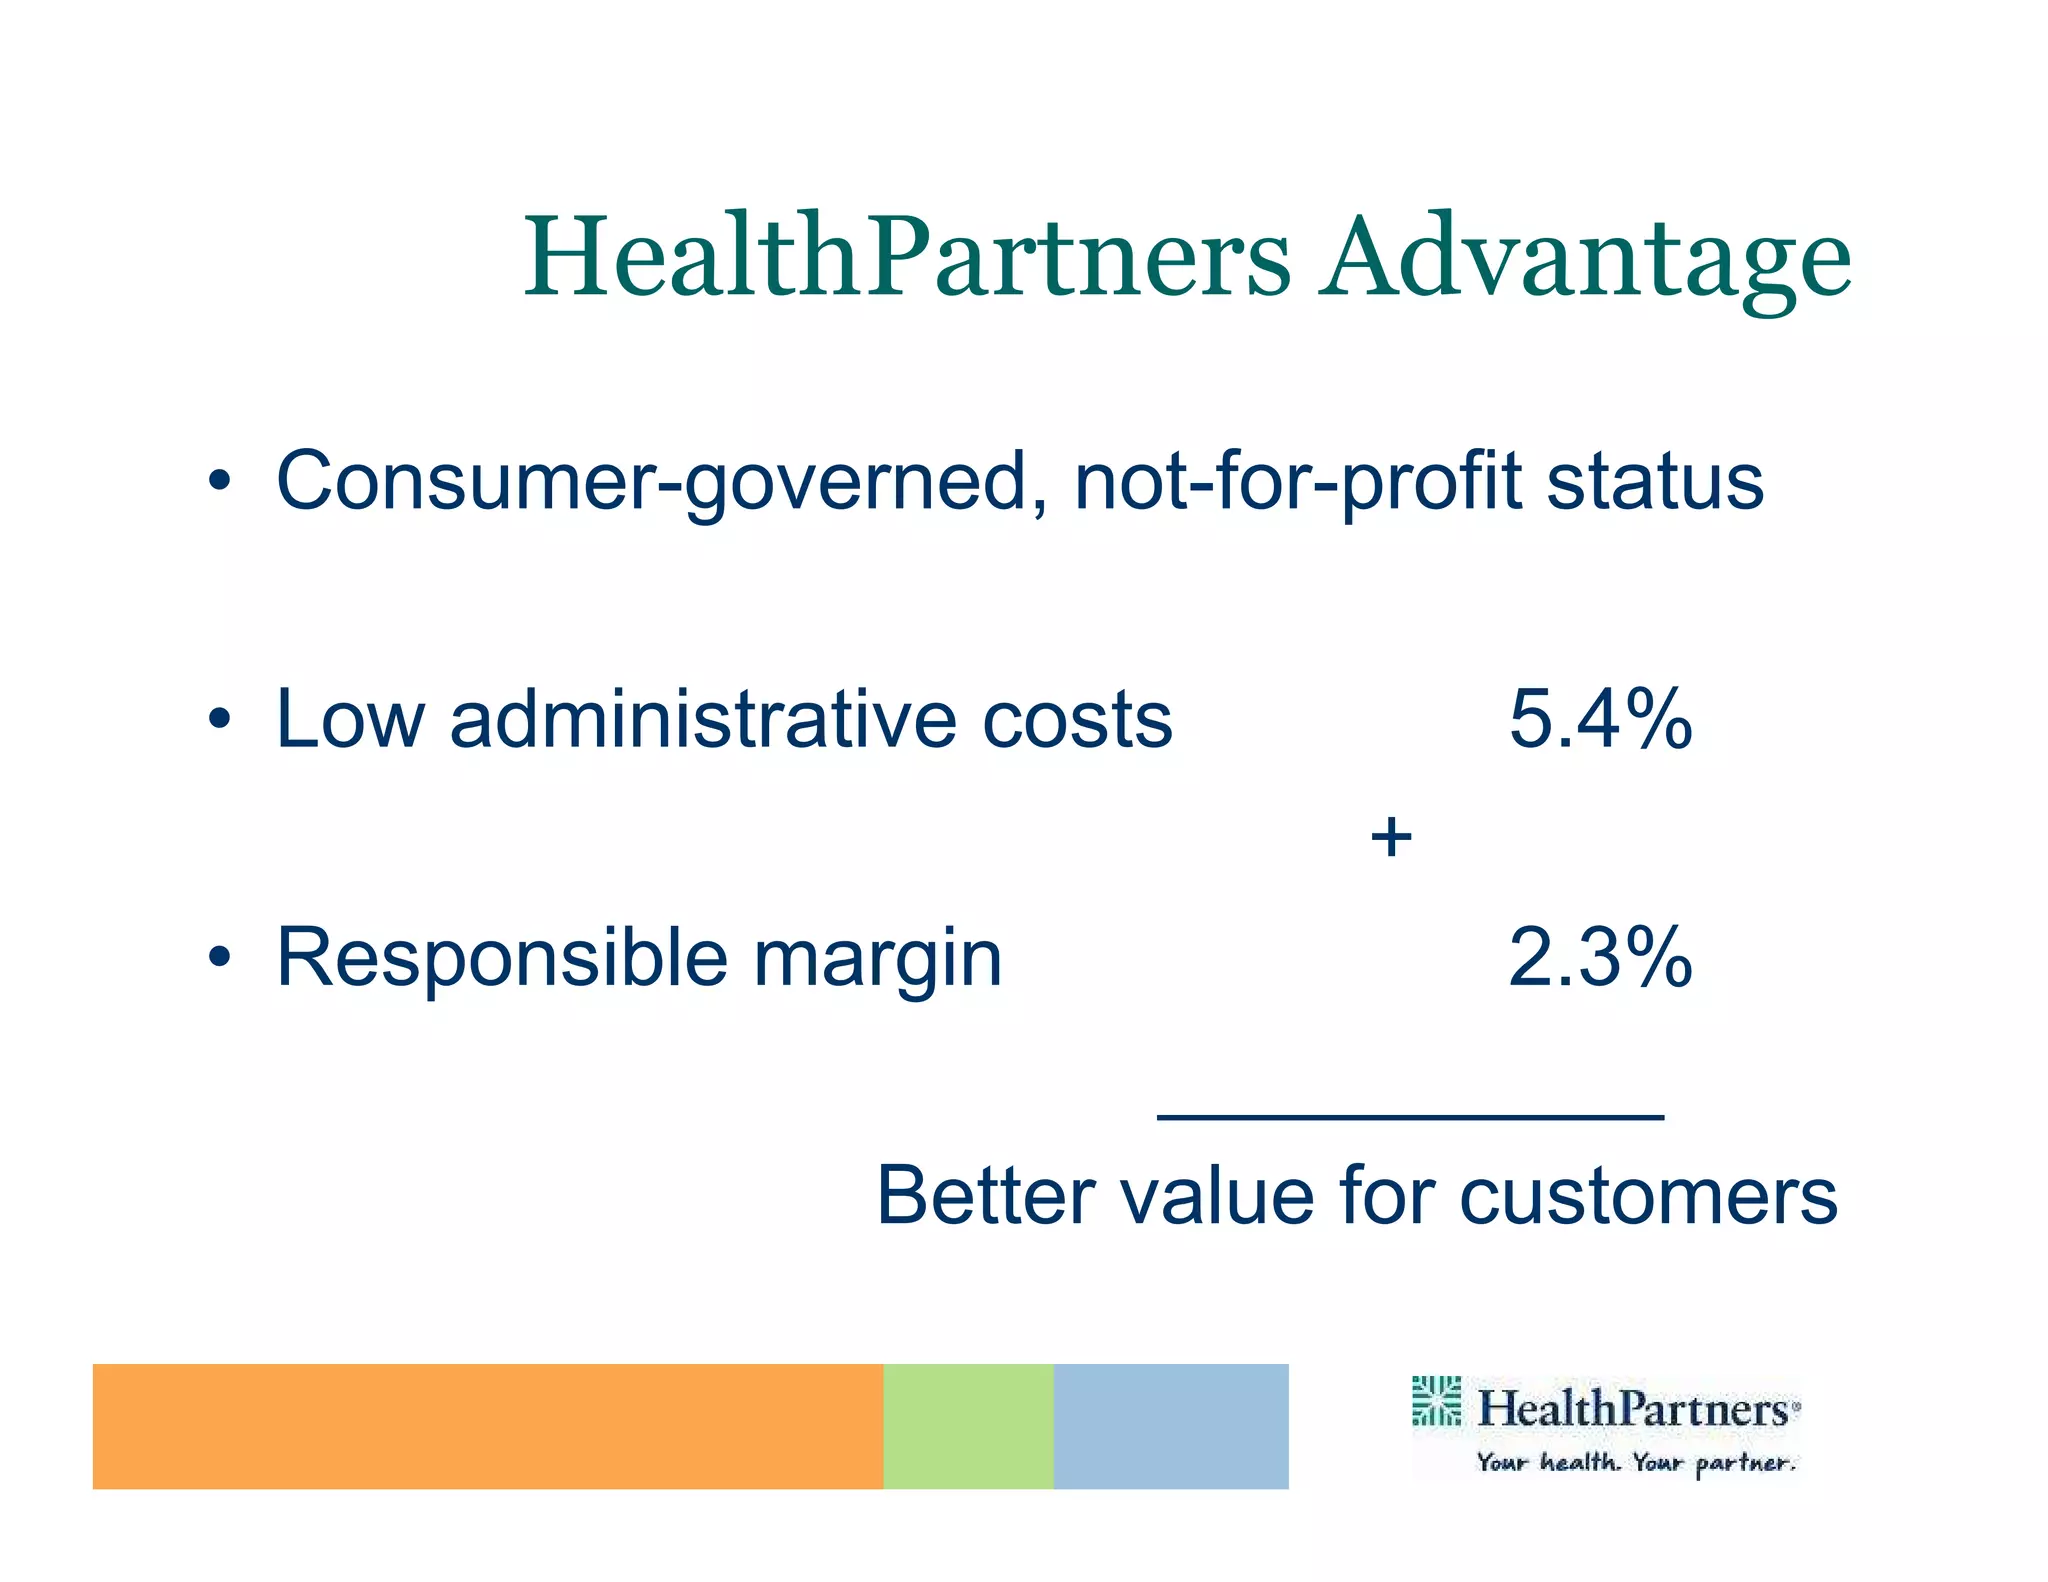
Minnesota High Tech Association
                   June 23, 2010
HealthPartners Mission

 To improve the health of
our members, patients and
      the community.


                              2
HealthPartners
• Consumer-governed, not-for-profit

• Health plans, medical group, hospitals

• Health and dental plans
  – 1.25 million members
HealthPartners Approach
                                  The Triple Aim
    To simultaneously optimize…
                       The Health of a defined population


    The Experience of the individual          Per capita Cost for the population

4
                                                              4
How are we organized?
                  Members / Patients / Community
                                                                            Contracted
    Health Plan             Care Delivery                Foundations        Networks

                       Medical & Dental Clinics                             - Medical
                       Pharmacies                                           - Specialty
                                                       Research
                                                                            - Hospital
  Medical              Hospitals                       Foundation           - Pharmacy
                        - Regions
  Dental                - Westfields                                        - Dental
                        - Hudson                       Institute for
  Pharmacy                                                                  Strategic
                                                       Medical Education    Partnerships
                       Home Care & Hospice
  Health               Riverway Clinics                (IME)
  Promotion            North Suburban Clinics                               - ICSI
                       N. St. Paul Transitional Care                        - MNHIE
                                                       Philanthropy
                       Central Minnesota                                    - MNCM
                       PNBC                                                 - Other WI
                                                                             partnerships

Administrative support such as: Legal, IS&T, Communications, HR & Finance
Health Care Reform
•   Coverage for 35-40 million more Americans
•   Insurance practices/requirement for coverage
•   Health care changes
•   $1 trillion price
•   Tax increases (50%)
•   Medicare cuts (50%)
Real Health Care Reform
•   Support healthy life choices
•   Coordinated care/focus on that triple aim!
•   Payment reform to support value
•   Use health information technology to improve
    results
•   Measure and publicly report quality and cost
•   Partner with consumers in making choices –
    health, care, cost, quality
•   Adopt innovate approaches that add value
•   Reduce administrative burden
Support Healthy Lifestyles
• Healthy living = longer life and better quality of
  life.

  Also, lower health care costs.

• Four lifestyle behaviors could impact 25% of
  health care costs:
   –   Healthy diet (5 servings fruits/vegetables/day)
   –   Regular exercise
   –   Not smoking
   –   Moderate alcohol use/avoiding risky use
Obesity Trends* Among U.S. Adults
                                                               BRFSS, 1985
                       (*BMI ≥30, or ~ 30 lbs. overweight for 5’ 4” person)


  No Data          <10%         10%–14%
Source: CDC Behavioral Risk Factor Surveillance System
Obesity Trends* Among U.S. Adults
                                                             BRFSS, 1986
                      (*BMI ≥30, or ~ 30 lbs. overweight for 5’ 4” person)


        No Data       <10%        10%–14%
No Data Behavioral Risk Factor Surveillance
Source: CDC <10%         10%–14%              System
Obesity Trends* Among U.S. Adults
                                                               BRFSS, 1987
                       (*BMI ≥30, or ~ 30 lbs. overweight for 5’ 4”
                       person)


No Data       <10%         10%–14%

Source: CDC Behavioral Risk Factor Surveillance System
Obesity Trends* Among U.S. Adults
                                                               BRFSS, 1988
                       (*BMI ≥30, or ~ 30 lbs. overweight for 5’ 4” person)


No Data        <10%         10%–14%

Source: CDC Behavioral Risk Factor Surveillance System
Obesity Trends* Among U.S. Adults
                                                             BRFSS, 1989
                      (*BMI ≥30, or ~ 30 lbs. overweight for 5’ 4” person)


No Data       10%       10%–14%

No Data Behavioral Risk Factor Surveillance
Source: CDC <10%         10%–14%              System
Obesity Trends* Among U.S. Adults
                                                               BRFSS, 1990
                       (*BMI ≥30, or ~ 30 lbs. overweight for 5’ 4” person)


No Data        <10%        10%–14%

Source: CDC Behavioral Risk Factor Surveillance System
Obesity Trends* Among U.S. Adults
                                                               BRFSS, 1991
                       (*BMI ≥30, or ~ 30 lbs. overweight for 5’ 4” person)


No Data         <10%        10%–14%        15%–19%

Source: CDC Behavioral Risk Factor Surveillance System
Obesity Trends* Among U.S. Adults
                                                               BRFSS, 1992
                       (*BMI ≥30, or ~ 30 lbs. overweight for 5’ 4” person)


No Data      <10%        10%–14%          15%–19%

Source: CDC Behavioral Risk Factor Surveillance System
Obesity Trends* Among U.S. Adults
                                                               BRFSS, 1993
                       (*BMI ≥30, or ~ 30 lbs. overweight for 5’ 4” person)


No Data      <10%        10%–14%         15%–19%

Source: CDC Behavioral Risk Factor Surveillance System
Obesity Trends* Among U.S. Adults
                                                               BRFSS, 1994
                       (*BMI ≥30, or ~ 30 lbs. overweight for 5’ 4” person)


No Data      <10%        10%–14%         15%–19%

Source: CDC Behavioral Risk Factor Surveillance System
Obesity Trends* Among U.S. Adults
                                                               BRFSS, 1995
                       (*BMI ≥30, or ~ 30 lbs. overweight for 5’ 4” person)


No Data        <10%       10%–14%         15%–19%

Source: CDC Behavioral Risk Factor Surveillance System
Obesity Trends* Among U.S. Adults
                                                               BRFSS, 1996
                       (*BMI ≥30, or ~ 30 lbs. overweight for 5’ 4” person)


No Data      <10%        10%–14%        15%–19%

Source: CDC Behavioral Risk Factor Surveillance System
Obesity Trends* Among U.S. Adults
                                                               BRFSS, 1997
                       (*BMI ≥30, or ~ 30 lbs. overweight for 5’ 4” person)


 No Data       <10%        10%–14%         15%–19%       ≥20%

Source: CDC Behavioral Risk Factor Surveillance System
Obesity Trends* Among U.S. Adults
                                                               BRFSS, 1998
                       (*BMI ≥30, or ~ 30 lbs. overweight for 5’ 4” person)


No Data      <10%        10%–14%        15%–19%          ≥20%


Source: CDC Behavioral Risk Factor Surveillance System
Obesity Trends* Among U.S. Adults
                                                               BRFSS, 1999
                       (*BMI ≥30, or ~ 30 lbs. overweight for 5’ 4” person)


No Data       <10%        10%–14%         15%–19%        ≥20%
Source: CDC Behavioral Risk Factor Surveillance System
Obesity Trends* Among U.S. Adults
                                                               BRFSS, 2000
                       (*BMI ≥30, or ~ 30 lbs. overweight for 5’ 4” person)


No Data       <10%        10%–14%         15%–19%        ≥20%

Source: CDC Behavioral Risk Factor Surveillance System
Obesity Trends* Among U.S. Adults
                                                               BRFSS, 2001
                       (*BMI ≥30, or ~ 30 lbs. overweight for 5’ 4” person)


No Data       <10%        10%–14%         15%–19%        20%–24%   ≥25%

Source: CDC Behavioral Risk Factor Surveillance System
Obesity Trends* Among U.S. Adults
                       BRFSS, 2002
                       (*BMI ≥30, or ~ 30 lbs. overweight for 5’ 4” person)


No Data        <10%       10%–14%         15%–19%        20%–24%   ≥25%

Source: CDC Behavioral Risk Factor Surveillance System
Obesity Trends* Among U.S. Adults
                                                               BRFSS, 2003
                       (*BMI ≥30, or ~ 30 lbs. overweight for 5’ 4” person)


 No Data        <10%        10%–14%         15%–19%      20%–24%   ≥25%

Source: CDC Behavioral Risk Factor Surveillance System
Obesity Trends* Among U.S. Adults
                                                               BRFSS, 2004
                       (*BMI ≥30, or ~ 30 lbs. overweight for 5’ 4” person)


No Data       <10%        10%–14%         15%–19%        20%–24%   ≥25%

Source: CDC Behavioral Risk Factor Surveillance System
Obesity Trends* Among U.S. Adults
                                                               BRFSS, 2005
                       (*BMI ≥30, or ~ 30 lbs. overweight for 5’ 4” person)


 No Data       <10%        10%–14%         15%–19%       20%–24%   25%–29%   ≥30%
Source: CDC Behavioral Risk Factor Surveillance System
Obesity Trends* Among U.S. Adults
                                                               BRFSS, 2006
                       (*BMI ≥30, or ~ 30 lbs. overweight for 5’ 4” person)


No Data      <10%        10%–14%        15%–19%          20%–24%   25%–29%   ≥30%

Source: CDC Behavioral Risk Factor Surveillance System
Obesity Trends* Among U.S. Adults
                                                               BRFSS, 2007
                       (*BMI ≥30, or ~ 30 lbs. overweight for 5’ 4” person)


 No Data       <10%       10%–14%          15%–19%       20%–24%   25%–29%   ≥30%

Source: CDC Behavioral Risk Factor Surveillance System
Obesity Trends* Among U.S. Adults
                                                               BRFSS, 2008
                       (*BMI ≥30, or ~ 30 lbs. overweight for 5’ 4” person)


 No Data       <10%        10%–14%         15%–19%       20%–24%   25%–29%   ≥30%
Source: CDC Behavioral Risk Factor Surveillance System
Adherence to Healthy Lifestyle
       Behaviors and New Disease
       Difference in 2-year incidence of new disease between people
           who adhere to 0 or 1 and 3 or 4 healthy behaviors (%)


      High Blood                                     Heart
       Pressure  Cholesterol   Cancer   Back Pain   Disease   Diabetes


         -15        -17
                               -24


                                          -43        -45

                                                                         Source:
                                                                         HealthPartners Health
                                                               -66       Assessment database, 2007

33
Change health care itself
Coordinated care/triple aim
          focus
•   Proactive
•   Prevention focused
•   Chronic illness care coordinated
•   Templates, tools and teams


                                       35
TRIPLE AIM: Health-Experience-Affordability
             Health-Experience-
                                                                                                                                                                  100%
1.006                                                              HealthPartners Clinics                                                             38%

                                                                 97%
                                                                                                                                                            98%
0.986                                                                                                                                                             33%
                                                                                                                                                                  95%
         Total Cost Index


0.966
                                                                                                                                                                  25%


0.946                                                                                                                                                             90%


                                                                                                                                                                  17%
0.926

                                                                                                                                                                  85%
                                                                                                                                                   0.9105
0.906                                                                                                                                                             9%
        4Q04 1Q05 2Q05 3Q05 4Q05 1Q06 2Q06 3Q06 4Q06 1Q07 2Q07 3Q07 4Q07 1Q08 2Q08 3Q08 4Q08 1Q09 2Q09 3Q09 4Q09

                                    Total Cost Index                                 % patients with Optimal                                % patients “Would
                                                                                           Diabetes Control*                         Recommend” HealthPartners
   (compared to statewide average)
                                                                         * controlled blood sugar (per ICSI guideline A1C changed                      Clinics
                            < 1 is better than network average         from < 7 to < 8 in 1st quarter 2009), BP & cholesterol, AND
                                                                                           daily aspirin use, AND non-tobacco user
Affordability: (Statewide)
                   Affordability:
                   HealthPartners Clinics
                   1.0100
                            1.00
                   1.0000

                   0.9900

                   0.9800
Total Cost Index


                   0.9700

                   0.9600

                   0.9500

                   0.9400

                   0.9300

                   0.9200
                                                                                                                                                            0.91
                   0.9100

                   0.9000
                            4Q04


                                   1Q05


                                            2Q05


                                                   3Q05


                                                          4Q05


                                                                 1Q06


                                                                        2Q06


                                                                               3Q06


                                                                                      4Q06


                                                                                             1Q07


                                                                                                    2Q07


                                                                                                           3Q07


                                                                                                                  4Q07


                                                                                                                         1Q08


                                                                                                                                2Q08


                                                                                                                                       3Q08


                                                                                                                                              4Q08


                                                                                                                                                     1Q09


                                                                                                                                                              2Q09
                                          Total Cost Index (compared to statewide average)
                                          < 1 is better than network average
Total Cost of Care
• A method to measure the overall
  performance of a medical group relative
  to other groups.

• Includes all costs associated with
  treating a patient’s condition:
   – Professional, facility inpatient and
     outpatient, pharmacy, lab, radiology,
     any other ancillary services
Health: (Optimal Diabetes Control- Total)
                                                 Control-
                       HealthPartners Clinics
                       40%
                                                                                                                                                                    38%

                       35%
Optimal Care Percent


                       30%


                       25%


                       20%


                       15%


                       10%

                             9%
                        5%
                             4Q04

                                    1Q05

                                           2Q05

                                                    3Q05

                                                           4Q05

                                                                  1Q06

                                                                         2Q06

                                                                                3Q06

                                                                                       4Q06

                                                                                              1Q07

                                                                                                     2Q07

                                                                                                            3Q07

                                                                                                                   4Q07

                                                                                                                          1Q08

                                                                                                                                 2Q08

                                                                                                                                        3Q08

                                                                                                                                               4Q08

                                                                                                                                                      1Q09

                                                                                                                                                             2Q09

                                                                                                                                                                    3Q09

                                                                                                                                                                           4Q09
                                                  % Patients with Optimal Diabetes Control* *controlled blood sugar, BP &
                                              cholesterol (per ICSI guidelines A1C changed from < 7 to < 8 in 1st quarter 2009)daily
                                              aspirin use AND non-tobacco user
Saves 364 Hearts, 68 Legs &
 625 Pairs of Eyes Each Year
Experience: (Would You Recommend)
          HealthPartners Clinics
          100%                                                                                                        98%

                    97%
          90%


          80%
Percent


          70%


          60%


          50%
                    2Q06


                           3Q06


                                  4Q06


                                         1Q07


                                                2Q07


                                                       3Q07


                                                              4Q07


                                                                     1Q08


                                                                            2Q08


                                                                                   3Q08


                                                                                          4Q08


                                                                                                 1Q09


                                                                                                        2Q09


                                                                                                               3Q09


                                                                                                                       4Q09
                 Measure: % of HPMG patients surveyed who answered “Yes, definitely” and “Yes, probably” to
                 "Would you recommend this office to your family and friends?"
TRIPLE AIM: Health-Experience-Affordability
             Health-Experience-
1.006                                                             HealthPartners Clinics                                                          38%
                                                                                                                                                              100%


                                                                 97%
                                                                                                                                                        98%
0.986                                                                                                                                                         33%

                                                                                                                                                              95%
         Total Cost Index


0.966
                                                                                                                                                              25%


0.946                                                                                                                                                         90%


                                                                                                                                                              17%
0.926

                                                                                                                                                              85%
                                                                                                                                               0.9105
0.906                                                                                                                                                         9%
        4Q04 1Q05 2Q05 3Q05 4Q05 1Q06 2Q06 3Q06 4Q06 1Q07 2Q07 3Q07 4Q07 1Q08 2Q08 3Q08 4Q08 1Q09 2Q09 3Q09 4Q09

                                    Total Cost Index                             % patients with Optimal                                % patients “Would
                                                                                       Diabetes Control*                         Recommend” HealthPartners
   (compared to statewide average)
                                                                     * controlled blood sugar (per ICSI guideline A1C changed                      Clinics
                            < 1 is better than network average     from < 7 to < 8 in 1st quarter 2009), BP & cholesterol, AND
                                                                                       daily aspirin use, AND non-tobacco user
Payment Reform to Support
                             Value
•    Take the emphasis off fee-for-service
•    Pay for value (triple aim)
•    Move to Total Cost of Care approaches
•    Re-evaluate fee-for-service weights and
     payment levels


43
Leveraging Technology
• Use the electronic medical record to
  improve care
        Disparities Initiative
        H1N1 Outreach
• Online patient services: 221,000 patients
  (10.5 millions test results)
• m.HealthPartners.com (already 10,000 per
  month)

                                              44
Partner with Consumers
• Decision support – better information
  about care choices
• Measure and publicly report quality and
  cost
   – Minnesota Community Measurement
   – www.HealthPartners.com: Cost
     Comparison Tools
• Support healthy choices
Reduce Administrative Costs
• Reduce administrative burdens
  – Paperless Plan – No paper Explanation of
    Benefits necessary
  – Electronic Enrollment
  – Online billing, payment and record
    maintenance
  – Electronic provider payment
       Electronic claims submission – 90%
       Auto adjudication – 85%
HealthPartners Advantage
• Consumer-governed, not-for-profit status

• Low administrative costs         5.4%
                               +
• Responsible margin                2.3%
                          ___________
                  Better value for customers
Real Health Care Reform

We’ll advocate for it.
We’ll be an example of it

Mary Brainerd, President & CEO of HealthPartners @ Minnesota High Tech Association (MHTA) CEO Briefing

  • 1.
    Minnesota High TechAssociation June 23, 2010
  • 2.
    HealthPartners Mission Toimprove the health of our members, patients and the community. 2
  • 3.
    HealthPartners • Consumer-governed, not-for-profit •Health plans, medical group, hospitals • Health and dental plans – 1.25 million members
  • 4.
    HealthPartners Approach The Triple Aim To simultaneously optimize… The Health of a defined population The Experience of the individual Per capita Cost for the population 4 4
  • 5.
    How are weorganized? Members / Patients / Community Contracted Health Plan Care Delivery Foundations Networks Medical & Dental Clinics - Medical Pharmacies - Specialty Research - Hospital Medical Hospitals Foundation - Pharmacy - Regions Dental - Westfields - Dental - Hudson Institute for Pharmacy Strategic Medical Education Partnerships Home Care & Hospice Health Riverway Clinics (IME) Promotion North Suburban Clinics - ICSI N. St. Paul Transitional Care - MNHIE Philanthropy Central Minnesota - MNCM PNBC - Other WI partnerships Administrative support such as: Legal, IS&T, Communications, HR & Finance
  • 6.
    Health Care Reform • Coverage for 35-40 million more Americans • Insurance practices/requirement for coverage • Health care changes • $1 trillion price • Tax increases (50%) • Medicare cuts (50%)
  • 7.
    Real Health CareReform • Support healthy life choices • Coordinated care/focus on that triple aim! • Payment reform to support value • Use health information technology to improve results • Measure and publicly report quality and cost • Partner with consumers in making choices – health, care, cost, quality • Adopt innovate approaches that add value • Reduce administrative burden
  • 8.
    Support Healthy Lifestyles •Healthy living = longer life and better quality of life. Also, lower health care costs. • Four lifestyle behaviors could impact 25% of health care costs: – Healthy diet (5 servings fruits/vegetables/day) – Regular exercise – Not smoking – Moderate alcohol use/avoiding risky use
  • 9.
    Obesity Trends* AmongU.S. Adults BRFSS, 1985 (*BMI ≥30, or ~ 30 lbs. overweight for 5’ 4” person) No Data <10% 10%–14% Source: CDC Behavioral Risk Factor Surveillance System
  • 10.
    Obesity Trends* AmongU.S. Adults BRFSS, 1986 (*BMI ≥30, or ~ 30 lbs. overweight for 5’ 4” person) No Data <10% 10%–14% No Data Behavioral Risk Factor Surveillance Source: CDC <10% 10%–14% System
  • 11.
    Obesity Trends* AmongU.S. Adults BRFSS, 1987 (*BMI ≥30, or ~ 30 lbs. overweight for 5’ 4” person) No Data <10% 10%–14% Source: CDC Behavioral Risk Factor Surveillance System
  • 12.
    Obesity Trends* AmongU.S. Adults BRFSS, 1988 (*BMI ≥30, or ~ 30 lbs. overweight for 5’ 4” person) No Data <10% 10%–14% Source: CDC Behavioral Risk Factor Surveillance System
  • 13.
    Obesity Trends* AmongU.S. Adults BRFSS, 1989 (*BMI ≥30, or ~ 30 lbs. overweight for 5’ 4” person) No Data 10% 10%–14% No Data Behavioral Risk Factor Surveillance Source: CDC <10% 10%–14% System
  • 14.
    Obesity Trends* AmongU.S. Adults BRFSS, 1990 (*BMI ≥30, or ~ 30 lbs. overweight for 5’ 4” person) No Data <10% 10%–14% Source: CDC Behavioral Risk Factor Surveillance System
  • 15.
    Obesity Trends* AmongU.S. Adults BRFSS, 1991 (*BMI ≥30, or ~ 30 lbs. overweight for 5’ 4” person) No Data <10% 10%–14% 15%–19% Source: CDC Behavioral Risk Factor Surveillance System
  • 16.
    Obesity Trends* AmongU.S. Adults BRFSS, 1992 (*BMI ≥30, or ~ 30 lbs. overweight for 5’ 4” person) No Data <10% 10%–14% 15%–19% Source: CDC Behavioral Risk Factor Surveillance System
  • 17.
    Obesity Trends* AmongU.S. Adults BRFSS, 1993 (*BMI ≥30, or ~ 30 lbs. overweight for 5’ 4” person) No Data <10% 10%–14% 15%–19% Source: CDC Behavioral Risk Factor Surveillance System
  • 18.
    Obesity Trends* AmongU.S. Adults BRFSS, 1994 (*BMI ≥30, or ~ 30 lbs. overweight for 5’ 4” person) No Data <10% 10%–14% 15%–19% Source: CDC Behavioral Risk Factor Surveillance System
  • 19.
    Obesity Trends* AmongU.S. Adults BRFSS, 1995 (*BMI ≥30, or ~ 30 lbs. overweight for 5’ 4” person) No Data <10% 10%–14% 15%–19% Source: CDC Behavioral Risk Factor Surveillance System
  • 20.
    Obesity Trends* AmongU.S. Adults BRFSS, 1996 (*BMI ≥30, or ~ 30 lbs. overweight for 5’ 4” person) No Data <10% 10%–14% 15%–19% Source: CDC Behavioral Risk Factor Surveillance System
  • 21.
    Obesity Trends* AmongU.S. Adults BRFSS, 1997 (*BMI ≥30, or ~ 30 lbs. overweight for 5’ 4” person) No Data <10% 10%–14% 15%–19% ≥20% Source: CDC Behavioral Risk Factor Surveillance System
  • 22.
    Obesity Trends* AmongU.S. Adults BRFSS, 1998 (*BMI ≥30, or ~ 30 lbs. overweight for 5’ 4” person) No Data <10% 10%–14% 15%–19% ≥20% Source: CDC Behavioral Risk Factor Surveillance System
  • 23.
    Obesity Trends* AmongU.S. Adults BRFSS, 1999 (*BMI ≥30, or ~ 30 lbs. overweight for 5’ 4” person) No Data <10% 10%–14% 15%–19% ≥20% Source: CDC Behavioral Risk Factor Surveillance System
  • 24.
    Obesity Trends* AmongU.S. Adults BRFSS, 2000 (*BMI ≥30, or ~ 30 lbs. overweight for 5’ 4” person) No Data <10% 10%–14% 15%–19% ≥20% Source: CDC Behavioral Risk Factor Surveillance System
  • 25.
    Obesity Trends* AmongU.S. Adults BRFSS, 2001 (*BMI ≥30, or ~ 30 lbs. overweight for 5’ 4” person) No Data <10% 10%–14% 15%–19% 20%–24% ≥25% Source: CDC Behavioral Risk Factor Surveillance System
  • 26.
    Obesity Trends* AmongU.S. Adults BRFSS, 2002 (*BMI ≥30, or ~ 30 lbs. overweight for 5’ 4” person) No Data <10% 10%–14% 15%–19% 20%–24% ≥25% Source: CDC Behavioral Risk Factor Surveillance System
  • 27.
    Obesity Trends* AmongU.S. Adults BRFSS, 2003 (*BMI ≥30, or ~ 30 lbs. overweight for 5’ 4” person) No Data <10% 10%–14% 15%–19% 20%–24% ≥25% Source: CDC Behavioral Risk Factor Surveillance System
  • 28.
    Obesity Trends* AmongU.S. Adults BRFSS, 2004 (*BMI ≥30, or ~ 30 lbs. overweight for 5’ 4” person) No Data <10% 10%–14% 15%–19% 20%–24% ≥25% Source: CDC Behavioral Risk Factor Surveillance System
  • 29.
    Obesity Trends* AmongU.S. Adults BRFSS, 2005 (*BMI ≥30, or ~ 30 lbs. overweight for 5’ 4” person) No Data <10% 10%–14% 15%–19% 20%–24% 25%–29% ≥30% Source: CDC Behavioral Risk Factor Surveillance System
  • 30.
    Obesity Trends* AmongU.S. Adults BRFSS, 2006 (*BMI ≥30, or ~ 30 lbs. overweight for 5’ 4” person) No Data <10% 10%–14% 15%–19% 20%–24% 25%–29% ≥30% Source: CDC Behavioral Risk Factor Surveillance System
  • 31.
    Obesity Trends* AmongU.S. Adults BRFSS, 2007 (*BMI ≥30, or ~ 30 lbs. overweight for 5’ 4” person) No Data <10% 10%–14% 15%–19% 20%–24% 25%–29% ≥30% Source: CDC Behavioral Risk Factor Surveillance System
  • 32.
    Obesity Trends* AmongU.S. Adults BRFSS, 2008 (*BMI ≥30, or ~ 30 lbs. overweight for 5’ 4” person) No Data <10% 10%–14% 15%–19% 20%–24% 25%–29% ≥30% Source: CDC Behavioral Risk Factor Surveillance System
  • 33.
    Adherence to HealthyLifestyle Behaviors and New Disease Difference in 2-year incidence of new disease between people who adhere to 0 or 1 and 3 or 4 healthy behaviors (%) High Blood Heart Pressure Cholesterol Cancer Back Pain Disease Diabetes -15 -17 -24 -43 -45 Source: HealthPartners Health -66 Assessment database, 2007 33
  • 34.
    Change health careitself Coordinated care/triple aim focus
  • 35.
    Proactive • Prevention focused • Chronic illness care coordinated • Templates, tools and teams 35
  • 36.
    TRIPLE AIM: Health-Experience-Affordability Health-Experience- 100% 1.006 HealthPartners Clinics 38% 97% 98% 0.986 33% 95% Total Cost Index 0.966 25% 0.946 90% 17% 0.926 85% 0.9105 0.906 9% 4Q04 1Q05 2Q05 3Q05 4Q05 1Q06 2Q06 3Q06 4Q06 1Q07 2Q07 3Q07 4Q07 1Q08 2Q08 3Q08 4Q08 1Q09 2Q09 3Q09 4Q09 Total Cost Index % patients with Optimal % patients “Would Diabetes Control* Recommend” HealthPartners (compared to statewide average) * controlled blood sugar (per ICSI guideline A1C changed Clinics < 1 is better than network average from < 7 to < 8 in 1st quarter 2009), BP & cholesterol, AND daily aspirin use, AND non-tobacco user
  • 37.
    Affordability: (Statewide) Affordability: HealthPartners Clinics 1.0100 1.00 1.0000 0.9900 0.9800 Total Cost Index 0.9700 0.9600 0.9500 0.9400 0.9300 0.9200 0.91 0.9100 0.9000 4Q04 1Q05 2Q05 3Q05 4Q05 1Q06 2Q06 3Q06 4Q06 1Q07 2Q07 3Q07 4Q07 1Q08 2Q08 3Q08 4Q08 1Q09 2Q09 Total Cost Index (compared to statewide average) < 1 is better than network average
  • 38.
    Total Cost ofCare • A method to measure the overall performance of a medical group relative to other groups. • Includes all costs associated with treating a patient’s condition: – Professional, facility inpatient and outpatient, pharmacy, lab, radiology, any other ancillary services
  • 39.
    Health: (Optimal DiabetesControl- Total) Control- HealthPartners Clinics 40% 38% 35% Optimal Care Percent 30% 25% 20% 15% 10% 9% 5% 4Q04 1Q05 2Q05 3Q05 4Q05 1Q06 2Q06 3Q06 4Q06 1Q07 2Q07 3Q07 4Q07 1Q08 2Q08 3Q08 4Q08 1Q09 2Q09 3Q09 4Q09 % Patients with Optimal Diabetes Control* *controlled blood sugar, BP & cholesterol (per ICSI guidelines A1C changed from < 7 to < 8 in 1st quarter 2009)daily aspirin use AND non-tobacco user
  • 40.
    Saves 364 Hearts,68 Legs & 625 Pairs of Eyes Each Year
  • 41.
    Experience: (Would YouRecommend) HealthPartners Clinics 100% 98% 97% 90% 80% Percent 70% 60% 50% 2Q06 3Q06 4Q06 1Q07 2Q07 3Q07 4Q07 1Q08 2Q08 3Q08 4Q08 1Q09 2Q09 3Q09 4Q09 Measure: % of HPMG patients surveyed who answered “Yes, definitely” and “Yes, probably” to "Would you recommend this office to your family and friends?"
  • 42.
    TRIPLE AIM: Health-Experience-Affordability Health-Experience- 1.006 HealthPartners Clinics 38% 100% 97% 98% 0.986 33% 95% Total Cost Index 0.966 25% 0.946 90% 17% 0.926 85% 0.9105 0.906 9% 4Q04 1Q05 2Q05 3Q05 4Q05 1Q06 2Q06 3Q06 4Q06 1Q07 2Q07 3Q07 4Q07 1Q08 2Q08 3Q08 4Q08 1Q09 2Q09 3Q09 4Q09 Total Cost Index % patients with Optimal % patients “Would Diabetes Control* Recommend” HealthPartners (compared to statewide average) * controlled blood sugar (per ICSI guideline A1C changed Clinics < 1 is better than network average from < 7 to < 8 in 1st quarter 2009), BP & cholesterol, AND daily aspirin use, AND non-tobacco user
  • 43.
    Payment Reform toSupport Value • Take the emphasis off fee-for-service • Pay for value (triple aim) • Move to Total Cost of Care approaches • Re-evaluate fee-for-service weights and payment levels 43
  • 44.
    Leveraging Technology • Usethe electronic medical record to improve care Disparities Initiative H1N1 Outreach • Online patient services: 221,000 patients (10.5 millions test results) • m.HealthPartners.com (already 10,000 per month) 44
  • 45.
    Partner with Consumers •Decision support – better information about care choices • Measure and publicly report quality and cost – Minnesota Community Measurement – www.HealthPartners.com: Cost Comparison Tools • Support healthy choices
  • 46.
    Reduce Administrative Costs •Reduce administrative burdens – Paperless Plan – No paper Explanation of Benefits necessary – Electronic Enrollment – Online billing, payment and record maintenance – Electronic provider payment Electronic claims submission – 90% Auto adjudication – 85%
  • 47.
    HealthPartners Advantage • Consumer-governed,not-for-profit status • Low administrative costs 5.4% + • Responsible margin 2.3% ___________ Better value for customers
  • 48.
    Real Health CareReform We’ll advocate for it. We’ll be an example of it