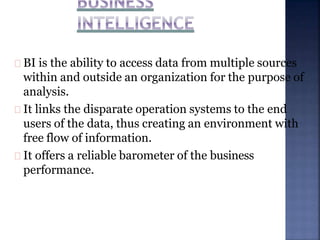
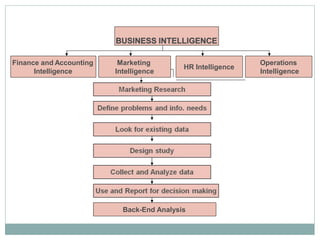
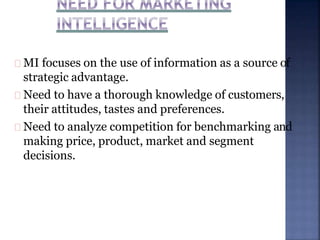
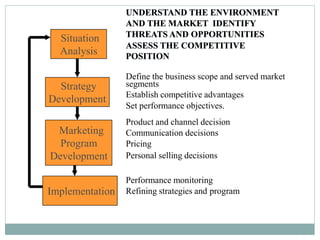
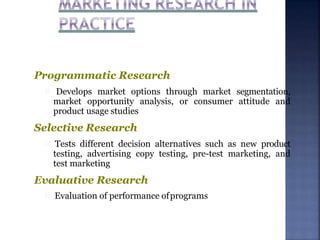
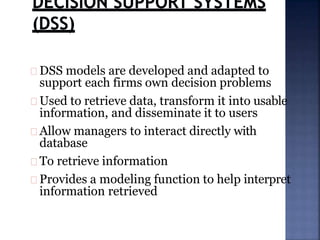
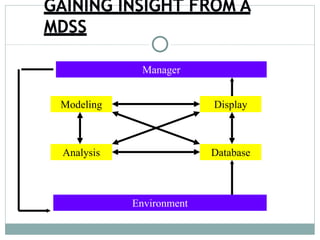
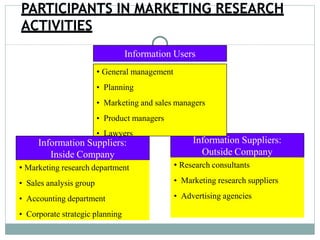
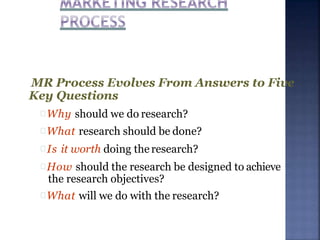
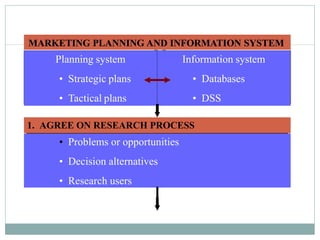
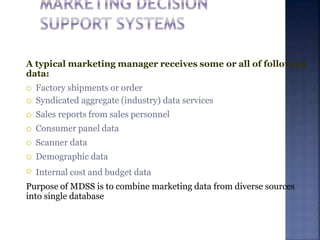
SlideShare a Scribd company logo
AISHWARYA .P
ASSISTANT PROFESSOR
MAHER
BI is the ability to access data from multiple sources
within and outside an organization for the purpose of
analysis.
It links the disparate operation systems to the end
users of the data, thus creating an environment with
free flow of information.
It offers a reliable barometer of the business
performance.
Operations
Intelligence
Finance and Accounting
Intelligence
Marketing
Intelligence
HR Intelligence
Back-End Analysis
MI focuses on the use of information as a source of
strategic advantage.
Need to have a thorough knowledge of customers,
their attitudes, tastes and preferences.
Need to analyze competition for benchmarking and
making price, product, market and segment
decisions.
A continuing and interacting structure of people, equipment and procedures
designed to gather, sort, analyze, evaluate, and distribute pertinent, timely
and accurate information to marketing decision making
MIS Uses 3 Types of Information



Recurring market and accounting data from market analysis and
accounting activities
Intelligence relevant to future strategy of business
Marketing research studies not of a recurring nature
Four Stages of Market Planning Process



 Situation analysis
Strategy development
Marketing program development
Implementation
Analysis of
 Market environment
 Market characteristics
 Consumer behavior
Research Approaches
 Organize information obtained from prior studies
(secondary)
 Focus groups
Market Research provides information to
assist management with three critical
decisions
 What business should we be in?
 How will we compete?
 What are the objectives for the business?
Programs embrace specific tasks
Action program usually focuses on a single
objective in support of one element of overall
business strategy
Starts with decision to proceed to a new program or strategy
Commitment to objectives, budgets and timetables
Specific measurable objectives must be set for all elements of
marketing program
"Did the elements achieve their objectives?"
“Should the marketing program be continued, discontinued, revised or
expanded?"
Relevance
Type and Nature of Information Sought
Timing
Availability of Resources
Cost-benefit Analysis
Situation
Analysis
Strategy
Development
Marketing
Program
Development
Implementation
Define the business scope and served market
segments
Establish competitive advantages
Set performance objectives.
Product and channel decision
Communication decisions
Pricing
Personal selling decisions
Performance monitoring
Refining strategies and program
Hispanics account for nearly 13% of the U.S. population.
Research shows that Latino households spend $600
billion of $1.3 trillion purchasing power of multicultural
population.
In 1998 only 2.5% of total advertising dollars in the
United States was focused on Latinos.
By 2050, Hispanic population would represent 25% of US
population.
Who can tell me what the problem is?
Programmatic Research
Develops market options through market segmentation,
market opportunity analysis, or consumer attitude and
product usage studies
Selective Research
Tests different decision alternatives such as new product
testing, advertising copy testing, pre-test marketing, and
test marketing
Evaluative Research
Evaluation of performance ofprograms
DSS models are developed and adapted to
support each firms own decision problems
Used to retrieve data, transform it into usable
information, and disseminate it to users
Allow managers to interact directly with
database
To retrieve information
Provides a modeling function to help interpret
information retrieved
Combines marketing data from diverse sources
into a single database, enabling product managers,
sales planners, market researchers, financial
analysts, and production schedulers to share
information.
Managers’ needs for decision relevant
information:
Routine comparisons of current performance
against past trends on each of the key measures of
effectiveness
Periodic exception reports to assess which sales
territories or accounts have not matched previous
years’ purchases
Special analyses to evaluate the sales impact of
particular marketing programs, and to predict what
would happen if changes were made.
Marketing Decision Support Systems Contd..
Interactive
Flexible
Discovery oriented
User friendly
Marketing Decision Support Systems
Database
Reports and Displays
Analysis capabilities
Models
Manager
Modeling
Analysis
Display
Database
Environment
Information Suppliers:
Inside Company
Information Suppliers:
Outside Company
Information Users
• General management
• Planning
• Marketing and sales managers
• Product managers
• Lawyers
• Marketing research department
• Sales analysis group
• Accounting department
• Corporate strategic planning
• Research consultants
• Marketing research suppliers
• Advertising agencies
MR Process Evolves From Answers to Five
Key Questions
Why should we do research?
What research should be done?
Is it worth doing the research?
How should the research be designed to achieve
the research objectives?
What will we do with the research?
Planning system
• Strategic plans
• Tactical plans
Information system
• Databases
• DSS
1. AGREE ON RESEARCH PROCESS
• Problems or opportunities
• Decision alternatives
• Research users
2. ESTABLISH RESEARCH OBJECTIVES
• Problems or opportunities
• Decision alternatives
• Research users
Estimate
the value of
information
Do not conduct
marketing research
NO
Is benefit >
cost
Yes
• Problems or opportunities
• Decision alternatives
• Research users
5. COLLECT THE DATA
1. REPORT THE RESEARCH RESULTS AND PROVIDE
STRATEGIC RECOMMENDATIONS
6. PREPARE AND ANALYZE THE DATA
Yes
Marketing research process is consistent for both
domestic and international markets
Variety of market environments affect
international marketing research process
Economic Environment
Social-cultural Environment
Political and Legal Environment
Technological, Multimedia and
Infrastructural Facilities
Step 1
Research Purpose


 Problem or opportunity analysis
Which problems or opportunities areanticipated
What is the scope of the problems and the possiblereasons?
Evaluation of decision alternatives
What are the alternatives beingstudied?
What are the criteria for choosing among thealternatives?
Research users
Who are the decisionmakers?
Are there any covertpurposes?
Kroger Co. is adding five new Signature stores in Houston.
More than 1,000 questionnaires were sent to targeted area
residents asking what kind of features the respondents (or
future customers) would like to see included in a new
supermarket in their neighborhood. Based on the surveys,
Kroger added several variations:
 A larger selection of wines
 A sit-down coffee bar
 The largest all-natural food section
 U-Scan Express aisles
Step 2
Research Objective

 A statement, in as precise terminology as possible, of what information
is needed
Should be framed to ensure information obtained will satisfy research
purpose
Research Question
Hypothesis Development
Research Boundaries
Research Question
Asks what specific information is required to
achieve the research purpose
Sample questions to determine if a specific
advertisement should be run:
Will the advertisement be noticed?
Will it be interpreted accurately?
Will it influence attitudes?
Hypothesis Development
 A possible answer to a research question.
Generating a hypothesis
 Draw on previous research efforts
 Borrow from other disciplines such as:
Psychology
Sociology
Marketing
Economics
 Manager’s experience with related problems, coupled with
knowledge and the use of judgment
• Theory
• Management experience
• Exploratory research
Research
Question Hypothesis
Research
Purpose
Research
Design
Research
Objective
Marketing Research 8th Edition
Aaker, Kumar, Day
Step 3
Estimating the Value of Information
 Value depends on:
Importance ofdecision
Uncertainty that surroundsit
Influence of research information on thedecision
Product A
$ 4 million
$ 1 million
$ 4 million
-$ 2.5 million
Success
Success
Failure
Failure
Introduce
Do not
Introduce
Do not
Introduce
Product B
Avoid mistakes:
 Profile you target customers and clients
 Interview target segments to assess how well they match
your preconceived ideas
 Hire local researchers
 Use a variety of methods to get a well-rounded picture
Qualitativemethods
Quantitativemethods
 Look at the findings and analyze what must be done
differently, abroad or internationally, in comparison with
current domestic marketing activities
Possible questions:
 Do opportunities exist for entry into foreign markets?
 Which foreign markets warrant detailed investigation?
 What are the major economic, political, legal, and other
environmental facts in each potential country?
 What mode of entry does the company plan to adopt?
 What is the market potential in these countries?
 Who are the firm’s present and potential customers?
 What is the nature of competition in the foreign market?
 What kind of strategy should the firm adopt?
Research Design
 The detailed blueprint to guide the
implementation of a research study toward
the realization of its objectives
Exploratory Research
 Used when seeking insights into the general nature of a
problem, the possible decision alternatives, and the
relevant variables that need to be considered
Descriptive Research
 Provides an accurate snapshot of some aspect of the market
environment, such as:
The proportion of the adult population that supports the United
Fund
Consumer evaluation of the attributes of our productversus
competing products.
The socioeconomic and demographic characteristics of the
readership of a magazine
The proportion of all possible outlets that are carrying, displaying,
or merchandising our products
Causal Research
 Used when it is necessary to show that one variable causes
or determines the values of other variables, a causal
research approach must be used
Uses Combination of All Three Research
Techniques
Exploratory techniques generate all
possible reasons for a problem
Descriptive and Causal approaches
narrow the possible causes
Problem
Exploratory
Research
Probable
Causes
Causal
Research
Descriptive
ResearchPossible
causes of the
problem
Relationship between Data Collection Method and
Category of Research
CausalData Collection Method Exploratory Descriptive
Secondary Sources
Information System a b
Databanks of other
organizations
Syndicated Services
a
a
b
b b
a
b
Primary Sources
Qualitative Research
Surveys
Experiments
b
a
b
b
a
Once the research approach has been chosen:
Develop:
 The specifics of measurements
 Plan for choosing the sample
 Methods of analysis
 Analysis of value versus cost and time involved
Determining Information Requirements
Consider level and type of decision for which research is
conducted
Two types of decisions
 Strategic
 Tactical
Global Strategic Decision
Mostly made at corporate headquarters
Information required is governed by overall company
objectives
Implies long term survival of company
Deal with macro environment
Tactical Decisions
Concerned with micro-level implementation issues
Information obtained from primary data
Concerned with marketing mix strategy for
country/product markets
Made at functional or subsidiary level
Unit of Analysis
Researcher must decide at what level the analysis is done


 Global level
All countries takensimultaneously
Regional level
Groups of countries considered homogeneous formacro
environmental factors
Country level
Each country taken as separateunit
Construct Equivalence
Deals with how both the researcher and the subjects see,
understand, and code a particular phenomenon
"Are we studying the same phenomenon in countries X
and Y?"
Measurement Equivalence
Deals with the methods and procedures used by the
researcher to collect and categorize essential data and
information
Are the phenomenon in countries X and Y measured the
same way?"
Sampling Equivalence
"Are the samples used in countries X and Y
equivalent?"
Two Components of Errors
 Sampling error
 Non-sampling error
Sampling Error
 Difference between a measure obtained from a sample of
population and the true measure that can be obtained
only from the entire population
Nonsampling Error
 All other errors associated with a research project
Design Errors
Flaws in research design
Selection Error
Population Specification Error
Sampling Frame Error
Surrogate Information Error
Measurement Error
Experimental Error
Data Analysis Error
Administering Errors
Occur during the administration of a survey instrument to the
respondents
 Questioning Error
 Recording Error
 Interference Error
Response Error
 Occur when respondent provides inaccurate
answers to survey questions
Non-response Error
 Occurs if
Some members of sample not contacted
Some members provide incomplete or no
response to survey instrument
Describes a plan for conducting and
controlling a research project
Basis for a written contract between manager
and researcher
Basis for a vehicle for reviewing important
decisions
Used to choose among competing supplies
and influence decision to fund study
Executive Summary
Purpose and Scope
Objectives
Research Approach
Time and Cost Estimates
Appendices
Secondary Data
Primary Data
DATA
SOURCES
SECONDARY
DATA
SOURCES
PRIMARY
DATA
SOURCES INTERNAL
RECORDS
EXTERNAL
SOURCES
PUBLISHED
DATA
STANDARDIZED
SOURCES OF
MARKETING
DATA
INTERNET
ELECTRONIC
PRINTED
•STORE AUDITS
•WAREHOUSE WITHDRAWAL SERVICES
•CONSUMER PURCHASE PANELS
•SINGLE SOURCE DATA
•NIELSEN’S TELEVISION INDEX
•STARCH SCORES
•ARBITRON PANEL
•MULTIMEDIA SERVICES
•SALES/PATRONAGE RESULTS ( OUTCOMES )
•MARKETING ACTIVITY ( INPUTS )
•COST INFORMATION
•DISTRIBUTOR REPORTS AND FEEDBACK
•CUSTOMER FEEDBACK
•GOVERNMENT
•TRADE ASSOCIATIONS
•PERIODICALS
•NEWSPAPERS
•BOOKS
•ANNUAL REPORTS
•PRIVATE STUDIES
Sources of
Secondary Data
Can solve the problem on hand all by its own
Can lead to new ideas and other sources
Helps to define the problem more clearly
Can help in designing the primary data
collections process
Helps in defining the population / sample
Can serve as a reference base
Low cost
Less effort
Less time
At times, more accurate
At times, only way to obtain data
Collected for some other purpose
No control over data collection
May not be accurate
May not be in correct form
May be outdated
May not meet data requirements
Assumptions have to be made
Benefits Limitations
Internal Records
Accounting Data
Sales Reports
Inventory Management
Customer Database
Published data sources (e.G., Census, publications
of various trade associations)
Trade directories
Computer retrievable databases ("online"
databases)
Based on the Method of Storage
and Retrieval of Information
Based on the Type of
Information
Reference
On-line
Databases
CD-ROM Floppy Disc
SourceDatabases Databases
Indirect through
Networks
Direct from
Producer
Direct from
Vendors
Internet
Scope of information available
Speed of information access and
retrieval
Commercially available search
procedures provide considerable
flexibility and efficiency
Rely solely on the accuracy of the
abstract author
Depend on the journal and article
selection policy of the database
producer
Might miss important
information, or retrieve a lot of
irrelevant data if searching by
“keyword”
LimitationsAdvantages
Factors to Be Considered:
Who has collected the data (did they have adequate
resources)?
Why was the data collected (how the interests of agency
match with ours)?
How the data was collected (to determine the quality of data
on-hand)?
What data was collected (geographic and demographic
limitations)?
When the data was collected (how old/obsolete is the data)?
Monitoring the Environment
Demand Estimation
Demand Estimation
Census data
Standard Industrial
Classification (SIC) or North
American Industrial
Classification (NAIC)
Trade association data
Experts and authorities
Monitoring the Environment
Press releases
Legislation and laws
Industry news
Business and practitioner
literature, such as magazines
Segmentation and
Targeting
ORG Reports
CLUSTER PLUS
Developing a Business
Intelligence System
Competitor’s annual
reports
Press releases
Factors
Multitude of information users having common
information needs
When cost of satisfying individual user's need is
prohibitive
The increasing use of scanner systems at the check
out points
Biggest research company in the world
Their auditing services cover four groups
Grocery products
Drugs
Mass merchandisers
Alcoholic beverages
To Cover the gap between Warehouse Withdrawal
Audits and Actual Purchases, following Methods
can be used
Home Audit Approach
 Panel member agrees to permit an auditor to
check the household stocks of certain product
categories at regular intervals
Mail Diary Method
 Panel member records the details of each
purchase and returns in the diary by mail at
regular intervals
Aggregate Sales Activity
Brand Shares
Shifts in Buyer Characteristics
Shifts in Retail Outlets
Advantages of Consumer Panels
Possibility of Selection Bias
Mortality Effect
Testing Effects
A new technology that may replace the bar codes.
Utilizing a tiny silicon chip to store information; a
small transmitter would then send this
information to a scanner. RFID offers more
benefits than a UPC, such as:
 The ability to store more information
 The ability to change the information on the tag
 The ability to transmit all the information on the
chip to a scanner without clear line of sight
TAM for TV audiences
RAM for FM Radio Channels
INS & IRS for newspapers
ORG report for FMCG, Consumer Durables etc
Mechanics No wire connections Wired directly to TV
and VCR tuners
Research Methods Data retrieved by
reading UTCP codes
Telephone
connections used to
return data
Method of Data
Collection
User logs in/out before
and after watching TV
User punches
numerical code into
data-entry device
Reputation as: Media measurement
business serving the
ratio industry
Foremost in TV
ratings
SMART PEOPLE METER
A typical marketing manager receives some or all of following
data:






 Factory shipments or order
Syndicated aggregate (industry) data services
Sales reports from sales personnel
Consumer panel data
Scanner data
Demographic data
Internal cost and budget data
Purpose of MDSS is to combine marketing data from diverse sources
into single database
Measuring product sales and market share
Measuring advertisement exposure and
effectiveness
Measuring promotion effectiveness
Estimation And evaluation of models
& Methods of Qualitative research.
Qualitative
Quantitative
Primary Secondary
Qualitative Methods
 Recommended to capture the basic feel of a problem
prior to conducting more analytical study
Observational Methods
 These methods are limited to providing information on
current behavior
Exploratory
 Conducted primarily to explicitly define the
problem and formulate hypotheses
Orientation
 To learn more about target consumer (e.G. Culture,
language)
Clinical
 To gain insights into topics that are difficult in a
structured research
Major constraints:
 Volume of data
 Complexity of analysis
 Detail of clarification record
 Time-consuming nature of the clerical efforts required
 Relatively expensive
Nondirective interviews (respondent enjoys
maximum freedom)
Semi-structured or focused individual interviews
 Covers a specific list of topics or sub-areas
Individual in-depth interviews (3 techniques):
 Laddering
 Hidden-issue
 Symbolic Analysis
Offers participants more stimulation than an
interview; makes new ideas and meaningful
comments more likely
Issues to be addressed:
 Outlining the intended direction of the group
 Explaining how participants were recruited
 Reeducating observers on the concepts of random selection,
statistical reliability, and projectability of research results
Exploratory Focus Groups
 Used in the exploratory phase of the market research
process
 Used for generating the hypotheses
Clinical Focus Groups
 Based on the premise that an individual's true feelings
and motivations are subconscious in nature
Experiencing Focus Groups
 Allows the researcher to experience the emotional
framework in which the product is being used
Casual Observation
Systematic Observation
Direct Observation
Contrived Observation
Content Analysis
Physical Trace Measures
Humanistic Inquiry
Behavior Recording Devices
Cannot be used to observe motives, attitudes or
intentions
More costly and time consuming
Used to Capture a Wide Variety of Information:
Attitude
Decisions
Focus on process and not the results
Measuring the relationship between actions & needs,
desires, preferences, motives and goals
The Results Will Be Meaningful If:
Population has been defined correctly
Sample is representative of the population
Respondents selected are able and willing to cooperate
Questions are understood by the respondents
Respondents have the knowledge, opinions, attitudes, or
facts required
Interviewer correctly understands and records the response
POPULATION RESPONDENT INTERVIEWER
Sample Question
Answer
Sampling error
Nonresponse
due to refusals
or not-at-home
Ambiguity
of question
Interviewer
error
Ambiguity
of answer
Inaccuracy in
response
•Inability to
formulate a
response
•Unwillingness
to respond
Refusals Could Occur Due to:
Nature of questions and place
Subject of no interest to the respondent
Fear
Invasion of privacy
Hostility towards sponsor
Personal bias
Characteristics of the data collection procedure
(e.G., Presidential polls)
Phenotypic Source
 Characteristics of the data collection procedure
Questionasked
How question isasked
Length ofinterview
Genotypic Source
 Indigenous characteristics of the respondents
Age
Sex
Occupation
Inability to respond
Telescoping
Averaging
Omission
Cannot formulate an adequate answer
Some of these problems can be solved by:
Aided-recall techniques
This Could Arise Due to the Following Reasons:
Concern about invasion of privacy
Time pressure and fatigue
Prestige seeking and social desirability response
bias
Courtesy bias
Uninformed response bias
Response style
This Depends On:
Respondent’s Impression of the Interviewer
Questioning, Probing, and Recording
Fraud and Deceit
Improving Interviewer Quality
Personal Interview
Telephone Interview
Mail Survey
Fax Survey
E-mail Survey
Web-based Survey
Sampling
Type of Population
Question Form
Question Content
Response Rate
Costs
Available Facilities
Length of Data Collection
Misrepresentation of Data Collection Process
Stems From:
Representation of a marketing activity other than
research as research
Abuse of respondents rights during the data
collection process, under the rationale of providing
better quality research. E.G.,
Use of survey for selling purposes
Use of survey to obtain names and addresses of
prospects for direct marketing
The rights of the respondents can be violated by:
Disguising the purpose of a particular
measurement
Deceiving the prospective respondent as to the
true duration of the interview
Misrepresenting the compensation in order to
gain cooperation
The rights of the respondents can be violated
by:
Not mentioning to the respondent that a follow up interview
will be made
Using projective tests and unobtrusive measures to
circumvent the need for a respondents consent
Using hidden tape recorders
Not debriefing the respondent
Conducting simulated product tests in which identical
product is tried by respondent except for variations in color
Guidelines:
 Reviewing data
 Getting started
 Setting the feedback objective
 Customer presentation
 Sharing responsibility
 Handling issues you cannot fix
 Working the issue resolution with your account
Personal Interview
Telephone Interview
Mail Survey
There Are Four Entities Involved:
Researcher
Interviewer
Interviewee
The Interview Environment
Methods:
Door to Door Interviewing
Executive Interviewing
Mall Intercept Surveys
Self Administered Interviews
Purchase Intercept Technique (PIT)
Omnibus Surveys
Advantages:
Can arouse and keep interest
Can build rapport
Ask complex questions with the
help of visual and other aids
Clarify misunderstandings
High degree of flexibility
Probe for more complete answers
Accurate for neutral questions
Do not need an explicit or current
list of households or individuals
Disadvantages:
Bias of Interviewer
Response Bias
 Embarrassing/personal questions
Time Requirements
Cost Per Completed Interview Is
High
The Important Aspects of Telephone Interviewing:
Selecting telephone numbers
 Pre-specified list
 A directory
 Random dialing procedure
Random digitdialing
Systematic random digit dialing(SRDD)
Call outcomes
The introduction
When to call
Call reports
Advantages:
Central location, under supervision, at
own hours
More interviews can be conducted in a
given time
 Travelling time is saved
More hours of the day are productive
Repeated call backs at lower cost
Absence of administrative costs
Lower cost per completed interview
Intrusiveness of the phone and ease of
call backs
 Less sample bias
Limitations:
Inability to employ visual aids or
complex tasks
Can't be longer than 5-10 min. or
they get boring
Amount of data that can be
collected is relatively less
A capable interviewer essential
Sample bias
 As all people do not have
phones, or are not listed
Requires a broad identification of the individuals to be sampled before
data collection begins
Some Decisions That Need to Be Taken Are:
Type of Return Envelope
Postage
Method of Addressing
Cover Letter
The Questionnaire Length, Layout, Color, Format Etc
Method of Notification
Incentive to Be Given
Advantages:
Lower cost
Better results, including a
shorter response time
Reliable answers as no
inhibiting intermediary
Survey answered at
respondents discretion
Disadvantages:
The identity of the respondent is inadequately
controlled
No control over whom the respondent consults
before answering the questions
The speed of the response can't be monitored
No control on the order in which the questions are
exposed or answered
The respondent may not clearly understand the
question and no opportunity to clarify
No long questionnaires
Subject to availability of a mailing list
Response rate is generally poor
Number of problems such as obsolescence,
omissions, duplications, etc
Perceived amount of work required, and the length of the questionnaire
Intrinsic interest in the topic
Characteristics of the sample
Credibility of the sponsoring organization
Level of induced motivation
Coping with non-response:
Include monetary incentive
Send a follow-up letter
Include return envelope
Alternatives:
Mail Panels
Fax Surveys
Advantages
The best way to implement some
sample designs
Most effective way of enlisting
cooperation.
Advantages of interview questions-
probing for adequate answers,
accurately following complex
instructions or sequences are realized.
Multi-method data collection are
feasible
Rapport and confidence building are
possible.
Probably longer interviews can be
done in person.
Limitations
It is likely to be more costly than
alternatives.
A trained staff of interviewers that is
geographically near the sample is
needed.
The total data collection period is
likely to be longer than for most
procedures.
Some samples may be more
accessible by some other mode.
Advantages
Lower costs than personal interviews.
Random Digit-Dialing (RDD) sampling of
general population.
Better access to certain populations
Shorter data collection periods.
The advantages of interviewer
administration (In contrast to mail
surveys).
Interviewer staffing and management
easier than personal interviews-smaller
staff needed, not necessary to be near
sample, supervision and quality control
potentially better.
Likely better response rate from a list
sample than from mail
Limitations
Sampling limitations, especially as a result
of omitting those without telephone
Nonresponse associated with RDD
sampling is higher than with interviews
Questionnaires or measurement
constraints
Possibly less appropriate for personal or
sensitive questions if no prior contact
Advantages
Ease of presenting questions requiring
visual aids.
Asking questions with long or complex
response categories is facilitated.
Asking batteries of similar questions is
possible.
Limitations
Questionnaire design needs special
attention
Open questions are usually not useful.
Respondents require good reading and
writing skills.
The interviewer is not present to exercise
quality control with respect to answering
all questions, meeting questions
objectives, or the quality of answers
provided.
Advantages
Relatively low cost
Can be accomplished with minimal staff
and facilities.
Provides access to widely dispersed
samples.
Respondents have time to give thoughtful
answers, look up records, or consult others.
Limitations
Ineffective as a way of enlisting
cooperation.
Various disadvantages of not having
interviewer involved in data collection.
Need for accurate mailing addresses of the
sample.
Advantages
The interviewer can explain the study,
answer questions, and designate a
respondent.
Response rates tend to be like those of
personal interview studies.
There is more opportunity to give
thoughtful answers and consult records.
Limitations
Costs about as much as personal
interviews.
A field staff is required.
Mental states used by individuals to structure the
way they perceive their environment and guide the
way they respond to it
What Are Attitudes?
Majority of questions in marketing research are
designed to measure attitudes
Attitudes include
 Information possessed
 Feelings of like and/or dislike
 Intentions to behave
Management wants to understand and influence
behavior
Attitudes lead to behavior
More feasible to ask questions on attitudes than to
observe and interpret behavior
Large capacity for diagnosis and explanation
Learn which features of a new product concept are
acceptable or unacceptable
Measure the perceived strengths and weaknesses of
competitive alternatives
Cognitive or Knowledge Component




Represents a person’s information about an object
Awareness of existence of the object
Beliefs about the characteristics or attributes of the object
Judgments about the relative importance of each of the attributes
Affective or Liking Component




Summarizes a person’s overall feelings toward an object, situation, or person
On a scale of like-dislike or favorable-unfavorable
When there are several alternatives, liking is expressed in terms of preference
Measured by asking which alternative is “most preferred” or “first choice,” which is the “second
choice,” and so on
Intention or Action Component


Refers to a person’s expectations of future behavior toward an object
Intentions are usually limited to a distinct time period that depends on buying habits and planning
horizons
Advantage
 Incorporates information about a respondent’s ability or willingness to pay for the object, or other
taken action
Measurement
Standardized process of assigning numbers or other symbols to certain
characteristics of objects of interests according to pre-specified rules
Characteristics for Standardization
One-to-one correspondence between the symbol and the characteristic in
the object that is being measured
Rules for assignment should be invariant over time and the objects being
measured
Scaling
Process of creating a continuum on which objects are located according
to the amount of the measured characteristic that the object possesses
Nominal Scale
Objects are assigned to mutually exclusive,
labeled categories
No necessary relationships among
categories
No ordering or spacing are implied
Only possible arithmetic operation is a
count of each category
Ordinal Scale
Rank objects or arrange them in order by
some common variable
Does each object have more or less of a
variable than some other object?
Does not provide information on how
much difference there is between objects
Arithmetic operations are limited to
statistics such as median or mode
Interval Scale
Numbers are assigned to objects that
represent categories, rank orders, as well as
how much the object is preferred on the
attribute being measured
Differences can be compared
Entire range of statistical operations can be
employed
Ratio Scale
Special kind of interval scale with
meaningful zero point
Possible to say how many times greater or
smaller one object is than the other
Magnitude scaling of attitudes has been
calibrated through numeric estimation
Attitude Scales
Single-Item
Scales
Continuous
Scales
Multi-Item
Scales
Stapel
Scales
Thurstone
Scales
Likert
Scales
Associative
Scales
Semantic
Differential
Scale
Paired
Comparison
Scales
Q-sort
Scales
Comparative
Scales
Itemized
Category
Scales
Pictorial
Scales
Constant Sum
Scales
Rank Order
Scales
Problems in choosing
 There are many different techniques, each with its own
strengths and weaknesses
 Virtually any technique can be adapted to the
measurement of any one of the attitude components
Researchers choice shaped by:
 The specific information required
 Adabtability of the scale to the data collection method and
budget constraints
 Compatibility of the scale with the structure of the
respondent’s attitude
Validity
 An attitude measure has validity if it measures what it
is supposed to measure
Face Validity
 The extent to which the content of a measurement
scale appears to tap all relevant facets of the construct
Criterion Validity
 Based on empirical evidence that the attitude measure
correlates with other “criterion” variables
Concurrent validity
 Two variables are measured at the same time
Predictive validity
 The attitude measure can predict some future event
Convergent validity
 A form of construct validity that represents the
association between the measured construct and
measures of other constructs with which the construct
is related on theoretical grounds
Discriminant validity
 A form of construct validity that represents the extent to
which the measured construct is not associated with which
the construct is related on theoretical grounds
Construct Validity
 A scale evaluation criterion that relates to the underlying
question "what is the nature of the underlying variable or
construct measured by the scale?“
Reliability
 The consistency with which the measure produces the
same results with the same or comparable population
Sensitivity
 Extent to which ratings provided by a scale are able to
discriminate between the respondents who differ with
respect to the construct being measured
Generalizability
 Refers to the ease of scale administration and
interpretation in different research settings and situations
Relevancy
 Relevance = reliability * validity
Questionnaire building
is an art!
A questionnaire
is always custom-built!
PLANNING WHAT TO MEASURE
Revisit the research objectives
Decide on the Research issue of your questionnaire
Get additional information on the research issue from data sources and
secondary exploratory research
Decide what to be asked under the research issue
FORMATTING THE QUESTIONNAIRE
In each issue determine the content of each question
Decide on the format of each question
QUESTION WORDING
Determine how the question is worded
Evaluate each question on the basis of comprehensibility, knowledge and
ability, willingness/inclination of a typical respondent to answer the
question
SEQUENCING AND LAYOUT DESIGNS
Layout the questions in proper sequence
Group all the questions in each subtopic to get a single questionnaire
PRETESTING AND CORRECTING PROBLEMS
Read through the whole questionnaire to check whether it makes sense and it
measures what it is supposed to measure
Check the questionnaire for error
Pretest the questionnaire
Correct the problems
Logical Steps to Develop a Good Questionnaire
Plan what to measure
Formulate questions to obtain the needed information
Decide on the order and wording of questions and the layout of the
questionnaire
Using a sample, test the questionnaire for omissions and ambiguity
Correct the problems (pretest again, if necessary)
Planning What to Measure
Specify research objectives and information to be collected
Relevance of the study
Translating Research Objectives Into Information
Requirements
Formatting the Question
Decision to be made regarding the degree of freedom to be
given to the respondents in answering the questions
Alternatives
 Open ended with no classification
 Open ended where the interviewer uses precoded
classifications to record the response
 Close ended or structured format in which a question or
a supplementary card presents the responses to be
considered
Open Ended Questions Are Good for the Following
Circumstances
Introduction to a survey or to a topic
When it is important to measure the saliency of an issue to a
respondent
When there are too many responses to be listed, or they
can't be foreseen
When verbatim responses are desired to give the flavor of
people's answers or to cite examples
When the behavior to be measured is sensitive or
disapproved
Disadvantages
Variability in the clarity and
depth of the responses
Articulateness of the
respondent in personal
interview
Willingness to compose a
written answer for a mail
survey
Interviewer's ability to
record the verbatim answers
quickly
Advantages
Wide range of responses
Responses obtained
without any influence
Free choices
ClosedThere Are Two Basic Formats for
Ended or Structured Questions
Choice from a list of responses
Appropriate single-choice rating on a scale
 Easier to answer
 Require less effort
by the interviewer
 Tabulation and
analysis is easier
 Less potential error
in the way the
question is asked and
the way it is
recorded
 The responses are
directly
comparable from
respondent to
respondent
Advantages Limitations
Disagreement among researchers on the type of
responses that should be listed
The answer to a closed response question will
be received no matter how relevant or irrelevant
the question is in that context
May not produce meaningful results
Dichotomous questions are prone to a large
amount of measurement error because the
alternatives are polarized
Good questions are hard to develop
Provides fewer opportunities of self expression
The list of alternative responses provides
answers that might have not been considered by
the respondent who are reluctant to admit
ignorance, and thereby selecting a "reasonable"
response
Generally five to seven categories
Ideally the multiple choices should be mutually
exclusive
Responses are likely to be affected by the order in which they are
presented.
What factor influences your fast-food restaurant choice
most ?
 Convenient location
 Quality of food
 Menu selection
 Fast service
 Reasonable prices
 Brand name
 Cleanliness
To prevent order bias, place the average or expected response at
various positions in the sequence of categories
Respondents who do not know the answer might
take categories as cues.
How many long-distance calls do make in a
week? less than 5  less than 10
 5-10 or  10-20
 More than 10.  More than
20.
Concerns the handling of “don’t know” and neutral
responses
May be advisable to provide the interviewer with an
additional “no answer” category to identify these
people correctly
Probe:
Using an open-response question to follow up a
closed-response question
Two general purposes for the use of probes:
Pinpoint questions that were particularly difficult
for respondents
Aid researcher interpretation of respondent
answers
The following details need special attention:
Is the vocabulary simple, direct, and familiar to all
respondents?
Do any words have vague or ambiguous meanings?
Are any questions " double-barreled”?
Are any questions leading or loaded?
Are the instructions potentially confusing?
Is the question applicable to all respondents?
Are the questions of appropriate length?
Avoid ambiguous words
How many times per month do you visit a fast-food
restaurant?
 Never
 Occasionally
 Sometimes
 Often
Are any questions loaded?
1)Don’t you think, because its so greasy, fast-food is
one of the worst types of food?
2)Do you prefer a burger that is grilled on a hot
stainless-steel grill or cooked by passing the raw
meat through an open gas flame?
Are any questions "double-barreled”?
Are you satisfied with the price and the service of
Café Coffee Day?
Is the question applicable to all respondents?
Why do you like fast-food?
Assumes that respondent likes fast-food.
Consumption of Kellogg’s Frosted Flakes
The casual approach
 “Have you eaten ‘Frosted Flakes’ within the last
week?
The numbered card
 “Would you please read off the number on this card
that corresponds to what you had eaten for breakfast
in the last week?”
(Hand card to respondent)
3. Pancakes
4. Frosted Flakes
5. Other (what)?
The everybody approach
 “As you know, many people have been eating Frosted Flakes for
breakfast. Do you eat Frosted Flakes?”
The “other people” approach
 “Do you know of any adult who eats Frosted Flakes?”
 “How about yourself?”
The sealed ballot technique
 In this version you explain that the survey respects
people’s right to anonymity with respect to their eating
habits, and that they themselves are to fill out the answer
to the question, seal it in an envelope, and drop it in a box
conspicuously labeled “sealed ballet box” that is carried by
the interviewer
The Kinsey approach
 Stare firmly into respondent’s eyes and ask in simple
clear-cut language as that to which the respondent is
accustomed, and with an air of assuming that everyone
had done everything, “Do you eat Frosted Flakes for
breakfast?”
Randomized Response Technique
 The respondent is asked to answer one or two randomly
selected questions without revealing which question has
been answered
Questions:
 Sensitive
 Innocuous
Since the interviewer records a “yes” or “no” answer
without knowing which question has been answered, the
respondent feels free to answer honestly
Open with an easy and non threatening question
The questionnaire should flow smoothly and
logically from one topic to the next
Proceed from broad general questions to the more
specific
Location Type Function Example Location Type Function Example
Starting questions Broad, general To break the ice and Do you own a Starting questions Broad, general To break the ice and Do you own a
questions establish a report with personal computer? questions establish a report with personal computer?
the respondent the respondent
Next few questions Simple and direct To reassure the What brands of Next few questions Simple and direct To reassure the What brands of
questions respondent that the personal computers questions respondent that the personal computers
survey is simple and did you consider survey is simple and did you consider
easy to answer when you bought it? easy to answer when you boughtit?
Questions up to a Focused questions Relate more to the What attributes did Questions up to a Focused questions Relate more to the What attributes did
third of the research objectives you consider when third of the research objectives you consider when
questionnaire and convey to the you purchased you questionnaire and convey to the you purchased you
respondent the area of personal computer? respondent the area of personal computer?
research research
Major portion of the Focused questions; To obtain most of the Rank the following Major portion of the Focused questions; To obtain most of the Rank the following
questionnaire some may be difficult information required attributes of a questionnaire some may be difficult information required attributes of a
and complicated for the research personal computer and complicated for the research personal computer
based on their based on their
importance to you importance to you
Last few questions Personal questions To get classification What is the highest Last few questions Personal questions To get classification What is the highest
that may be perceived and demographic level of education that may be perceived and demographic level of education
by the respondent as information about the you have attained? by the respondent as information about the you haveattained?
sensitive respondent sensitive respondent
Location Type Function Example
Starting Questions Broad, General Questions To break the ice and establish
rapport with the respondents
Do you own a personal
computer?
Next few Questions Simple and Direct
Questions
To reassure the respondent
that the survey is simple and
easy to answer.
What brands of personal
computers did you
consider while you were
buying the PC?
Questions up to a third
of the questionnaire
Focused Questions Relate more to the research
objectives and convey to the
respondent the area of
research
What attributes did you
consider when you
purchased your personal
computer?
Major portion of the
questionnaire
Focused Questions: Some
may be difficult and
complicated
To obtain most of the
information required for the
research
Rank the following
attributes of a personal
computer based on their
importance to you.
Last few questions Personal questions that
may be perceived by the
respondent as sensitive
To get classification and
demographic information
about the respondent.
What is the highest level
of education you have
attained?
Sensitive questions should not be placed in the
beginning of the questionnaire
Use good quality of paper
Physical layout should be appealing and interesting
Order bias
1. No question asked 2.8
2. Asked only about advantages 16.7
3. Asked only about disadvantages 0.0
4. Asked about both advantages
and disadvantages
5.7
Percentage of Respondents
“Very Much Interested” in
Buying New ProductQuestions Preceding Buying Interest Question
Pretest Design
Pretesting Specific Questions For
Variation
Meaning
Taskdifficulty
Respondent interest andattention
Pretesting the Questionnaire
Flow of thequestionnaire
Skippatterns
Length
Respondent Interest andAttention
 Strategy that
emphasizes words
rather than
quantificatino in
collection & analysis
of data
 Predominantly
emphasizes an
inductive approach
to relationship
between theory and
research in which
A research strategy that
emphasizes quantification in
collection and analysis of data
Entails a deductive approach to the
relationship between theory and
research in which the accent is
placed on the testing of the
theories
It has incorporated the practices
and norms of the natural scientific
model and positivism in particular
It embodies a view of social reality
as an external objective reality
In summary – The collection of
numerical data and as exhibiting
view of relationship between
theory and research as deductive
A set of methods and techniques used to obtain
information and insights from data
Helps avoid erroneous judgements and conclusions
Can constructively influence the research objectives
and the research design
Data editing
Coding
Statistically adjusting the data
Data Editing
Identifies omissions, ambiguities, and errors in
responses
Conducted in the field by interviewer and field
supervisor and by the analyst prior to data analysis
Problems identified with data editing
Interviewer Error
Omissions
Ambiguity
Inconsistencies
Lack of Cooperation
Ineligible Respondent
Coding
Coding closed-ended questions involves specifying
how the responses are to be entered
Open-ended questions are difficult to code
 Lengthy list of possible responses is generated
Statistically Adjusting the Data + Weighting
Each response is assigned a number according to a pre-
specified rule
Makes sample data more representative of target
population on specific characteristics
Modifies number of cases in the sample that possess certain
characteristics
Adjusts the sample so that greater importance is attached to
respondents with certain characteristics
Statistically Adjusting the Data + Variable
Re-specification
Existing data is modified to create new variables
Large number of variables collapsed into fewer variables
Creates variables that are consistent with study objectives
Dummy variables are used (binary, dichotomous,
instrumental, quantitative variables)
Use (d-1) dummy variables to specify (d) levels of
qualitative variable
Statistically Adjusting the Data + Scale
Transformation
Scale values are manipulated to ensure comparability with
other scales
Standardization allows the researcher to compare variables
that have been measured using different types of scales
Variables are forced to have a mean of zero and a standard
deviation of one
Can be done only on interval or ratio scaled data
Consists of counting the number of cases that fall
into various categories
Use of Simple Tabulation
Determine empirical distribution (frequency
distribution) of the variable in question
Calculate summary statistics, particularly the
mean or percentages
Aid in "data cleaning" aspects
Reports the number of responses that each question
received
Organizes data into classes or groups of values
Shows number of observations that fall into each class
Can be illustrated simply as a number or as a percentage or
histogram
Response categories may be combined for many questions
Should result in categories with worthwhile number of
respondents
Statistics normally associated with a frequency
distribution to help summarize information in
the frequency table
Measures of central tendency mean, median
and mode
Measures of dispersion (range, standard
deviation, and coefficient of variation)
Measures of shape (skewness and kurtosis)
Differences between means or percentages of two
subgroup responses can provide insights
Difference between means is concerned with the
association between two questions
Question upon which means are based are
intervally scaled
Statistical analysis technique to study the
relationships among and between variables
Sample is divided to learn how the dependent
variable varies from subgroup to subgroup
Frequency distribution for each subgroup is
compared to the frequency distribution for the
total sample
The two variables that are analyzed must be
nominally scaled
Type of Data
 Classification of data involves nominal, ordinal, interval
and ratio scales of measurement
 Nominal scaling is restricted to the mode as the only
measure of central tendency
 Both median and mode can be used for ordinal scale
 Non-parametric tests can only be run on ordinal data
 Mean, median and mode can all be used to measure
central tendency for interval and ratio scaled data
Research Design
 Dependency of observations
 Number of observations per object
 Number of groups being analyzed
 Control exercised over variable of interest
Assumptions Underlying the Test Statistic
 If assumptions on which a statistical test is based are
violated, the test will provide meaningless results
Univariate Techniques




 Appropriate when there is a single measurement of each of the 'n'
sample objects or there are several measurements of each of the `n'
observations but each variable is analyzed in isolation
Nonmetric - measured on nominal or ordinal scale
Metric-measured on interval or ratio scale
Determine whether single or multiple samples are involved
For multiple samples, choice of statistical test depends on whether
the samples are independent or dependent
Multivariate Techniques

 A collection of procedures for analyzing association between two or
more sets of measurements that have been made on each object in
one or more samples of objects
Dependence or interdependence techniques
Multivariate Techniques (Contd.)
Dependence Techniques
One or more variables can be identified as dependent
variables and the remaining as independent variables
Choice of dependence technique depends on the number
of dependent variables involved in analysis
Interdependence Techniques
Whole set of interdependent relationships is examined
Further classified as having focus on variable or objects
Why use Multivariate Analysis?
To group variables or people or objects
To improve the ability to predict variables (such as
usage)
To understand relationships between variables (such
as advertising and sales)
Assumption (hypothesis) made about a population
parameter (not sample parameter)
Purpose of Hypothesis Testing
To make a judgement about the difference betweentwo
sample statistics or between sample statistic and a
hypothesized population parameter
Evidence has to be evaluated statistically before arriving
at a conclusion regarding the hypothesis.
The null hypothesis (Ho) is tested against the alternative
hypothesis (Ha).
At least the null hypothesis is stated.
Decide upon the criteria to be used in making the decision
whether to “reject” or "not reject" the null hypothesis.
The null hypothesis (Ho) is tested against the alternative
hypothesis (Ha).
At least the null hypothesis is stated.
Decide upon the criteria to be used in making the decision
whether to “reject” or "not reject" the null hypothesis.
Evidence has to be evaluated statistically before
arriving at a conclusion regarding the hypothesis
Depends on whether information generated from the
sample is with fewer or larger observations
Problem Definition
Clearly state the null and alternative
hypotheses.
Choose the relevant test
and the appropriate
probability distribution
Choose the critical value
Compare test statistic
and critical value
Reject null
Does the test statistic
fall in the critical
region?
Determine the
significance
level
Compute
relevant test
statistic
Determine the
degrees of
freedom
Decide if one-or
two-tailed test
Do not reject
null
(Contd.)
The Three Criteria Used Are
Significance Level
Degrees of Freedom
One or Two Tailed Test
Cross Tabulation & Chi-square Test
ANOVA – Analysis of Variance
Correlation Analysis
Regression Analysis
Factor Analysis
Cluster Analysis
L Scaling
Conjoint Analysis
Perceptual Maps
Complex analysis and big words impress people.
 Most people appreciate practical and understandable analyses.
Analysis comes at the end after all the data are
collected.
 We think about analysis upfront so that we HAVE the data we WANT to
analyze.
Quantitative analysis is the most accurate type of data
analysis.
 Some think numbers are more accurate than words but it is the
quality of the analysis process that matters.
Data have their own meaning.
 Data must be interpreted. Numbers do not speak for
themselves.
Stating limitations to the analysis weakens the
evaluation.
 All analyses have weaknesses; it is more honest and
responsible to acknowledge them.
Computer analysis is always easier and better.
 It depends upon the size of the data set and personal
competencies. For small sets of information, hand
tabulation may be more efficient
It involves:
2.
3.
4.
organizing the data
doing the calculations
interpreting the information
lessons learned
5. explaining limitations
Organize all forms/questionnaires in one place
Check for completeness and accuracy
Remove those that are incomplete or do not make
sense; keep a record of your decisions
Assign a unique identifier to each
form/questionnaire
By hand
By computer
 Excel (spreadsheet)
 Microsoft Access (database mngt)
 Quantitative analysis: SPSS (statistical software)
 Count (frequencies)
 Percentage
 Mean
 Mode
 Median
 Range
 Standard deviation
 Variance
 Ranking
 Cross tabulation
http://learningstore.uwex.edu/pdf/G3658-6.pdf
Do you want to know how many individuals
checked each answer?
Frequency
Do you want the proportion of people who
answered in a certain way?
Percentage
Do you want the average number or average
score?
Mean
Do you want the middle value in a range of values
or scores?
Median
Do you want to show the range in answers or
scores?
Range
Do you want to compare one group to another? Cross tab
Do you want to report changes from pre to post? Change score
Do you want to show the degree to which a
response varies from the mean?
Standard deviation
Numbers do not speak for themselves.
For example, what does it mean that 55 youth reported a
change in behavior. Or, 25% of participants rated the program
a 5 and 75% rated it a 4. What do these numbers mean?
Interpretation is the process of attaching meaning to the data.
Interpretation demands fair and careful judgments. Often the
same data can be interpreted in different ways. So, it is helpful
to involve others or take time to hear how different people
interpret the same information.
Think of ways you might do this…for example, hold a meeting with
key stakeholders to discuss the data; ask individual participants
what they think
What did you learn? – about the program, about the
participants, about the evaluation.
 Are there any ‘ah-has’? What is new? What was
expected?
 Were there findings that surprised you?
 Are there things you don’t understand very well – where
further study is needed?
We often include recommendations or an action plan. This
helps ensure that the results are used.
Written reports:
Be explicit about your limitations
Oral reports:
Be prepared to discuss limitations
Be honest about limitations
Know the claims you cannot make
 Do not claim causation without a true experimental
design
 Do not generalize to the population without random
sample and quality administration (e.g., <60%
response rate on a survey)
Incorrect denominator when calculating the
percentage
Do not average percentages
Using a single average that distorts or misrepresents
the range of information
New Product Research Process
Generation of new product concepts
Evaluation and development of those concepts
Evaluation and development of the actual products
Testing in the context of the marketing program
Need Identification





 Perceptual maps
Social and environmental trends
Benefit structure analysis
Product users
Focus-group interviews
Lead user analysis
Concept Identification
 Test Marketing
 Designing the sell-in market test
 Selecting the test cities
 Implementing and controlling the test
 Timing
 Measurement
 Costs of a test market
 Controlled Distribution Scanner Markets (CDSM)
Projecting Trial, Repeat and Usage Rate
Using
 Gabor and Grainger method
 Multi-brand choice method
Research for Profit-oriented Pricing
Research for Share-oriented Pricing
Warehouse and Retail Location Research
Center-of-gravity Simulation
Computerized Simulation Models
Catchment Area Analysis
Outlet Location Research
Number and Location of Sales
Representatives
Sales effort approach
Statistical analysis of sales data
Field experiments
Computerized models of sales force size and
allocation by market and by product line
Criteria
Recognition
Recall
Persuasion

 Forced exposure, brand preference
change
On-air tests -- brand preference change
Customized Measures of
Communication / Attitude
Purchase Behavior
Coupon stimulated purchasing
Split-cable tests
Tracking Studies
Diagnostic Testing
Copy Test Validity
Qualitative Research
Audience Impressions of the Ad
Adjective Checklist
Eye Movement
Physiological Measurement
Budget Decision
Media Research
Measuring print vehicle audiences
Measuring broadcast vehicles
audiences
Promotional Tools
Price Discounts
Features
Displays
Coupons / Rebates
Sweepstakes
Promotional Strategy
Hi-lo
Every Day Low Price (EDLP)
Assessing Competitive Advantage
Brand Equity
Measuring Brand Equity
Customer Satisfaction
Quality Management
Benchmarking
Market Intelligence

More Related Content

What's hot

An Introduction to Public Relations
An Introduction to Public RelationsAn Introduction to Public Relations
An Introduction to Public Relations
Kevin O'Doherty
 
Show Me the Money: PR Metrics that Impress the C-Suite
Show Me the Money: PR Metrics that Impress the C-SuiteShow Me the Money: PR Metrics that Impress the C-Suite
Show Me the Money: PR Metrics that Impress the C-Suite
Sandra Fathi
 
Digital marketing for college & university
Digital marketing for college & universityDigital marketing for college & university
Digital marketing for college & university
MindStairs Academy Private Limited
 
24687200 event-marketing-project
24687200 event-marketing-project24687200 event-marketing-project
24687200 event-marketing-projectyashwant434
 
The Real Annotated Bibliography!
The Real Annotated Bibliography!The Real Annotated Bibliography!
The Real Annotated Bibliography!Caren Valenciano
 
Event Marketing Notes for 2-1-17
Event Marketing Notes for 2-1-17Event Marketing Notes for 2-1-17
Event Marketing Notes for 2-1-17
Game Day Communications
 
Travelbuddy
TravelbuddyTravelbuddy
Travelbuddy
Aditya Gupta
 
360 Degree Digital Marketing Strategy - EBriks Infotech
360 Degree Digital Marketing Strategy - EBriks Infotech360 Degree Digital Marketing Strategy - EBriks Infotech
360 Degree Digital Marketing Strategy - EBriks Infotech
EBriks Infotech Pvt. Ltd.
 
Healthcare Marketing - Strategy Basics
Healthcare Marketing - Strategy BasicsHealthcare Marketing - Strategy Basics
Healthcare Marketing - Strategy Basics
Steve Patti
 
11th Annual B2B Content Marketing Benchmarks, Budgets, and Trends: Insights f...
11th Annual B2B Content Marketing Benchmarks, Budgets, and Trends: Insights f...11th Annual B2B Content Marketing Benchmarks, Budgets, and Trends: Insights f...
11th Annual B2B Content Marketing Benchmarks, Budgets, and Trends: Insights f...
Content Marketing Institute
 
Engagement marketing and wow experience
Engagement marketing and wow experienceEngagement marketing and wow experience
Engagement marketing and wow experience
snehal_152
 
Healthcare Digital Marketing: Planning Guide
Healthcare Digital Marketing: Planning GuideHealthcare Digital Marketing: Planning Guide
Healthcare Digital Marketing: Planning Guide
praemedica digital
 
The Five Elements of a Best-in-Class Integrated Campaign
The Five Elements of a Best-in-Class Integrated CampaignThe Five Elements of a Best-in-Class Integrated Campaign
The Five Elements of a Best-in-Class Integrated Campaign
G3 Communications
 
Marketing Communications Planning Guide
Marketing Communications Planning GuideMarketing Communications Planning Guide
Marketing Communications Planning Guide
Mike Sullivan
 
Strategic Digital Marketing Planning Framework
Strategic Digital Marketing Planning FrameworkStrategic Digital Marketing Planning Framework
Strategic Digital Marketing Planning Framework
Andy Lima
 
Nonprofit Content Marketing - 2015 Benchmarks, Budgets and Trends - North Ame...
Nonprofit Content Marketing - 2015 Benchmarks, Budgets and Trends - North Ame...Nonprofit Content Marketing - 2015 Benchmarks, Budgets and Trends - North Ame...
Nonprofit Content Marketing - 2015 Benchmarks, Budgets and Trends - North Ame...Content Marketing Institute
 
LT7058 Events Marketing lecture Week 9
LT7058 Events Marketing lecture Week 9 LT7058 Events Marketing lecture Week 9
LT7058 Events Marketing lecture Week 9
Thomas Lunt
 
LT7058 Events Marketing Week 3
LT7058  Events Marketing Week 3LT7058  Events Marketing Week 3
LT7058 Events Marketing Week 3
Thomas Lunt
 
#PRlife | Texas A&M University
#PRlife | Texas A&M University#PRlife | Texas A&M University
#PRlife | Texas A&M University
MMI Agency
 

What's hot (20)

An Introduction to Public Relations
An Introduction to Public RelationsAn Introduction to Public Relations
An Introduction to Public Relations
 
Show Me the Money: PR Metrics that Impress the C-Suite
Show Me the Money: PR Metrics that Impress the C-SuiteShow Me the Money: PR Metrics that Impress the C-Suite
Show Me the Money: PR Metrics that Impress the C-Suite
 
Digital marketing for college & university
Digital marketing for college & universityDigital marketing for college & university
Digital marketing for college & university
 
24687200 event-marketing-project
24687200 event-marketing-project24687200 event-marketing-project
24687200 event-marketing-project
 
The Real Annotated Bibliography!
The Real Annotated Bibliography!The Real Annotated Bibliography!
The Real Annotated Bibliography!
 
Event Marketing Notes for 2-1-17
Event Marketing Notes for 2-1-17Event Marketing Notes for 2-1-17
Event Marketing Notes for 2-1-17
 
Travelbuddy
TravelbuddyTravelbuddy
Travelbuddy
 
360 Degree Digital Marketing Strategy - EBriks Infotech
360 Degree Digital Marketing Strategy - EBriks Infotech360 Degree Digital Marketing Strategy - EBriks Infotech
360 Degree Digital Marketing Strategy - EBriks Infotech
 
Imc unit 4
Imc unit 4Imc unit 4
Imc unit 4
 
Healthcare Marketing - Strategy Basics
Healthcare Marketing - Strategy BasicsHealthcare Marketing - Strategy Basics
Healthcare Marketing - Strategy Basics
 
11th Annual B2B Content Marketing Benchmarks, Budgets, and Trends: Insights f...
11th Annual B2B Content Marketing Benchmarks, Budgets, and Trends: Insights f...11th Annual B2B Content Marketing Benchmarks, Budgets, and Trends: Insights f...
11th Annual B2B Content Marketing Benchmarks, Budgets, and Trends: Insights f...
 
Engagement marketing and wow experience
Engagement marketing and wow experienceEngagement marketing and wow experience
Engagement marketing and wow experience
 
Healthcare Digital Marketing: Planning Guide
Healthcare Digital Marketing: Planning GuideHealthcare Digital Marketing: Planning Guide
Healthcare Digital Marketing: Planning Guide
 
The Five Elements of a Best-in-Class Integrated Campaign
The Five Elements of a Best-in-Class Integrated CampaignThe Five Elements of a Best-in-Class Integrated Campaign
The Five Elements of a Best-in-Class Integrated Campaign
 
Marketing Communications Planning Guide
Marketing Communications Planning GuideMarketing Communications Planning Guide
Marketing Communications Planning Guide
 
Strategic Digital Marketing Planning Framework
Strategic Digital Marketing Planning FrameworkStrategic Digital Marketing Planning Framework
Strategic Digital Marketing Planning Framework
 
Nonprofit Content Marketing - 2015 Benchmarks, Budgets and Trends - North Ame...
Nonprofit Content Marketing - 2015 Benchmarks, Budgets and Trends - North Ame...Nonprofit Content Marketing - 2015 Benchmarks, Budgets and Trends - North Ame...
Nonprofit Content Marketing - 2015 Benchmarks, Budgets and Trends - North Ame...
 
LT7058 Events Marketing lecture Week 9
LT7058 Events Marketing lecture Week 9 LT7058 Events Marketing lecture Week 9
LT7058 Events Marketing lecture Week 9
 
LT7058 Events Marketing Week 3
LT7058  Events Marketing Week 3LT7058  Events Marketing Week 3
LT7058 Events Marketing Week 3
 
#PRlife | Texas A&M University
#PRlife | Texas A&M University#PRlife | Texas A&M University
#PRlife | Texas A&M University
 

Similar to MARKETING RESEARCH

Marketing Research
Marketing ResearchMarketing Research
Marketing Research
NANDA KISHORE SETHURAMAN
 
Marketing Planning
Marketing PlanningMarketing Planning
Marketing Planningnvkhoi
 
Principles of Marketing Lesson 7_Marketing Information and Research.pptx
Principles of Marketing Lesson 7_Marketing Information and Research.pptxPrinciples of Marketing Lesson 7_Marketing Information and Research.pptx
Principles of Marketing Lesson 7_Marketing Information and Research.pptx
RalphNavelino3
 
Market research
Market researchMarket research
Market research
Rambabu Ram M
 
Management research
Management researchManagement research
Management research
smumbahelp
 
NATURE & SCOPE OF MARKETING RESEARCH
NATURE & SCOPE OF MARKETING RESEARCHNATURE & SCOPE OF MARKETING RESEARCH
NATURE & SCOPE OF MARKETING RESEARCHSagar Anand
 
Marketing (chapter 4)(1).pptx
Marketing (chapter 4)(1).pptxMarketing (chapter 4)(1).pptx
Marketing (chapter 4)(1).pptx
shahnazsharmin2
 
Pcc mktg 25 chapter 2
Pcc mktg 25 chapter 2Pcc mktg 25 chapter 2
Pcc mktg 25 chapter 2
Magiel Amora
 
Marketing research
Marketing researchMarketing research
Marketing research
Lijin Mathew
 
Introduction to marketing research
Introduction to marketing researchIntroduction to marketing research
Introduction to marketing research
Vyas Ashutosh
 
Marketing research
Marketing researchMarketing research
Marketing research
Vaibhav Dixit
 
Importance of research in developing a marketing strategy.pdf
Importance of research in developing a marketing strategy.pdfImportance of research in developing a marketing strategy.pdf
Importance of research in developing a marketing strategy.pdf
Nepal Realistic Solution Pvt. Ltd.
 
Introduction to Market Research
Introduction to Market ResearchIntroduction to Market Research
Introduction to Market ResearchKan K.
 
Mis
MisMis
Marketing research
Marketing researchMarketing research
Marketing research
Manish Parihar
 
CHAPTER 04 The IMC Planning Process.pptx
CHAPTER 04 The IMC Planning Process.pptxCHAPTER 04 The IMC Planning Process.pptx
CHAPTER 04 The IMC Planning Process.pptx
SadmanMuntasir
 
Market Research
Market Research Market Research
Market Research
Arun Khedwal
 
Mba – marketing management
Mba – marketing managementMba – marketing management
Mba – marketing management
Babasab Patil
 
1 Market Research (1).doc
1 Market Research (1).doc1 Market Research (1).doc
1 Market Research (1).doc
MominKhurram
 

Similar to MARKETING RESEARCH (20)

Marketing Research
Marketing ResearchMarketing Research
Marketing Research
 
Marketing Planning
Marketing PlanningMarketing Planning
Marketing Planning
 
Principles of Marketing Lesson 7_Marketing Information and Research.pptx
Principles of Marketing Lesson 7_Marketing Information and Research.pptxPrinciples of Marketing Lesson 7_Marketing Information and Research.pptx
Principles of Marketing Lesson 7_Marketing Information and Research.pptx
 
Attachments 2012 06_18
Attachments 2012 06_18Attachments 2012 06_18
Attachments 2012 06_18
 
Market research
Market researchMarket research
Market research
 
Management research
Management researchManagement research
Management research
 
NATURE & SCOPE OF MARKETING RESEARCH
NATURE & SCOPE OF MARKETING RESEARCHNATURE & SCOPE OF MARKETING RESEARCH
NATURE & SCOPE OF MARKETING RESEARCH
 
Marketing (chapter 4)(1).pptx
Marketing (chapter 4)(1).pptxMarketing (chapter 4)(1).pptx
Marketing (chapter 4)(1).pptx
 
Pcc mktg 25 chapter 2
Pcc mktg 25 chapter 2Pcc mktg 25 chapter 2
Pcc mktg 25 chapter 2
 
Marketing research
Marketing researchMarketing research
Marketing research
 
Introduction to marketing research
Introduction to marketing researchIntroduction to marketing research
Introduction to marketing research
 
Marketing research
Marketing researchMarketing research
Marketing research
 
Importance of research in developing a marketing strategy.pdf
Importance of research in developing a marketing strategy.pdfImportance of research in developing a marketing strategy.pdf
Importance of research in developing a marketing strategy.pdf
 
Introduction to Market Research
Introduction to Market ResearchIntroduction to Market Research
Introduction to Market Research
 
Mis
MisMis
Mis
 
Marketing research
Marketing researchMarketing research
Marketing research
 
CHAPTER 04 The IMC Planning Process.pptx
CHAPTER 04 The IMC Planning Process.pptxCHAPTER 04 The IMC Planning Process.pptx
CHAPTER 04 The IMC Planning Process.pptx
 
Market Research
Market Research Market Research
Market Research
 
Mba – marketing management
Mba – marketing managementMba – marketing management
Mba – marketing management
 
1 Market Research (1).doc
1 Market Research (1).doc1 Market Research (1).doc
1 Market Research (1).doc
 

More from aishuprabhayadav90

MATERIAL HANDLING
MATERIAL HANDLINGMATERIAL HANDLING
MATERIAL HANDLING
aishuprabhayadav90
 
MARKETING
MARKETINGMARKETING
FINANCIAL MANAGEMENT
FINANCIAL MANAGEMENTFINANCIAL MANAGEMENT
FINANCIAL MANAGEMENT
aishuprabhayadav90
 
MANAGERIAL ECONOMICS
MANAGERIAL ECONOMICSMANAGERIAL ECONOMICS
MANAGERIAL ECONOMICS
aishuprabhayadav90
 
Promoting events through social media
Promoting events through social mediaPromoting events through social media
Promoting events through social media
aishuprabhayadav90
 
EMOTIONS ON CONSUMER DECISION-MAKING IN FMCG SECTOR AISH
EMOTIONS ON  CONSUMER DECISION-MAKING IN FMCG SECTOR  AISHEMOTIONS ON  CONSUMER DECISION-MAKING IN FMCG SECTOR  AISH
EMOTIONS ON CONSUMER DECISION-MAKING IN FMCG SECTOR AISH
aishuprabhayadav90
 
Impact of Workplace Conflict Resolution on Organizational Performance Aish h...
Impact of Workplace Conflict Resolution on Organizational Performance  Aish h...Impact of Workplace Conflict Resolution on Organizational Performance  Aish h...
Impact of Workplace Conflict Resolution on Organizational Performance Aish h...
aishuprabhayadav90
 
Aishh mm
Aishh mmAishh mm
WORKER PARTICIPATION M.phil ppt 1 UNIVERSITY OF MADRAS
WORKER PARTICIPATION M.phil ppt 1 UNIVERSITY OF MADRAS WORKER PARTICIPATION M.phil ppt 1 UNIVERSITY OF MADRAS
WORKER PARTICIPATION M.phil ppt 1 UNIVERSITY OF MADRAS
aishuprabhayadav90
 

More from aishuprabhayadav90 (9)

MATERIAL HANDLING
MATERIAL HANDLINGMATERIAL HANDLING
MATERIAL HANDLING
 
MARKETING
MARKETINGMARKETING
MARKETING
 
FINANCIAL MANAGEMENT
FINANCIAL MANAGEMENTFINANCIAL MANAGEMENT
FINANCIAL MANAGEMENT
 
MANAGERIAL ECONOMICS
MANAGERIAL ECONOMICSMANAGERIAL ECONOMICS
MANAGERIAL ECONOMICS
 
Promoting events through social media
Promoting events through social mediaPromoting events through social media
Promoting events through social media
 
EMOTIONS ON CONSUMER DECISION-MAKING IN FMCG SECTOR AISH
EMOTIONS ON  CONSUMER DECISION-MAKING IN FMCG SECTOR  AISHEMOTIONS ON  CONSUMER DECISION-MAKING IN FMCG SECTOR  AISH
EMOTIONS ON CONSUMER DECISION-MAKING IN FMCG SECTOR AISH
 
Impact of Workplace Conflict Resolution on Organizational Performance Aish h...
Impact of Workplace Conflict Resolution on Organizational Performance  Aish h...Impact of Workplace Conflict Resolution on Organizational Performance  Aish h...
Impact of Workplace Conflict Resolution on Organizational Performance Aish h...
 
Aishh mm
Aishh mmAishh mm
Aishh mm
 
WORKER PARTICIPATION M.phil ppt 1 UNIVERSITY OF MADRAS
WORKER PARTICIPATION M.phil ppt 1 UNIVERSITY OF MADRAS WORKER PARTICIPATION M.phil ppt 1 UNIVERSITY OF MADRAS
WORKER PARTICIPATION M.phil ppt 1 UNIVERSITY OF MADRAS
 

Recently uploaded

My Personal Brand Exploration by Mariano
My Personal Brand Exploration by MarianoMy Personal Brand Exploration by Mariano
My Personal Brand Exploration by Mariano
marianooscos
 
Your Path to Profits - The Game-Changing Power of a Marketing OS for Your Bus...
Your Path to Profits - The Game-Changing Power of a Marketing OS for Your Bus...Your Path to Profits - The Game-Changing Power of a Marketing OS for Your Bus...
Your Path to Profits - The Game-Changing Power of a Marketing OS for Your Bus...
DigiMarCon - Digital Marketing, Media and Advertising Conferences & Exhibitions
 
Marketing as a Primary Revenue Driver - Lee Levitt
Marketing as a Primary Revenue Driver - Lee LevittMarketing as a Primary Revenue Driver - Lee Levitt
BLOOM_May2024 (r). Balmer Lawrie Online Monthly Bulletin
BLOOM_May2024 (r). Balmer Lawrie Online Monthly BulletinBLOOM_May2024 (r). Balmer Lawrie Online Monthly Bulletin
BLOOM_May2024 (r). Balmer Lawrie Online Monthly Bulletin
BalmerLawrie
 
Your Path to Profits - The Game-Changing Power of a Marketing - Daniel Bussius
Your Path to Profits - The Game-Changing Power of a Marketing - Daniel BussiusYour Path to Profits - The Game-Changing Power of a Marketing - Daniel Bussius
Your Path to Profits - The Game-Changing Power of a Marketing - Daniel Bussius
DigiMarCon - Digital Marketing, Media and Advertising Conferences & Exhibitions
 
De-risk Your Digital Evolution - Hannah Grap
De-risk Your Digital Evolution - Hannah GrapDe-risk Your Digital Evolution - Hannah Grap
Coca Cola Branding Strategy and strategic marketing plan
Coca Cola Branding Strategy and strategic marketing planCoca Cola Branding Strategy and strategic marketing plan
Coca Cola Branding Strategy and strategic marketing plan
Maswer Ali
 
Digital Marketing Trends - Experts Insights on How to Gain a Competitive Edge
Digital Marketing Trends - Experts Insights on How to Gain a Competitive EdgeDigital Marketing Trends - Experts Insights on How to Gain a Competitive Edge
Digital Marketing Trends - Experts Insights on How to Gain a Competitive Edge
DigiMarCon - Digital Marketing, Media and Advertising Conferences & Exhibitions
 
DMF Portfolio Piece Smart Goals - Artist Management.docx
DMF Portfolio Piece Smart Goals - Artist Management.docxDMF Portfolio Piece Smart Goals - Artist Management.docx
DMF Portfolio Piece Smart Goals - Artist Management.docx
TravisMalana
 
Digital Marketing Trends - Experts Insights on How
Digital Marketing Trends - Experts Insights on HowDigital Marketing Trends - Experts Insights on How
5 Big Bets for 2024 - Jamie A. Lee, Stripes Co
5 Big Bets for 2024 - Jamie A. Lee, Stripes Co5 Big Bets for 2024 - Jamie A. Lee, Stripes Co
Search Engine Marketing - Competitor and Keyword research
Search Engine Marketing  - Competitor and Keyword researchSearch Engine Marketing  - Competitor and Keyword research
Search Engine Marketing - Competitor and Keyword research
ETMARK ACADEMY
 
Monthly Social Media News Update May 2024
Monthly Social Media News Update May 2024Monthly Social Media News Update May 2024
Monthly Social Media News Update May 2024
Andy Lambert
 
10 Videos Any Business Can Make Right Now! - Shelly Nathan
10 Videos Any Business Can Make Right Now! - Shelly Nathan10 Videos Any Business Can Make Right Now! - Shelly Nathan
10 Videos Any Business Can Make Right Now! - Shelly Nathan
DigiMarCon - Digital Marketing, Media and Advertising Conferences & Exhibitions
 
The New Era Of SEO - How AI Has Changed SEO Forever - Danny Leibrandt
The New Era Of SEO - How AI Has Changed SEO Forever - Danny LeibrandtThe New Era Of SEO - How AI Has Changed SEO Forever - Danny Leibrandt
The New Era Of SEO - How AI Has Changed SEO Forever - Danny Leibrandt
DigiMarCon - Digital Marketing, Media and Advertising Conferences & Exhibitions
 
Core Web Vitals SEO Workshop - improve your performance [pdf]
Core Web Vitals SEO Workshop - improve your performance [pdf]Core Web Vitals SEO Workshop - improve your performance [pdf]
Core Web Vitals SEO Workshop - improve your performance [pdf]
Peter Mead
 
Turn Digital Reputation Threats into Offense Tactics - Daniel Lemin
Turn Digital Reputation Threats into Offense Tactics - Daniel LeminTurn Digital Reputation Threats into Offense Tactics - Daniel Lemin
Turn Digital Reputation Threats into Offense Tactics - Daniel Lemin
DigiMarCon - Digital Marketing, Media and Advertising Conferences & Exhibitions
 
Digital Money Maker Club – von Gunnar Kessler digital.
Digital Money Maker Club – von Gunnar Kessler digital.Digital Money Maker Club – von Gunnar Kessler digital.
Digital Money Maker Club – von Gunnar Kessler digital.
focsh890
 
Marketing Management Notes Philip Kotler
Marketing Management Notes Philip KotlerMarketing Management Notes Philip Kotler
Marketing Management Notes Philip Kotler
LaveenaShanker
 
Unknown to Unforgettable - The Art and Science to Being Irresistible on Camer...
Unknown to Unforgettable - The Art and Science to Being Irresistible on Camer...Unknown to Unforgettable - The Art and Science to Being Irresistible on Camer...
Unknown to Unforgettable - The Art and Science to Being Irresistible on Camer...
DigiMarCon - Digital Marketing, Media and Advertising Conferences & Exhibitions
 

Recently uploaded (20)

My Personal Brand Exploration by Mariano
My Personal Brand Exploration by MarianoMy Personal Brand Exploration by Mariano
My Personal Brand Exploration by Mariano
 
Your Path to Profits - The Game-Changing Power of a Marketing OS for Your Bus...
Your Path to Profits - The Game-Changing Power of a Marketing OS for Your Bus...Your Path to Profits - The Game-Changing Power of a Marketing OS for Your Bus...
Your Path to Profits - The Game-Changing Power of a Marketing OS for Your Bus...
 
Marketing as a Primary Revenue Driver - Lee Levitt
Marketing as a Primary Revenue Driver - Lee LevittMarketing as a Primary Revenue Driver - Lee Levitt
Marketing as a Primary Revenue Driver - Lee Levitt
 
BLOOM_May2024 (r). Balmer Lawrie Online Monthly Bulletin
BLOOM_May2024 (r). Balmer Lawrie Online Monthly BulletinBLOOM_May2024 (r). Balmer Lawrie Online Monthly Bulletin
BLOOM_May2024 (r). Balmer Lawrie Online Monthly Bulletin
 
Your Path to Profits - The Game-Changing Power of a Marketing - Daniel Bussius
Your Path to Profits - The Game-Changing Power of a Marketing - Daniel BussiusYour Path to Profits - The Game-Changing Power of a Marketing - Daniel Bussius
Your Path to Profits - The Game-Changing Power of a Marketing - Daniel Bussius
 
De-risk Your Digital Evolution - Hannah Grap
De-risk Your Digital Evolution - Hannah GrapDe-risk Your Digital Evolution - Hannah Grap
De-risk Your Digital Evolution - Hannah Grap
 
Coca Cola Branding Strategy and strategic marketing plan
Coca Cola Branding Strategy and strategic marketing planCoca Cola Branding Strategy and strategic marketing plan
Coca Cola Branding Strategy and strategic marketing plan
 
Digital Marketing Trends - Experts Insights on How to Gain a Competitive Edge
Digital Marketing Trends - Experts Insights on How to Gain a Competitive EdgeDigital Marketing Trends - Experts Insights on How to Gain a Competitive Edge
Digital Marketing Trends - Experts Insights on How to Gain a Competitive Edge
 
DMF Portfolio Piece Smart Goals - Artist Management.docx
DMF Portfolio Piece Smart Goals - Artist Management.docxDMF Portfolio Piece Smart Goals - Artist Management.docx
DMF Portfolio Piece Smart Goals - Artist Management.docx
 
Digital Marketing Trends - Experts Insights on How
Digital Marketing Trends - Experts Insights on HowDigital Marketing Trends - Experts Insights on How
Digital Marketing Trends - Experts Insights on How
 
5 Big Bets for 2024 - Jamie A. Lee, Stripes Co
5 Big Bets for 2024 - Jamie A. Lee, Stripes Co5 Big Bets for 2024 - Jamie A. Lee, Stripes Co
5 Big Bets for 2024 - Jamie A. Lee, Stripes Co
 
Search Engine Marketing - Competitor and Keyword research
Search Engine Marketing  - Competitor and Keyword researchSearch Engine Marketing  - Competitor and Keyword research
Search Engine Marketing - Competitor and Keyword research
 
Monthly Social Media News Update May 2024
Monthly Social Media News Update May 2024Monthly Social Media News Update May 2024
Monthly Social Media News Update May 2024
 
10 Videos Any Business Can Make Right Now! - Shelly Nathan
10 Videos Any Business Can Make Right Now! - Shelly Nathan10 Videos Any Business Can Make Right Now! - Shelly Nathan
10 Videos Any Business Can Make Right Now! - Shelly Nathan
 
The New Era Of SEO - How AI Has Changed SEO Forever - Danny Leibrandt
The New Era Of SEO - How AI Has Changed SEO Forever - Danny LeibrandtThe New Era Of SEO - How AI Has Changed SEO Forever - Danny Leibrandt
The New Era Of SEO - How AI Has Changed SEO Forever - Danny Leibrandt
 
Core Web Vitals SEO Workshop - improve your performance [pdf]
Core Web Vitals SEO Workshop - improve your performance [pdf]Core Web Vitals SEO Workshop - improve your performance [pdf]
Core Web Vitals SEO Workshop - improve your performance [pdf]
 
Turn Digital Reputation Threats into Offense Tactics - Daniel Lemin
Turn Digital Reputation Threats into Offense Tactics - Daniel LeminTurn Digital Reputation Threats into Offense Tactics - Daniel Lemin
Turn Digital Reputation Threats into Offense Tactics - Daniel Lemin
 
Digital Money Maker Club – von Gunnar Kessler digital.
Digital Money Maker Club – von Gunnar Kessler digital.Digital Money Maker Club – von Gunnar Kessler digital.
Digital Money Maker Club – von Gunnar Kessler digital.
 
Marketing Management Notes Philip Kotler
Marketing Management Notes Philip KotlerMarketing Management Notes Philip Kotler
Marketing Management Notes Philip Kotler
 
Unknown to Unforgettable - The Art and Science to Being Irresistible on Camer...
Unknown to Unforgettable - The Art and Science to Being Irresistible on Camer...Unknown to Unforgettable - The Art and Science to Being Irresistible on Camer...
Unknown to Unforgettable - The Art and Science to Being Irresistible on Camer...
 

MARKETING RESEARCH

  • 2.
  • 3. BI is the ability to access data from multiple sources within and outside an organization for the purpose of analysis. It links the disparate operation systems to the end users of the data, thus creating an environment with free flow of information. It offers a reliable barometer of the business performance.
  • 5. MI focuses on the use of information as a source of strategic advantage. Need to have a thorough knowledge of customers, their attitudes, tastes and preferences. Need to analyze competition for benchmarking and making price, product, market and segment decisions.
  • 6. A continuing and interacting structure of people, equipment and procedures designed to gather, sort, analyze, evaluate, and distribute pertinent, timely and accurate information to marketing decision making MIS Uses 3 Types of Information    Recurring market and accounting data from market analysis and accounting activities Intelligence relevant to future strategy of business Marketing research studies not of a recurring nature
  • 7. Four Stages of Market Planning Process     Situation analysis Strategy development Marketing program development Implementation
  • 8. Analysis of  Market environment  Market characteristics  Consumer behavior Research Approaches  Organize information obtained from prior studies (secondary)  Focus groups
  • 9. Market Research provides information to assist management with three critical decisions  What business should we be in?  How will we compete?  What are the objectives for the business?
  • 10. Programs embrace specific tasks Action program usually focuses on a single objective in support of one element of overall business strategy
  • 11. Starts with decision to proceed to a new program or strategy Commitment to objectives, budgets and timetables Specific measurable objectives must be set for all elements of marketing program "Did the elements achieve their objectives?" “Should the marketing program be continued, discontinued, revised or expanded?"
  • 12. Relevance Type and Nature of Information Sought Timing Availability of Resources Cost-benefit Analysis
  • 13. Situation Analysis Strategy Development Marketing Program Development Implementation Define the business scope and served market segments Establish competitive advantages Set performance objectives. Product and channel decision Communication decisions Pricing Personal selling decisions Performance monitoring Refining strategies and program
  • 14. Hispanics account for nearly 13% of the U.S. population. Research shows that Latino households spend $600 billion of $1.3 trillion purchasing power of multicultural population. In 1998 only 2.5% of total advertising dollars in the United States was focused on Latinos. By 2050, Hispanic population would represent 25% of US population. Who can tell me what the problem is?
  • 15. Programmatic Research Develops market options through market segmentation, market opportunity analysis, or consumer attitude and product usage studies Selective Research Tests different decision alternatives such as new product testing, advertising copy testing, pre-test marketing, and test marketing Evaluative Research Evaluation of performance ofprograms
  • 16. DSS models are developed and adapted to support each firms own decision problems Used to retrieve data, transform it into usable information, and disseminate it to users Allow managers to interact directly with database To retrieve information Provides a modeling function to help interpret information retrieved
  • 17. Combines marketing data from diverse sources into a single database, enabling product managers, sales planners, market researchers, financial analysts, and production schedulers to share information.
  • 18. Managers’ needs for decision relevant information: Routine comparisons of current performance against past trends on each of the key measures of effectiveness Periodic exception reports to assess which sales territories or accounts have not matched previous years’ purchases Special analyses to evaluate the sales impact of particular marketing programs, and to predict what would happen if changes were made.
  • 19. Marketing Decision Support Systems Contd.. Interactive Flexible Discovery oriented User friendly
  • 20. Marketing Decision Support Systems Database Reports and Displays Analysis capabilities Models
  • 22. Information Suppliers: Inside Company Information Suppliers: Outside Company Information Users • General management • Planning • Marketing and sales managers • Product managers • Lawyers • Marketing research department • Sales analysis group • Accounting department • Corporate strategic planning • Research consultants • Marketing research suppliers • Advertising agencies
  • 23.
  • 24. MR Process Evolves From Answers to Five Key Questions Why should we do research? What research should be done? Is it worth doing the research? How should the research be designed to achieve the research objectives? What will we do with the research?
  • 25. Planning system • Strategic plans • Tactical plans Information system • Databases • DSS 1. AGREE ON RESEARCH PROCESS • Problems or opportunities • Decision alternatives • Research users
  • 26. 2. ESTABLISH RESEARCH OBJECTIVES • Problems or opportunities • Decision alternatives • Research users Estimate the value of information Do not conduct marketing research NO Is benefit > cost Yes
  • 27. • Problems or opportunities • Decision alternatives • Research users 5. COLLECT THE DATA 1. REPORT THE RESEARCH RESULTS AND PROVIDE STRATEGIC RECOMMENDATIONS 6. PREPARE AND ANALYZE THE DATA Yes
  • 28. Marketing research process is consistent for both domestic and international markets Variety of market environments affect international marketing research process
  • 29. Economic Environment Social-cultural Environment Political and Legal Environment Technological, Multimedia and Infrastructural Facilities
  • 30. Step 1 Research Purpose    Problem or opportunity analysis Which problems or opportunities areanticipated What is the scope of the problems and the possiblereasons? Evaluation of decision alternatives What are the alternatives beingstudied? What are the criteria for choosing among thealternatives? Research users Who are the decisionmakers? Are there any covertpurposes?
  • 31. Kroger Co. is adding five new Signature stores in Houston. More than 1,000 questionnaires were sent to targeted area residents asking what kind of features the respondents (or future customers) would like to see included in a new supermarket in their neighborhood. Based on the surveys, Kroger added several variations:  A larger selection of wines  A sit-down coffee bar  The largest all-natural food section  U-Scan Express aisles
  • 32. Step 2 Research Objective   A statement, in as precise terminology as possible, of what information is needed Should be framed to ensure information obtained will satisfy research purpose Research Question Hypothesis Development Research Boundaries
  • 33. Research Question Asks what specific information is required to achieve the research purpose Sample questions to determine if a specific advertisement should be run: Will the advertisement be noticed? Will it be interpreted accurately? Will it influence attitudes?
  • 34. Hypothesis Development  A possible answer to a research question. Generating a hypothesis  Draw on previous research efforts  Borrow from other disciplines such as: Psychology Sociology Marketing Economics  Manager’s experience with related problems, coupled with knowledge and the use of judgment
  • 35. • Theory • Management experience • Exploratory research Research Question Hypothesis Research Purpose Research Design Research Objective
  • 36. Marketing Research 8th Edition Aaker, Kumar, Day Step 3 Estimating the Value of Information  Value depends on: Importance ofdecision Uncertainty that surroundsit Influence of research information on thedecision
  • 37. Product A $ 4 million $ 1 million $ 4 million -$ 2.5 million Success Success Failure Failure Introduce Do not Introduce Do not Introduce Product B
  • 38. Avoid mistakes:  Profile you target customers and clients  Interview target segments to assess how well they match your preconceived ideas  Hire local researchers  Use a variety of methods to get a well-rounded picture Qualitativemethods Quantitativemethods  Look at the findings and analyze what must be done differently, abroad or internationally, in comparison with current domestic marketing activities
  • 39. Possible questions:  Do opportunities exist for entry into foreign markets?  Which foreign markets warrant detailed investigation?  What are the major economic, political, legal, and other environmental facts in each potential country?  What mode of entry does the company plan to adopt?  What is the market potential in these countries?  Who are the firm’s present and potential customers?  What is the nature of competition in the foreign market?  What kind of strategy should the firm adopt?
  • 40.
  • 41. Research Design  The detailed blueprint to guide the implementation of a research study toward the realization of its objectives
  • 42. Exploratory Research  Used when seeking insights into the general nature of a problem, the possible decision alternatives, and the relevant variables that need to be considered
  • 43. Descriptive Research  Provides an accurate snapshot of some aspect of the market environment, such as: The proportion of the adult population that supports the United Fund Consumer evaluation of the attributes of our productversus competing products. The socioeconomic and demographic characteristics of the readership of a magazine The proportion of all possible outlets that are carrying, displaying, or merchandising our products
  • 44. Causal Research  Used when it is necessary to show that one variable causes or determines the values of other variables, a causal research approach must be used
  • 45. Uses Combination of All Three Research Techniques Exploratory techniques generate all possible reasons for a problem Descriptive and Causal approaches narrow the possible causes
  • 47. Relationship between Data Collection Method and Category of Research Category of Research CausalData Collection Method Exploratory Descriptive Secondary Sources Information System a b Databanks of other organizations Syndicated Services a a b b b a b Primary Sources Qualitative Research Surveys Experiments b a b b a
  • 48. Once the research approach has been chosen: Develop:  The specifics of measurements  Plan for choosing the sample  Methods of analysis  Analysis of value versus cost and time involved
  • 49. Determining Information Requirements Consider level and type of decision for which research is conducted Two types of decisions  Strategic  Tactical
  • 50. Global Strategic Decision Mostly made at corporate headquarters Information required is governed by overall company objectives Implies long term survival of company Deal with macro environment
  • 51. Tactical Decisions Concerned with micro-level implementation issues Information obtained from primary data Concerned with marketing mix strategy for country/product markets Made at functional or subsidiary level
  • 52. Unit of Analysis Researcher must decide at what level the analysis is done    Global level All countries takensimultaneously Regional level Groups of countries considered homogeneous formacro environmental factors Country level Each country taken as separateunit
  • 53. Construct Equivalence Deals with how both the researcher and the subjects see, understand, and code a particular phenomenon "Are we studying the same phenomenon in countries X and Y?"
  • 54. Measurement Equivalence Deals with the methods and procedures used by the researcher to collect and categorize essential data and information Are the phenomenon in countries X and Y measured the same way?"
  • 55. Sampling Equivalence "Are the samples used in countries X and Y equivalent?"
  • 56. Two Components of Errors  Sampling error  Non-sampling error Sampling Error  Difference between a measure obtained from a sample of population and the true measure that can be obtained only from the entire population Nonsampling Error  All other errors associated with a research project
  • 57. Design Errors Flaws in research design Selection Error Population Specification Error Sampling Frame Error Surrogate Information Error Measurement Error Experimental Error Data Analysis Error
  • 58. Administering Errors Occur during the administration of a survey instrument to the respondents  Questioning Error  Recording Error  Interference Error
  • 59. Response Error  Occur when respondent provides inaccurate answers to survey questions Non-response Error  Occurs if Some members of sample not contacted Some members provide incomplete or no response to survey instrument
  • 60. Describes a plan for conducting and controlling a research project Basis for a written contract between manager and researcher Basis for a vehicle for reviewing important decisions Used to choose among competing supplies and influence decision to fund study
  • 61. Executive Summary Purpose and Scope Objectives Research Approach Time and Cost Estimates Appendices
  • 62.
  • 64. DATA SOURCES SECONDARY DATA SOURCES PRIMARY DATA SOURCES INTERNAL RECORDS EXTERNAL SOURCES PUBLISHED DATA STANDARDIZED SOURCES OF MARKETING DATA INTERNET ELECTRONIC PRINTED •STORE AUDITS •WAREHOUSE WITHDRAWAL SERVICES •CONSUMER PURCHASE PANELS •SINGLE SOURCE DATA •NIELSEN’S TELEVISION INDEX •STARCH SCORES •ARBITRON PANEL •MULTIMEDIA SERVICES •SALES/PATRONAGE RESULTS ( OUTCOMES ) •MARKETING ACTIVITY ( INPUTS ) •COST INFORMATION •DISTRIBUTOR REPORTS AND FEEDBACK •CUSTOMER FEEDBACK •GOVERNMENT •TRADE ASSOCIATIONS •PERIODICALS •NEWSPAPERS •BOOKS •ANNUAL REPORTS •PRIVATE STUDIES Sources of Secondary Data
  • 65. Can solve the problem on hand all by its own Can lead to new ideas and other sources Helps to define the problem more clearly Can help in designing the primary data collections process Helps in defining the population / sample Can serve as a reference base
  • 66. Low cost Less effort Less time At times, more accurate At times, only way to obtain data Collected for some other purpose No control over data collection May not be accurate May not be in correct form May be outdated May not meet data requirements Assumptions have to be made Benefits Limitations
  • 67. Internal Records Accounting Data Sales Reports Inventory Management Customer Database
  • 68. Published data sources (e.G., Census, publications of various trade associations) Trade directories Computer retrievable databases ("online" databases)
  • 69. Based on the Method of Storage and Retrieval of Information Based on the Type of Information Reference On-line Databases CD-ROM Floppy Disc SourceDatabases Databases Indirect through Networks Direct from Producer Direct from Vendors Internet
  • 70. Scope of information available Speed of information access and retrieval Commercially available search procedures provide considerable flexibility and efficiency Rely solely on the accuracy of the abstract author Depend on the journal and article selection policy of the database producer Might miss important information, or retrieve a lot of irrelevant data if searching by “keyword” LimitationsAdvantages
  • 71. Factors to Be Considered: Who has collected the data (did they have adequate resources)? Why was the data collected (how the interests of agency match with ours)? How the data was collected (to determine the quality of data on-hand)? What data was collected (geographic and demographic limitations)? When the data was collected (how old/obsolete is the data)?
  • 73. Demand Estimation Census data Standard Industrial Classification (SIC) or North American Industrial Classification (NAIC) Trade association data Experts and authorities Monitoring the Environment Press releases Legislation and laws Industry news Business and practitioner literature, such as magazines
  • 74. Segmentation and Targeting ORG Reports CLUSTER PLUS Developing a Business Intelligence System Competitor’s annual reports Press releases
  • 75. Factors Multitude of information users having common information needs When cost of satisfying individual user's need is prohibitive The increasing use of scanner systems at the check out points
  • 76. Biggest research company in the world Their auditing services cover four groups Grocery products Drugs Mass merchandisers Alcoholic beverages
  • 77. To Cover the gap between Warehouse Withdrawal Audits and Actual Purchases, following Methods can be used Home Audit Approach  Panel member agrees to permit an auditor to check the household stocks of certain product categories at regular intervals Mail Diary Method  Panel member records the details of each purchase and returns in the diary by mail at regular intervals
  • 78. Aggregate Sales Activity Brand Shares Shifts in Buyer Characteristics Shifts in Retail Outlets Advantages of Consumer Panels
  • 79. Possibility of Selection Bias Mortality Effect Testing Effects
  • 80. A new technology that may replace the bar codes. Utilizing a tiny silicon chip to store information; a small transmitter would then send this information to a scanner. RFID offers more benefits than a UPC, such as:  The ability to store more information  The ability to change the information on the tag  The ability to transmit all the information on the chip to a scanner without clear line of sight
  • 81. TAM for TV audiences RAM for FM Radio Channels INS & IRS for newspapers ORG report for FMCG, Consumer Durables etc
  • 82. Mechanics No wire connections Wired directly to TV and VCR tuners Research Methods Data retrieved by reading UTCP codes Telephone connections used to return data Method of Data Collection User logs in/out before and after watching TV User punches numerical code into data-entry device Reputation as: Media measurement business serving the ratio industry Foremost in TV ratings SMART PEOPLE METER
  • 83. A typical marketing manager receives some or all of following data:        Factory shipments or order Syndicated aggregate (industry) data services Sales reports from sales personnel Consumer panel data Scanner data Demographic data Internal cost and budget data Purpose of MDSS is to combine marketing data from diverse sources into single database
  • 84. Measuring product sales and market share Measuring advertisement exposure and effectiveness Measuring promotion effectiveness Estimation And evaluation of models
  • 85. & Methods of Qualitative research.
  • 87. Qualitative Methods  Recommended to capture the basic feel of a problem prior to conducting more analytical study Observational Methods  These methods are limited to providing information on current behavior
  • 88. Exploratory  Conducted primarily to explicitly define the problem and formulate hypotheses Orientation  To learn more about target consumer (e.G. Culture, language) Clinical  To gain insights into topics that are difficult in a structured research
  • 89. Major constraints:  Volume of data  Complexity of analysis  Detail of clarification record  Time-consuming nature of the clerical efforts required  Relatively expensive
  • 90. Nondirective interviews (respondent enjoys maximum freedom) Semi-structured or focused individual interviews  Covers a specific list of topics or sub-areas Individual in-depth interviews (3 techniques):  Laddering  Hidden-issue  Symbolic Analysis
  • 91. Offers participants more stimulation than an interview; makes new ideas and meaningful comments more likely Issues to be addressed:  Outlining the intended direction of the group  Explaining how participants were recruited  Reeducating observers on the concepts of random selection, statistical reliability, and projectability of research results
  • 92. Exploratory Focus Groups  Used in the exploratory phase of the market research process  Used for generating the hypotheses Clinical Focus Groups  Based on the premise that an individual's true feelings and motivations are subconscious in nature Experiencing Focus Groups  Allows the researcher to experience the emotional framework in which the product is being used
  • 93. Casual Observation Systematic Observation Direct Observation Contrived Observation Content Analysis Physical Trace Measures Humanistic Inquiry Behavior Recording Devices
  • 94. Cannot be used to observe motives, attitudes or intentions More costly and time consuming
  • 95. Used to Capture a Wide Variety of Information: Attitude Decisions Focus on process and not the results Measuring the relationship between actions & needs, desires, preferences, motives and goals
  • 96. The Results Will Be Meaningful If: Population has been defined correctly Sample is representative of the population Respondents selected are able and willing to cooperate Questions are understood by the respondents Respondents have the knowledge, opinions, attitudes, or facts required Interviewer correctly understands and records the response
  • 97. POPULATION RESPONDENT INTERVIEWER Sample Question Answer Sampling error Nonresponse due to refusals or not-at-home Ambiguity of question Interviewer error Ambiguity of answer Inaccuracy in response •Inability to formulate a response •Unwillingness to respond
  • 98. Refusals Could Occur Due to: Nature of questions and place Subject of no interest to the respondent Fear Invasion of privacy Hostility towards sponsor Personal bias Characteristics of the data collection procedure (e.G., Presidential polls)
  • 99. Phenotypic Source  Characteristics of the data collection procedure Questionasked How question isasked Length ofinterview Genotypic Source  Indigenous characteristics of the respondents Age Sex Occupation
  • 100. Inability to respond Telescoping Averaging Omission Cannot formulate an adequate answer Some of these problems can be solved by: Aided-recall techniques
  • 101. This Could Arise Due to the Following Reasons: Concern about invasion of privacy Time pressure and fatigue Prestige seeking and social desirability response bias Courtesy bias Uninformed response bias Response style
  • 102. This Depends On: Respondent’s Impression of the Interviewer Questioning, Probing, and Recording Fraud and Deceit Improving Interviewer Quality
  • 103. Personal Interview Telephone Interview Mail Survey Fax Survey E-mail Survey Web-based Survey
  • 104. Sampling Type of Population Question Form Question Content Response Rate Costs Available Facilities Length of Data Collection
  • 105. Misrepresentation of Data Collection Process Stems From: Representation of a marketing activity other than research as research Abuse of respondents rights during the data collection process, under the rationale of providing better quality research. E.G., Use of survey for selling purposes Use of survey to obtain names and addresses of prospects for direct marketing
  • 106. The rights of the respondents can be violated by: Disguising the purpose of a particular measurement Deceiving the prospective respondent as to the true duration of the interview Misrepresenting the compensation in order to gain cooperation
  • 107. The rights of the respondents can be violated by: Not mentioning to the respondent that a follow up interview will be made Using projective tests and unobtrusive measures to circumvent the need for a respondents consent Using hidden tape recorders Not debriefing the respondent Conducting simulated product tests in which identical product is tried by respondent except for variations in color
  • 108. Guidelines:  Reviewing data  Getting started  Setting the feedback objective  Customer presentation  Sharing responsibility  Handling issues you cannot fix  Working the issue resolution with your account
  • 110. There Are Four Entities Involved: Researcher Interviewer Interviewee The Interview Environment
  • 111. Methods: Door to Door Interviewing Executive Interviewing Mall Intercept Surveys Self Administered Interviews Purchase Intercept Technique (PIT) Omnibus Surveys
  • 112. Advantages: Can arouse and keep interest Can build rapport Ask complex questions with the help of visual and other aids Clarify misunderstandings High degree of flexibility Probe for more complete answers Accurate for neutral questions Do not need an explicit or current list of households or individuals Disadvantages: Bias of Interviewer Response Bias  Embarrassing/personal questions Time Requirements Cost Per Completed Interview Is High
  • 113. The Important Aspects of Telephone Interviewing: Selecting telephone numbers  Pre-specified list  A directory  Random dialing procedure Random digitdialing Systematic random digit dialing(SRDD) Call outcomes The introduction When to call Call reports
  • 114. Advantages: Central location, under supervision, at own hours More interviews can be conducted in a given time  Travelling time is saved More hours of the day are productive Repeated call backs at lower cost Absence of administrative costs Lower cost per completed interview Intrusiveness of the phone and ease of call backs  Less sample bias Limitations: Inability to employ visual aids or complex tasks Can't be longer than 5-10 min. or they get boring Amount of data that can be collected is relatively less A capable interviewer essential Sample bias  As all people do not have phones, or are not listed
  • 115. Requires a broad identification of the individuals to be sampled before data collection begins Some Decisions That Need to Be Taken Are: Type of Return Envelope Postage Method of Addressing Cover Letter The Questionnaire Length, Layout, Color, Format Etc Method of Notification Incentive to Be Given
  • 116. Advantages: Lower cost Better results, including a shorter response time Reliable answers as no inhibiting intermediary Survey answered at respondents discretion Disadvantages: The identity of the respondent is inadequately controlled No control over whom the respondent consults before answering the questions The speed of the response can't be monitored No control on the order in which the questions are exposed or answered The respondent may not clearly understand the question and no opportunity to clarify No long questionnaires Subject to availability of a mailing list Response rate is generally poor Number of problems such as obsolescence, omissions, duplications, etc
  • 117. Perceived amount of work required, and the length of the questionnaire Intrinsic interest in the topic Characteristics of the sample Credibility of the sponsoring organization Level of induced motivation Coping with non-response: Include monetary incentive Send a follow-up letter Include return envelope Alternatives: Mail Panels Fax Surveys
  • 118. Advantages The best way to implement some sample designs Most effective way of enlisting cooperation. Advantages of interview questions- probing for adequate answers, accurately following complex instructions or sequences are realized. Multi-method data collection are feasible Rapport and confidence building are possible. Probably longer interviews can be done in person. Limitations It is likely to be more costly than alternatives. A trained staff of interviewers that is geographically near the sample is needed. The total data collection period is likely to be longer than for most procedures. Some samples may be more accessible by some other mode.
  • 119. Advantages Lower costs than personal interviews. Random Digit-Dialing (RDD) sampling of general population. Better access to certain populations Shorter data collection periods. The advantages of interviewer administration (In contrast to mail surveys). Interviewer staffing and management easier than personal interviews-smaller staff needed, not necessary to be near sample, supervision and quality control potentially better. Likely better response rate from a list sample than from mail Limitations Sampling limitations, especially as a result of omitting those without telephone Nonresponse associated with RDD sampling is higher than with interviews Questionnaires or measurement constraints Possibly less appropriate for personal or sensitive questions if no prior contact
  • 120. Advantages Ease of presenting questions requiring visual aids. Asking questions with long or complex response categories is facilitated. Asking batteries of similar questions is possible. Limitations Questionnaire design needs special attention Open questions are usually not useful. Respondents require good reading and writing skills. The interviewer is not present to exercise quality control with respect to answering all questions, meeting questions objectives, or the quality of answers provided.
  • 121. Advantages Relatively low cost Can be accomplished with minimal staff and facilities. Provides access to widely dispersed samples. Respondents have time to give thoughtful answers, look up records, or consult others. Limitations Ineffective as a way of enlisting cooperation. Various disadvantages of not having interviewer involved in data collection. Need for accurate mailing addresses of the sample.
  • 122. Advantages The interviewer can explain the study, answer questions, and designate a respondent. Response rates tend to be like those of personal interview studies. There is more opportunity to give thoughtful answers and consult records. Limitations Costs about as much as personal interviews. A field staff is required.
  • 123.
  • 124. Mental states used by individuals to structure the way they perceive their environment and guide the way they respond to it What Are Attitudes?
  • 125. Majority of questions in marketing research are designed to measure attitudes Attitudes include  Information possessed  Feelings of like and/or dislike  Intentions to behave Management wants to understand and influence behavior
  • 126. Attitudes lead to behavior More feasible to ask questions on attitudes than to observe and interpret behavior Large capacity for diagnosis and explanation Learn which features of a new product concept are acceptable or unacceptable Measure the perceived strengths and weaknesses of competitive alternatives
  • 127. Cognitive or Knowledge Component     Represents a person’s information about an object Awareness of existence of the object Beliefs about the characteristics or attributes of the object Judgments about the relative importance of each of the attributes Affective or Liking Component     Summarizes a person’s overall feelings toward an object, situation, or person On a scale of like-dislike or favorable-unfavorable When there are several alternatives, liking is expressed in terms of preference Measured by asking which alternative is “most preferred” or “first choice,” which is the “second choice,” and so on Intention or Action Component   Refers to a person’s expectations of future behavior toward an object Intentions are usually limited to a distinct time period that depends on buying habits and planning horizons Advantage  Incorporates information about a respondent’s ability or willingness to pay for the object, or other taken action
  • 128. Measurement Standardized process of assigning numbers or other symbols to certain characteristics of objects of interests according to pre-specified rules Characteristics for Standardization One-to-one correspondence between the symbol and the characteristic in the object that is being measured Rules for assignment should be invariant over time and the objects being measured Scaling Process of creating a continuum on which objects are located according to the amount of the measured characteristic that the object possesses
  • 129. Nominal Scale Objects are assigned to mutually exclusive, labeled categories No necessary relationships among categories No ordering or spacing are implied Only possible arithmetic operation is a count of each category Ordinal Scale Rank objects or arrange them in order by some common variable Does each object have more or less of a variable than some other object? Does not provide information on how much difference there is between objects Arithmetic operations are limited to statistics such as median or mode Interval Scale Numbers are assigned to objects that represent categories, rank orders, as well as how much the object is preferred on the attribute being measured Differences can be compared Entire range of statistical operations can be employed Ratio Scale Special kind of interval scale with meaningful zero point Possible to say how many times greater or smaller one object is than the other Magnitude scaling of attitudes has been calibrated through numeric estimation
  • 131. Problems in choosing  There are many different techniques, each with its own strengths and weaknesses  Virtually any technique can be adapted to the measurement of any one of the attitude components Researchers choice shaped by:  The specific information required  Adabtability of the scale to the data collection method and budget constraints  Compatibility of the scale with the structure of the respondent’s attitude
  • 132. Validity  An attitude measure has validity if it measures what it is supposed to measure Face Validity  The extent to which the content of a measurement scale appears to tap all relevant facets of the construct Criterion Validity  Based on empirical evidence that the attitude measure correlates with other “criterion” variables Concurrent validity  Two variables are measured at the same time Predictive validity  The attitude measure can predict some future event Convergent validity  A form of construct validity that represents the association between the measured construct and measures of other constructs with which the construct is related on theoretical grounds Discriminant validity  A form of construct validity that represents the extent to which the measured construct is not associated with which the construct is related on theoretical grounds Construct Validity  A scale evaluation criterion that relates to the underlying question "what is the nature of the underlying variable or construct measured by the scale?“ Reliability  The consistency with which the measure produces the same results with the same or comparable population Sensitivity  Extent to which ratings provided by a scale are able to discriminate between the respondents who differ with respect to the construct being measured Generalizability  Refers to the ease of scale administration and interpretation in different research settings and situations Relevancy  Relevance = reliability * validity
  • 133.
  • 134. Questionnaire building is an art! A questionnaire is always custom-built!
  • 135. PLANNING WHAT TO MEASURE Revisit the research objectives Decide on the Research issue of your questionnaire Get additional information on the research issue from data sources and secondary exploratory research Decide what to be asked under the research issue FORMATTING THE QUESTIONNAIRE In each issue determine the content of each question Decide on the format of each question QUESTION WORDING Determine how the question is worded Evaluate each question on the basis of comprehensibility, knowledge and ability, willingness/inclination of a typical respondent to answer the question
  • 136. SEQUENCING AND LAYOUT DESIGNS Layout the questions in proper sequence Group all the questions in each subtopic to get a single questionnaire PRETESTING AND CORRECTING PROBLEMS Read through the whole questionnaire to check whether it makes sense and it measures what it is supposed to measure Check the questionnaire for error Pretest the questionnaire Correct the problems
  • 137. Logical Steps to Develop a Good Questionnaire Plan what to measure Formulate questions to obtain the needed information Decide on the order and wording of questions and the layout of the questionnaire Using a sample, test the questionnaire for omissions and ambiguity Correct the problems (pretest again, if necessary) Planning What to Measure Specify research objectives and information to be collected Relevance of the study Translating Research Objectives Into Information Requirements
  • 138. Formatting the Question Decision to be made regarding the degree of freedom to be given to the respondents in answering the questions Alternatives  Open ended with no classification  Open ended where the interviewer uses precoded classifications to record the response  Close ended or structured format in which a question or a supplementary card presents the responses to be considered
  • 139. Open Ended Questions Are Good for the Following Circumstances Introduction to a survey or to a topic When it is important to measure the saliency of an issue to a respondent When there are too many responses to be listed, or they can't be foreseen When verbatim responses are desired to give the flavor of people's answers or to cite examples When the behavior to be measured is sensitive or disapproved
  • 140. Disadvantages Variability in the clarity and depth of the responses Articulateness of the respondent in personal interview Willingness to compose a written answer for a mail survey Interviewer's ability to record the verbatim answers quickly Advantages Wide range of responses Responses obtained without any influence Free choices
  • 141. ClosedThere Are Two Basic Formats for Ended or Structured Questions Choice from a list of responses Appropriate single-choice rating on a scale
  • 142.  Easier to answer  Require less effort by the interviewer  Tabulation and analysis is easier  Less potential error in the way the question is asked and the way it is recorded  The responses are directly comparable from respondent to respondent Advantages Limitations Disagreement among researchers on the type of responses that should be listed The answer to a closed response question will be received no matter how relevant or irrelevant the question is in that context May not produce meaningful results Dichotomous questions are prone to a large amount of measurement error because the alternatives are polarized Good questions are hard to develop Provides fewer opportunities of self expression The list of alternative responses provides answers that might have not been considered by the respondent who are reluctant to admit ignorance, and thereby selecting a "reasonable" response
  • 143. Generally five to seven categories Ideally the multiple choices should be mutually exclusive
  • 144. Responses are likely to be affected by the order in which they are presented. What factor influences your fast-food restaurant choice most ?  Convenient location  Quality of food  Menu selection  Fast service  Reasonable prices  Brand name  Cleanliness To prevent order bias, place the average or expected response at various positions in the sequence of categories
  • 145. Respondents who do not know the answer might take categories as cues. How many long-distance calls do make in a week? less than 5  less than 10  5-10 or  10-20  More than 10.  More than 20.
  • 146. Concerns the handling of “don’t know” and neutral responses May be advisable to provide the interviewer with an additional “no answer” category to identify these people correctly
  • 147. Probe: Using an open-response question to follow up a closed-response question Two general purposes for the use of probes: Pinpoint questions that were particularly difficult for respondents Aid researcher interpretation of respondent answers
  • 148. The following details need special attention: Is the vocabulary simple, direct, and familiar to all respondents? Do any words have vague or ambiguous meanings? Are any questions " double-barreled”? Are any questions leading or loaded? Are the instructions potentially confusing? Is the question applicable to all respondents? Are the questions of appropriate length?
  • 149. Avoid ambiguous words How many times per month do you visit a fast-food restaurant?  Never  Occasionally  Sometimes  Often
  • 150. Are any questions loaded? 1)Don’t you think, because its so greasy, fast-food is one of the worst types of food? 2)Do you prefer a burger that is grilled on a hot stainless-steel grill or cooked by passing the raw meat through an open gas flame?
  • 151. Are any questions "double-barreled”? Are you satisfied with the price and the service of Café Coffee Day?
  • 152. Is the question applicable to all respondents? Why do you like fast-food? Assumes that respondent likes fast-food.
  • 153. Consumption of Kellogg’s Frosted Flakes The casual approach  “Have you eaten ‘Frosted Flakes’ within the last week? The numbered card  “Would you please read off the number on this card that corresponds to what you had eaten for breakfast in the last week?” (Hand card to respondent) 3. Pancakes 4. Frosted Flakes 5. Other (what)?
  • 154. The everybody approach  “As you know, many people have been eating Frosted Flakes for breakfast. Do you eat Frosted Flakes?” The “other people” approach  “Do you know of any adult who eats Frosted Flakes?”  “How about yourself?”
  • 155. The sealed ballot technique  In this version you explain that the survey respects people’s right to anonymity with respect to their eating habits, and that they themselves are to fill out the answer to the question, seal it in an envelope, and drop it in a box conspicuously labeled “sealed ballet box” that is carried by the interviewer The Kinsey approach  Stare firmly into respondent’s eyes and ask in simple clear-cut language as that to which the respondent is accustomed, and with an air of assuming that everyone had done everything, “Do you eat Frosted Flakes for breakfast?”
  • 156. Randomized Response Technique  The respondent is asked to answer one or two randomly selected questions without revealing which question has been answered Questions:  Sensitive  Innocuous Since the interviewer records a “yes” or “no” answer without knowing which question has been answered, the respondent feels free to answer honestly
  • 157. Open with an easy and non threatening question The questionnaire should flow smoothly and logically from one topic to the next Proceed from broad general questions to the more specific
  • 158. Location Type Function Example Location Type Function Example Starting questions Broad, general To break the ice and Do you own a Starting questions Broad, general To break the ice and Do you own a questions establish a report with personal computer? questions establish a report with personal computer? the respondent the respondent Next few questions Simple and direct To reassure the What brands of Next few questions Simple and direct To reassure the What brands of questions respondent that the personal computers questions respondent that the personal computers survey is simple and did you consider survey is simple and did you consider easy to answer when you bought it? easy to answer when you boughtit? Questions up to a Focused questions Relate more to the What attributes did Questions up to a Focused questions Relate more to the What attributes did third of the research objectives you consider when third of the research objectives you consider when questionnaire and convey to the you purchased you questionnaire and convey to the you purchased you respondent the area of personal computer? respondent the area of personal computer? research research Major portion of the Focused questions; To obtain most of the Rank the following Major portion of the Focused questions; To obtain most of the Rank the following questionnaire some may be difficult information required attributes of a questionnaire some may be difficult information required attributes of a and complicated for the research personal computer and complicated for the research personal computer based on their based on their importance to you importance to you Last few questions Personal questions To get classification What is the highest Last few questions Personal questions To get classification What is the highest that may be perceived and demographic level of education that may be perceived and demographic level of education by the respondent as information about the you have attained? by the respondent as information about the you haveattained? sensitive respondent sensitive respondent Location Type Function Example Starting Questions Broad, General Questions To break the ice and establish rapport with the respondents Do you own a personal computer? Next few Questions Simple and Direct Questions To reassure the respondent that the survey is simple and easy to answer. What brands of personal computers did you consider while you were buying the PC? Questions up to a third of the questionnaire Focused Questions Relate more to the research objectives and convey to the respondent the area of research What attributes did you consider when you purchased your personal computer? Major portion of the questionnaire Focused Questions: Some may be difficult and complicated To obtain most of the information required for the research Rank the following attributes of a personal computer based on their importance to you. Last few questions Personal questions that may be perceived by the respondent as sensitive To get classification and demographic information about the respondent. What is the highest level of education you have attained?
  • 159. Sensitive questions should not be placed in the beginning of the questionnaire Use good quality of paper Physical layout should be appealing and interesting Order bias
  • 160. 1. No question asked 2.8 2. Asked only about advantages 16.7 3. Asked only about disadvantages 0.0 4. Asked about both advantages and disadvantages 5.7 Percentage of Respondents “Very Much Interested” in Buying New ProductQuestions Preceding Buying Interest Question
  • 161. Pretest Design Pretesting Specific Questions For Variation Meaning Taskdifficulty Respondent interest andattention Pretesting the Questionnaire Flow of thequestionnaire Skippatterns Length Respondent Interest andAttention
  • 162.  Strategy that emphasizes words rather than quantificatino in collection & analysis of data  Predominantly emphasizes an inductive approach to relationship between theory and research in which A research strategy that emphasizes quantification in collection and analysis of data Entails a deductive approach to the relationship between theory and research in which the accent is placed on the testing of the theories It has incorporated the practices and norms of the natural scientific model and positivism in particular It embodies a view of social reality as an external objective reality In summary – The collection of numerical data and as exhibiting view of relationship between theory and research as deductive
  • 163.
  • 164. A set of methods and techniques used to obtain information and insights from data Helps avoid erroneous judgements and conclusions Can constructively influence the research objectives and the research design
  • 166. Data Editing Identifies omissions, ambiguities, and errors in responses Conducted in the field by interviewer and field supervisor and by the analyst prior to data analysis
  • 167. Problems identified with data editing Interviewer Error Omissions Ambiguity Inconsistencies Lack of Cooperation Ineligible Respondent
  • 168. Coding Coding closed-ended questions involves specifying how the responses are to be entered Open-ended questions are difficult to code  Lengthy list of possible responses is generated
  • 169. Statistically Adjusting the Data + Weighting Each response is assigned a number according to a pre- specified rule Makes sample data more representative of target population on specific characteristics Modifies number of cases in the sample that possess certain characteristics Adjusts the sample so that greater importance is attached to respondents with certain characteristics
  • 170. Statistically Adjusting the Data + Variable Re-specification Existing data is modified to create new variables Large number of variables collapsed into fewer variables Creates variables that are consistent with study objectives Dummy variables are used (binary, dichotomous, instrumental, quantitative variables) Use (d-1) dummy variables to specify (d) levels of qualitative variable
  • 171. Statistically Adjusting the Data + Scale Transformation Scale values are manipulated to ensure comparability with other scales Standardization allows the researcher to compare variables that have been measured using different types of scales Variables are forced to have a mean of zero and a standard deviation of one Can be done only on interval or ratio scaled data
  • 172. Consists of counting the number of cases that fall into various categories Use of Simple Tabulation Determine empirical distribution (frequency distribution) of the variable in question Calculate summary statistics, particularly the mean or percentages Aid in "data cleaning" aspects
  • 173. Reports the number of responses that each question received Organizes data into classes or groups of values Shows number of observations that fall into each class Can be illustrated simply as a number or as a percentage or histogram Response categories may be combined for many questions Should result in categories with worthwhile number of respondents
  • 174. Statistics normally associated with a frequency distribution to help summarize information in the frequency table Measures of central tendency mean, median and mode Measures of dispersion (range, standard deviation, and coefficient of variation) Measures of shape (skewness and kurtosis)
  • 175. Differences between means or percentages of two subgroup responses can provide insights Difference between means is concerned with the association between two questions Question upon which means are based are intervally scaled
  • 176. Statistical analysis technique to study the relationships among and between variables Sample is divided to learn how the dependent variable varies from subgroup to subgroup Frequency distribution for each subgroup is compared to the frequency distribution for the total sample The two variables that are analyzed must be nominally scaled
  • 177. Type of Data  Classification of data involves nominal, ordinal, interval and ratio scales of measurement  Nominal scaling is restricted to the mode as the only measure of central tendency  Both median and mode can be used for ordinal scale  Non-parametric tests can only be run on ordinal data  Mean, median and mode can all be used to measure central tendency for interval and ratio scaled data
  • 178. Research Design  Dependency of observations  Number of observations per object  Number of groups being analyzed  Control exercised over variable of interest Assumptions Underlying the Test Statistic  If assumptions on which a statistical test is based are violated, the test will provide meaningless results
  • 179. Univariate Techniques      Appropriate when there is a single measurement of each of the 'n' sample objects or there are several measurements of each of the `n' observations but each variable is analyzed in isolation Nonmetric - measured on nominal or ordinal scale Metric-measured on interval or ratio scale Determine whether single or multiple samples are involved For multiple samples, choice of statistical test depends on whether the samples are independent or dependent Multivariate Techniques   A collection of procedures for analyzing association between two or more sets of measurements that have been made on each object in one or more samples of objects Dependence or interdependence techniques
  • 180. Multivariate Techniques (Contd.) Dependence Techniques One or more variables can be identified as dependent variables and the remaining as independent variables Choice of dependence technique depends on the number of dependent variables involved in analysis Interdependence Techniques Whole set of interdependent relationships is examined Further classified as having focus on variable or objects
  • 181. Why use Multivariate Analysis? To group variables or people or objects To improve the ability to predict variables (such as usage) To understand relationships between variables (such as advertising and sales)
  • 182. Assumption (hypothesis) made about a population parameter (not sample parameter) Purpose of Hypothesis Testing To make a judgement about the difference betweentwo sample statistics or between sample statistic and a hypothesized population parameter Evidence has to be evaluated statistically before arriving at a conclusion regarding the hypothesis.
  • 183. The null hypothesis (Ho) is tested against the alternative hypothesis (Ha). At least the null hypothesis is stated. Decide upon the criteria to be used in making the decision whether to “reject” or "not reject" the null hypothesis. The null hypothesis (Ho) is tested against the alternative hypothesis (Ha). At least the null hypothesis is stated. Decide upon the criteria to be used in making the decision whether to “reject” or "not reject" the null hypothesis.
  • 184. Evidence has to be evaluated statistically before arriving at a conclusion regarding the hypothesis Depends on whether information generated from the sample is with fewer or larger observations
  • 185. Problem Definition Clearly state the null and alternative hypotheses. Choose the relevant test and the appropriate probability distribution Choose the critical value Compare test statistic and critical value Reject null Does the test statistic fall in the critical region? Determine the significance level Compute relevant test statistic Determine the degrees of freedom Decide if one-or two-tailed test Do not reject null
  • 186. (Contd.) The Three Criteria Used Are Significance Level Degrees of Freedom One or Two Tailed Test
  • 187. Cross Tabulation & Chi-square Test ANOVA – Analysis of Variance Correlation Analysis Regression Analysis Factor Analysis Cluster Analysis L Scaling Conjoint Analysis Perceptual Maps
  • 188.
  • 189. Complex analysis and big words impress people.  Most people appreciate practical and understandable analyses. Analysis comes at the end after all the data are collected.  We think about analysis upfront so that we HAVE the data we WANT to analyze. Quantitative analysis is the most accurate type of data analysis.  Some think numbers are more accurate than words but it is the quality of the analysis process that matters.
  • 190. Data have their own meaning.  Data must be interpreted. Numbers do not speak for themselves. Stating limitations to the analysis weakens the evaluation.  All analyses have weaknesses; it is more honest and responsible to acknowledge them. Computer analysis is always easier and better.  It depends upon the size of the data set and personal competencies. For small sets of information, hand tabulation may be more efficient
  • 191. It involves: 2. 3. 4. organizing the data doing the calculations interpreting the information lessons learned 5. explaining limitations
  • 192. Organize all forms/questionnaires in one place Check for completeness and accuracy Remove those that are incomplete or do not make sense; keep a record of your decisions Assign a unique identifier to each form/questionnaire
  • 193. By hand By computer  Excel (spreadsheet)  Microsoft Access (database mngt)  Quantitative analysis: SPSS (statistical software)
  • 194.  Count (frequencies)  Percentage  Mean  Mode  Median  Range  Standard deviation  Variance  Ranking  Cross tabulation http://learningstore.uwex.edu/pdf/G3658-6.pdf
  • 195. Do you want to know how many individuals checked each answer? Frequency Do you want the proportion of people who answered in a certain way? Percentage Do you want the average number or average score? Mean Do you want the middle value in a range of values or scores? Median Do you want to show the range in answers or scores? Range Do you want to compare one group to another? Cross tab Do you want to report changes from pre to post? Change score Do you want to show the degree to which a response varies from the mean? Standard deviation
  • 196. Numbers do not speak for themselves. For example, what does it mean that 55 youth reported a change in behavior. Or, 25% of participants rated the program a 5 and 75% rated it a 4. What do these numbers mean? Interpretation is the process of attaching meaning to the data. Interpretation demands fair and careful judgments. Often the same data can be interpreted in different ways. So, it is helpful to involve others or take time to hear how different people interpret the same information. Think of ways you might do this…for example, hold a meeting with key stakeholders to discuss the data; ask individual participants what they think
  • 197. What did you learn? – about the program, about the participants, about the evaluation.  Are there any ‘ah-has’? What is new? What was expected?  Were there findings that surprised you?  Are there things you don’t understand very well – where further study is needed? We often include recommendations or an action plan. This helps ensure that the results are used.
  • 198. Written reports: Be explicit about your limitations Oral reports: Be prepared to discuss limitations Be honest about limitations Know the claims you cannot make  Do not claim causation without a true experimental design  Do not generalize to the population without random sample and quality administration (e.g., <60% response rate on a survey)
  • 199. Incorrect denominator when calculating the percentage Do not average percentages Using a single average that distorts or misrepresents the range of information
  • 200.
  • 201. New Product Research Process Generation of new product concepts Evaluation and development of those concepts Evaluation and development of the actual products Testing in the context of the marketing program Need Identification       Perceptual maps Social and environmental trends Benefit structure analysis Product users Focus-group interviews Lead user analysis Concept Identification
  • 202.  Test Marketing  Designing the sell-in market test  Selecting the test cities  Implementing and controlling the test  Timing  Measurement  Costs of a test market  Controlled Distribution Scanner Markets (CDSM) Projecting Trial, Repeat and Usage Rate Using
  • 203.  Gabor and Grainger method  Multi-brand choice method Research for Profit-oriented Pricing Research for Share-oriented Pricing
  • 204. Warehouse and Retail Location Research Center-of-gravity Simulation Computerized Simulation Models Catchment Area Analysis Outlet Location Research
  • 205. Number and Location of Sales Representatives Sales effort approach Statistical analysis of sales data Field experiments Computerized models of sales force size and allocation by market and by product line
  • 206. Criteria Recognition Recall Persuasion   Forced exposure, brand preference change On-air tests -- brand preference change Customized Measures of Communication / Attitude Purchase Behavior Coupon stimulated purchasing Split-cable tests Tracking Studies Diagnostic Testing Copy Test Validity Qualitative Research Audience Impressions of the Ad Adjective Checklist Eye Movement Physiological Measurement Budget Decision Media Research Measuring print vehicle audiences Measuring broadcast vehicles audiences
  • 207. Promotional Tools Price Discounts Features Displays Coupons / Rebates Sweepstakes Promotional Strategy Hi-lo Every Day Low Price (EDLP)
  • 208. Assessing Competitive Advantage Brand Equity Measuring Brand Equity Customer Satisfaction Quality Management Benchmarking Market Intelligence