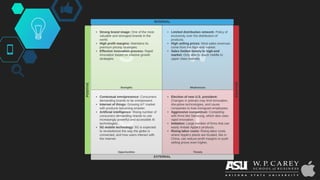
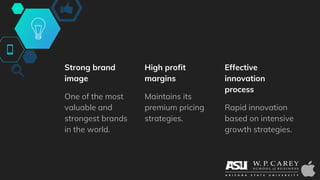
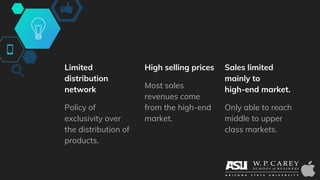
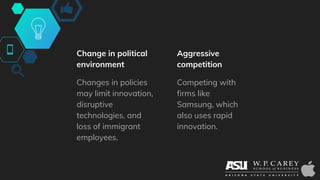
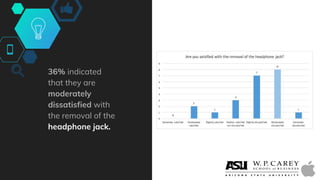
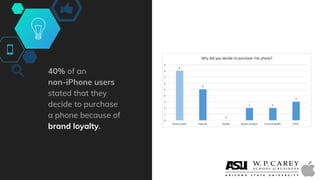
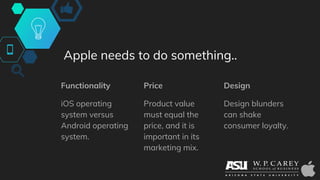
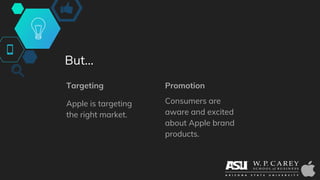
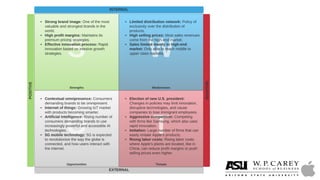
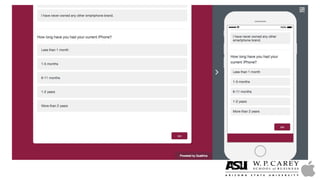
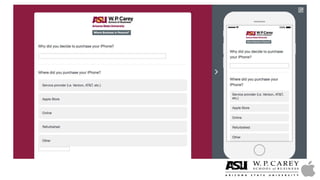
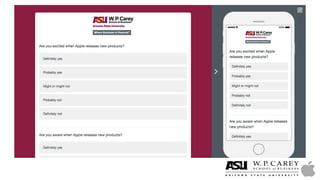
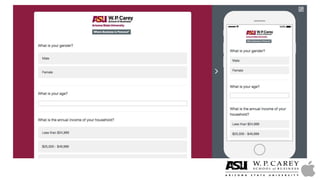
The document presents market research on Apple Inc., highlighting its strong brand image, high profit margins, and the challenges it faces such as declining iPhone sales and aggressive competition. It investigates consumer preferences and satisfaction, indicating that pricing and product design may be contributing factors to decreased sales, especially among younger demographics. Recommendations for Apple include addressing pricing strategies, improving product features, and better targeting of the right market segments.


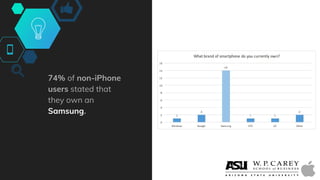
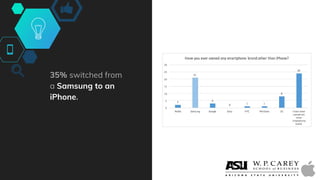
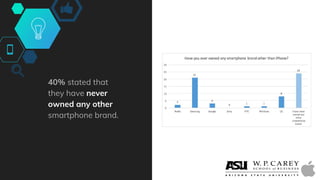


![[Invbots' Insight] Investment Strategy - Apple Inc./iPhone 8](https://cdn.slidesharecdn.com/ss_thumbnails/05qexklfs0ujw9ltcgak-signature-1a3adf1c2c5278fdc4811c3ad3f696dc8b54184ff1b344a3dde9f7caf17211fc-poli-170923170035-thumbnail.jpg?width=640&height=640&fit=bounds)


