Apple Inc. designs consumer electronic devices including computers, phones, tablets and music players. The report issues a HOLD recommendation based on a valuation of $125.66 per share. While strong iPhone sales and a large cash position provide upside, uncertainty around new products like Apple Watch and a lack of sustainable growth models for maturing products like the iPad and Mac present risks.
Quan busquem l´ origen mes antic dels nostres avantpassats en la Vall de Segó, sempre apareix una referència a la Cova de la Collita en el terme de Quart de Les Valls, afirmant que en ella es va trobar ceràmica i un punxó d´ os de l´ Edat del Bronze valencià.
Autor: Sergi Arrando Máñez
Quan busquem l´ origen mes antic dels nostres avantpassats en la Vall de Segó, sempre apareix una referència a la Cova de la Collita en el terme de Quart de Les Valls, afirmant que en ella es va trobar ceràmica i un punxó d´ os de l´ Edat del Bronze valencià.
Autor: Sergi Arrando Máñez
A free version of Apple Inc. SWOT analysis 2016. To get the full presentation buy the SWOT here: https://www.strategicmanagementinsight.com/swot-analyses/apple-swot-analysis.html
Quadrant Strategic Objective Measure Target for YearFinanc.docxmakdul
Quadrant Strategic Objective Measure Target for Year
Financial
Be profitable at the end
of the year profit margin Breakeven
Customer
Grow business by
focusing on gaining
customer and
outstanding customer Market share
5%
Operation
Build on to the Apple
name and expand brand
Marketing campaign
with a developed
plan in place 4 months
Learning and Growth
Employees have proper
training and knowledge
to expand brand Training hours 20 hours
Running Head: APPLE CORPORATION
APPLE CORPORATION
7
Daniel Price
Professor Keen
BUS/475
Week 4
Apple Corporation
Apple Corporation
Introduction
Apple Corporation is an American universal technology company with its headquarters in Cupertino, California. It deals with developing computer software and designing and selling consumer electronics. It also offers online services. The hardware products of Apple include smart phones, iPads, iPods and personal computers. The consumer software includes the iTunes media player, iOS operating system, OS X and the Safari web browser. Its online services include the iOS App Store, iCloud, Mac App Store and the iTunes store.
Apple Corporation was founded by a group of associates on 1st April 1976 to design and sell personal computers. It was however incorporated as Apple Computer Inc. on 3rd January 1977 only to be renamed thirty years later to Apple Inc due to its focus on consumer electronics. It is the largest technology firm in terms of total assets and revenue and the second mobile manufacturer after Samsung. It has a net worth of over 700billion USD with over one hundred thousand employees and over four hundred retail stores around the world. Apple Inc. has over one billion products in the market as at May 2016.
However, the aim of this paper is to develop strategic objectives in the measurement of attaining company's vision and mission based on a balanced scorecard taking into account different perspectives of the whole company. The balanced scorecard contains the financial perspective, Customer value, Internal Operations and Employee perspective.
Financial Perspective
Apple Corporation is the world’s largest technology company based on total assets and revenue valued at over 700 USD as at May 2016 (Ingram, 2008). It is also the world’s second largest mobile phone manufacturer. Apple Corporation Inc entered the top ten Fortune 500 list of publicly traded companies on May 2013. It announced a dividend of $0.57 in May 2016 after earning revenue of $51.5 billion and a net profit of $11.1 billion which was a 22% increase in revenue from the previous year. Apple Inc has transferred 90% of its cash and marketable securities outside the United States, which is about 234billion USD due to tax purposes. In 2015, the company accumulated over 80% of the total earnings made by the eight largest universal smart phone manufacturers.
High tax rates in the United States pose big threat to the profitability of Apple Corporation Inc. In ord ...
Running Head Apple CompanyApple Company.docxSUBHI7
Running Head: Apple Company
Apple Company
Apple Company
Name
Course
Date
Apple Company
The products at apple include Ipads, IPhones, Tablets, macintosh, Apple TV. These items have done well in the market and their request is still high. The organization Apple Inc. begun in 1977 January, 3. The organization has composed items like advanced music players, PCs related programming, which are one of a kind in nature. The organization has done enormously well with regards to advancement and making of astounding and great products that have intensely beaten their opponent in the market. This paper is an outlook on the structure, products and nature of the apple company with regards to stakeholders and corporate social responsibility.
Apple's achievement is their craft of offering magnificent client benefit understanding and in-store better alternatives. The Company gives assortment of items and even the sales people use wonderful language. Apple evaluated that just about half of individuals purchasing Apple items are new clients. Apple has utilized talented and experienced group of offers representatives who have added to organization's prosperity. The organization in 2002 opened tech retail I Tokyo, Japan and there after the organization has kept on opening more shops all around. Their retail technique has truly worked to support them in this manner with higher returns compared to their counterparts (Francois nonnenmancher, 2004).
Apple's hierarchical structure is one of the variables adding to the organization's fruitful advancement. An association's authoritative structure can make open doors for business development. However, it can likewise force restrains on how the firm creates. For Apple's situation, the hierarchical structure is principally a conventional pecking order, with some key components from different sorts of authoritative structure. The achievement of the organization is connected to advancement and the authority of Steve Jobs, however its hierarchical structure is halfway in charge of guaranteeing support for such administration. Presently, under Tim Cook's administration, Apple has rolled out some little improvements in its hierarchical structure to suit market and industry requests.The advantages of Apple's various leveled hierarchical structure incorporate tight control controlled by senior administration over all parts of the business. Also, advancement openings rouse representatives to perform well and there are clear levels of expert and duty. On the negative side, Apple's progressive authoritative structure may trade off adaptably off the business to reflect changes in the worldwide commercial center. Moreover, in various leveled associations correspondence across various offices has a tendency to be less compelling than in level associations (Dudovskiy, 2018).
Unveiled over 10 years ago, the iPod is the one gadget that changed Apple from a PC organization into a mass-advertise hardware monster and would late ...
Running head EXTERNAL ENVIRONMENT SCAN—APPLE .docxjoellemurphey
Running head: EXTERNAL ENVIRONMENT SCAN—APPLE 1
EXTERNAL ENVIRONMENT SCAN—APPLE 5
External Environment Scan—Apple
An environmental scan is vital for every company as it helps to determine the threats and opportunities that are posed to the company. The following will be included in the environment scan of Apple incorporated: economic factors, political factors, legal factors, societal factors, technological factors, geographic factors and Porter’s five forces.
Key Factors and Trends
The economic environment of the company is determined by factors such as taxation policies, exchange rate, inflation, the economy, living standards, the average income and consumer buying power. Apple’s products main target market are people of medium to high income and standards. In an economic boom, the company’s products are more likely to be bought than during a recession. The rapid growth of developing countries provide an opportunity for Apple to venture into new markets.
Political stability can be a threat to Apple’s products. Poor political stability would mean a reduction in sales and distribution of the products would be hard as trade barriers would be imposed. Various trade policies that could be imposed on a country would have an adverse effect on the company’s sales. However, developing countries create an opportunity for Apple expand its customer base as more free trade policies are put into effect. As Lombardo (2015) states, “Additional free trade policies increase the opportunities for Apple to distribute more of its products to various markets around the world” (section 2).
Social-cultural factors, such as lifestyle, living standards, and demographics important to Apple. Social factors have an effect on consumer behavior and expectations. The increase in mobile phone use and social media is an opportunity for Apple to provide easy-to-use smart phones.
Current technology and technological changes can affect a customer’s priorities changing the demand for Apple products. For example, with the increasing popularity of Cloud computing, Apple can use that to bring in customers and retain their existing customers. Apple has taken advantage of this by making it so that information can be transferred between the different apple devices and between family members. “Everything’s better when shared, and sharing has never been easier” (Apple, 2016, section 3).
Legal factors can also create a threat to Apple. As governments become more aware of privacy issues in relation to digital technology, stricter regulations are imposed on companies like Apple. This poses a threat to Apple as they are now required to develop a product that not only meets consumer demand, but also the privacy regulations imposed by the government. Stricter regulations have been implemented on telecommunications therefore increasing threats to Apple. ...
This presentation discusses one of the business concept i.e. startups and one of the top rated multi national startup company, Apple Inc. Also it includes various points like risks associated, market scenario, steps to make a startup successful and other various topics. Take a look.
This document is originally written by AssignmentWOrkHelp. This report explains the successful running of the business of the Apple company. This shows the detail description of the factors influencing the future business, its internal analysis
and the reason of the success of the apple business.For more information, contact https://www.assignmentworkhelp.com/contact/
Day 7HEALTH COMMUNICATION EVALUATION RESEARCHEvOllieShoresna
Day 7
HEALTH COMMUNICATION
EVALUATION RESEARCH
Evaluation Research
Homework
AGENDA
PROGRAM
EVALUATION
ACTIVITIES....
USEFUL
FEASIBLE
ETHICAL
ACCURATE (CDC, 2010)
WHAT IT IS?
https://meera.snre.umich.edu/evaluation-what-it-and-why-do-it#should
How is it Done?
ID Program Elements to Monitor
Select Key Evaluation Questions
(CDC, 2010)
Determine How Info will be Gathered
Develop a Data Analysis & Reporting Plan
Develop a Timetable & Budget
ID Program Elements to Monitor
MONITORING /PROCESS
EVALUATION
REACH
FIDELITY
WHO , HOW , WHAT ,
WHETHER
(CDC , 2010)
WHAT DO SOME BASIC
EVALUATION QUESTIONS
INCLUDE?
WHAT SHOULD YOU FIND
OUT FROM
STAKEHOLDERS?
Select Key Evaluation Questions
(CDC, 2010)
Determine How Info will be Gathered
EXPERIMENTAL DESIGNS
CORRELATIONAL DESIGNS
QUASI-EXPERIMENTAL DESIGNS
CASE STUDY DESIGNS
QUANTITATIVE QUALITATIVE
(CDC, 2010)
DEVELOP A DATA ANALYSIS & REPORTING PLAN
INCLUDE HOW THE DATA FOR
EACH MONITORING &
EVALUATION QUESTION WILL BE
CODED , SUMMARIZED &
ANALYZED
DESCRIBE HOW MONITORING &
EVALUATION DATA WILL BE
REPORTED
(CDC, 2010)
DEVELOP A
TIMETABLE &
BUDGET
YOUR TIMELINE SHOULD
COVER . . . .
(CDC, 2010)
YOUR BUDGET SHOULD
INCLUDE . . . .
https://www.cdc.gov/eval/materials/index.htm
https://www.cdc.gov/eval/materials/index.htm
https://www.youtube.com/watch?v=XNR3KZzDoGQ
https://www.cdc.gov/healthcommunication/pdf/evaluationplanning.pdf
(Kreps , 2014)
EVALUATION RESEARCH CAN
ANSWER...
THE NEED FOR EVALUATION DATA
ID Problems
Guide design interventions
Examine costs & benefits
Advocate for needed support
(Kreps , 2014)
(Kreps , 2014)
THE NATURE FOR EVALUATION
DATA
Good evaluation data provides health COM program providers with critically
important information regarding the following...
VALIDITY OF EVALUATION RESEARCH
(KREPS , 2014 )
No research is better than research done poorly
Consider limitations of research
Internal validity
External validity
(Kreps , 2014)
FORMATIVE & SUMMATIVE
EVALUATION RESEARCH
"formative research looks at key parts of health communication interventions,
providing a microscopic analysis of individual components and influences of the
programs, summative research looks at the big picture of the overall influences of
health communication intervention programs."
METHODOLOGICAL ISSUES...
(KREPS , 2014 )
Cross-Sectional Data Self-Report Data
Tangential Variables Shallow Data
CH . 3 , PP . 85-98
CH . 7 , PP . 221-223
PERRAULT & CLARK
(2018 )
6
Comparison Between Microsoft Corporation and Apple Inc
Keenya Davis
South University
Comparison Between Microsoft Corporation and Apple Inc
Apple and Microsoft both provide top-of-the-line electronics, and both have operated in the market for many years now and are world-famous, so consumers continue to purchase goods. Many considerations are taken into account to de ...
General Environment, Forces of Competition, Future Improvement, Op.docxshericehewat
General Environment, Forces of Competition, Future Improvement, Opportunities, Strength and Weaknesses of Apple Inc.
Introduction
Apple Inc. is a multinational company that was found by Steve Jobs and Steve Wozniak in the year 1976. Since then, the company has able to produce mobile phones, iPads, personal computers and operating systems (Finkle, & Mallin, 2010). The company is successful under the current leadership of Timothy Donald. This paper will discuss the general environment, opportunities, threat, strength and capabilities of the company.
General Environment
The main segments of the general environment that affect Apple is the technology and social-cultural aspects. Technology has enabled the company to produce innovative and attractive products which attract customers. The socio-cultural segment of general environment involves values and attitude of people about products of the organization.
Technological Segment of the Environment
The technological segment of the environment influences how business operations are conducted—the segment use of advanced techs to design new and innovative products. Apple is ever-growing due to adoption of new and advanced technology. Advancement in technology has stiffened competition in the market. Apple uses better technologies such as wireless technology, cloud services and software to stay ahead in the competition.
Socio-Cultural Segment of the Environment
Social-Cultural segment refers to values and beliefs of people towards products and services of the organization. The positive interest and beliefs of people towards communication and entertainment results in the development of industries that deal with ICT. As a result, Apple incorporation continues to grow due to the interest of society towards its products and services. Similarly, the popularity of internet ad mobile phones leads to the success of the company. The company has prioritized to meet the demands of its customers by producing goods that are innovative and attractive.
Forces of Competition
The forces of competition are five. They include rivalry among competitors, threats of new entrants, threats of substitute commodities, bargaining power of suppliers and bargaining power of customers. In this assignment, rivalry among competitors and the bargaining power of suppliers is discussed.
Rivalry Among Competitors
Apple uses advanced technology and innovation to produce goods that are uniquely designed. The company make use of brand management to ensure its products are unique and innovative. The company has introduced produced products with a new feature, designs and performance to maintain market distinctness. All these changes have enabled Apple to stay ahead of the competition.
Apple should launch more products with unique design and features to stand out in the market. The company should also products other products and software to maintain market distinctness. The products should have new and updated features, version and ...
Full strategic case analysis for Apple incorporation including industry , competitor's and firm's self analysis. It covers all the strategic issues facing the industry and Apple inc. as well as the recommended solutions for these issues on business and corporate levels.
The study shows the development on the Apple Inc. mission& vision and the strategic objectives over time.
12 External and Internal Environments Mikia DixonBusiness BenitoSumpter862
1
2 External and Internal Environments
Mikia Dixon
Business Admin. Capstone BUS499
Professor Joseph Keller
November 11, 21
Apple corporation's general environment plays a significant role in influencing its working mechanisms both locally and internationally. External influences in the company distant or macro-environment have a direct impact on the company's performance. In the consumer electronics and information technology services industries, the company's performance is due to strategic management that exploits opportunities and defends the company from risks. Two of the most highly ranked general environment factors of the company include technology and economic environment factors.
Technology and technology breakthroughs are examined to identify company opportunities and dangers in the present and the future. Apple has a chance to grow by offering its technology services to a wider range of customers and institutions thanks to the growing importance of technology integration in business. For Apple to keep up with its competition, the company needs to release new goods more frequently. Apple's brand image and financial performance are negatively impacted by Apple's competitors' low-cost offerings of high-value technical products. Samsung, for example, has maintained its position in the PC market, whereas Apple has lost it. Competition from low-cost, high-tech rivals has contributed to this situation. Apple now has a big chance to take advantage of the growing demand for cloud computing services by establishing an extended cloud framework. The technological environment is likely to impact the future steps taken by the company because presently, this field is filled with numerous players who are all gearing towards competing with apple. With the new emerging trends in technology, the company is highly obligated to have working mechanisms that protect them from any threat from external sources such as competitors.
The economic environment impacts the working mechanisms of apple corporation in numerous significant ways. With the set-up of the modern global market dynamics, apple's success as a company relies on the sales made. For sales to be made, there must be markets that are dependent on good economies. According to MBA school Team (2021), Apple Corporation has numerous expansion opportunities. For instance, economic stability in industrialized countries, rapid economic growth in developing countries, and disposable income among target consumers. However, it is important to keep in mind all the competing factors in the worldwide marketplaces when investigating economic opportunities. In the context of major international corporations like Samsung and Huawei, these external strategic drivers represent growth opportunities for the company and its competitors.
Five forces of competition, also known as the Porter five forces analysis, are those elements that determine the success of a corporation through a comprehensive analysis of t ...
More Related Content
Similar to Writing Sample - Equity Research - AAPL
A free version of Apple Inc. SWOT analysis 2016. To get the full presentation buy the SWOT here: https://www.strategicmanagementinsight.com/swot-analyses/apple-swot-analysis.html
Quadrant Strategic Objective Measure Target for YearFinanc.docxmakdul
Quadrant Strategic Objective Measure Target for Year
Financial
Be profitable at the end
of the year profit margin Breakeven
Customer
Grow business by
focusing on gaining
customer and
outstanding customer Market share
5%
Operation
Build on to the Apple
name and expand brand
Marketing campaign
with a developed
plan in place 4 months
Learning and Growth
Employees have proper
training and knowledge
to expand brand Training hours 20 hours
Running Head: APPLE CORPORATION
APPLE CORPORATION
7
Daniel Price
Professor Keen
BUS/475
Week 4
Apple Corporation
Apple Corporation
Introduction
Apple Corporation is an American universal technology company with its headquarters in Cupertino, California. It deals with developing computer software and designing and selling consumer electronics. It also offers online services. The hardware products of Apple include smart phones, iPads, iPods and personal computers. The consumer software includes the iTunes media player, iOS operating system, OS X and the Safari web browser. Its online services include the iOS App Store, iCloud, Mac App Store and the iTunes store.
Apple Corporation was founded by a group of associates on 1st April 1976 to design and sell personal computers. It was however incorporated as Apple Computer Inc. on 3rd January 1977 only to be renamed thirty years later to Apple Inc due to its focus on consumer electronics. It is the largest technology firm in terms of total assets and revenue and the second mobile manufacturer after Samsung. It has a net worth of over 700billion USD with over one hundred thousand employees and over four hundred retail stores around the world. Apple Inc. has over one billion products in the market as at May 2016.
However, the aim of this paper is to develop strategic objectives in the measurement of attaining company's vision and mission based on a balanced scorecard taking into account different perspectives of the whole company. The balanced scorecard contains the financial perspective, Customer value, Internal Operations and Employee perspective.
Financial Perspective
Apple Corporation is the world’s largest technology company based on total assets and revenue valued at over 700 USD as at May 2016 (Ingram, 2008). It is also the world’s second largest mobile phone manufacturer. Apple Corporation Inc entered the top ten Fortune 500 list of publicly traded companies on May 2013. It announced a dividend of $0.57 in May 2016 after earning revenue of $51.5 billion and a net profit of $11.1 billion which was a 22% increase in revenue from the previous year. Apple Inc has transferred 90% of its cash and marketable securities outside the United States, which is about 234billion USD due to tax purposes. In 2015, the company accumulated over 80% of the total earnings made by the eight largest universal smart phone manufacturers.
High tax rates in the United States pose big threat to the profitability of Apple Corporation Inc. In ord ...
Running Head Apple CompanyApple Company.docxSUBHI7
Running Head: Apple Company
Apple Company
Apple Company
Name
Course
Date
Apple Company
The products at apple include Ipads, IPhones, Tablets, macintosh, Apple TV. These items have done well in the market and their request is still high. The organization Apple Inc. begun in 1977 January, 3. The organization has composed items like advanced music players, PCs related programming, which are one of a kind in nature. The organization has done enormously well with regards to advancement and making of astounding and great products that have intensely beaten their opponent in the market. This paper is an outlook on the structure, products and nature of the apple company with regards to stakeholders and corporate social responsibility.
Apple's achievement is their craft of offering magnificent client benefit understanding and in-store better alternatives. The Company gives assortment of items and even the sales people use wonderful language. Apple evaluated that just about half of individuals purchasing Apple items are new clients. Apple has utilized talented and experienced group of offers representatives who have added to organization's prosperity. The organization in 2002 opened tech retail I Tokyo, Japan and there after the organization has kept on opening more shops all around. Their retail technique has truly worked to support them in this manner with higher returns compared to their counterparts (Francois nonnenmancher, 2004).
Apple's hierarchical structure is one of the variables adding to the organization's fruitful advancement. An association's authoritative structure can make open doors for business development. However, it can likewise force restrains on how the firm creates. For Apple's situation, the hierarchical structure is principally a conventional pecking order, with some key components from different sorts of authoritative structure. The achievement of the organization is connected to advancement and the authority of Steve Jobs, however its hierarchical structure is halfway in charge of guaranteeing support for such administration. Presently, under Tim Cook's administration, Apple has rolled out some little improvements in its hierarchical structure to suit market and industry requests.The advantages of Apple's various leveled hierarchical structure incorporate tight control controlled by senior administration over all parts of the business. Also, advancement openings rouse representatives to perform well and there are clear levels of expert and duty. On the negative side, Apple's progressive authoritative structure may trade off adaptably off the business to reflect changes in the worldwide commercial center. Moreover, in various leveled associations correspondence across various offices has a tendency to be less compelling than in level associations (Dudovskiy, 2018).
Unveiled over 10 years ago, the iPod is the one gadget that changed Apple from a PC organization into a mass-advertise hardware monster and would late ...
Running head EXTERNAL ENVIRONMENT SCAN—APPLE .docxjoellemurphey
Running head: EXTERNAL ENVIRONMENT SCAN—APPLE 1
EXTERNAL ENVIRONMENT SCAN—APPLE 5
External Environment Scan—Apple
An environmental scan is vital for every company as it helps to determine the threats and opportunities that are posed to the company. The following will be included in the environment scan of Apple incorporated: economic factors, political factors, legal factors, societal factors, technological factors, geographic factors and Porter’s five forces.
Key Factors and Trends
The economic environment of the company is determined by factors such as taxation policies, exchange rate, inflation, the economy, living standards, the average income and consumer buying power. Apple’s products main target market are people of medium to high income and standards. In an economic boom, the company’s products are more likely to be bought than during a recession. The rapid growth of developing countries provide an opportunity for Apple to venture into new markets.
Political stability can be a threat to Apple’s products. Poor political stability would mean a reduction in sales and distribution of the products would be hard as trade barriers would be imposed. Various trade policies that could be imposed on a country would have an adverse effect on the company’s sales. However, developing countries create an opportunity for Apple expand its customer base as more free trade policies are put into effect. As Lombardo (2015) states, “Additional free trade policies increase the opportunities for Apple to distribute more of its products to various markets around the world” (section 2).
Social-cultural factors, such as lifestyle, living standards, and demographics important to Apple. Social factors have an effect on consumer behavior and expectations. The increase in mobile phone use and social media is an opportunity for Apple to provide easy-to-use smart phones.
Current technology and technological changes can affect a customer’s priorities changing the demand for Apple products. For example, with the increasing popularity of Cloud computing, Apple can use that to bring in customers and retain their existing customers. Apple has taken advantage of this by making it so that information can be transferred between the different apple devices and between family members. “Everything’s better when shared, and sharing has never been easier” (Apple, 2016, section 3).
Legal factors can also create a threat to Apple. As governments become more aware of privacy issues in relation to digital technology, stricter regulations are imposed on companies like Apple. This poses a threat to Apple as they are now required to develop a product that not only meets consumer demand, but also the privacy regulations imposed by the government. Stricter regulations have been implemented on telecommunications therefore increasing threats to Apple. ...
This presentation discusses one of the business concept i.e. startups and one of the top rated multi national startup company, Apple Inc. Also it includes various points like risks associated, market scenario, steps to make a startup successful and other various topics. Take a look.
This document is originally written by AssignmentWOrkHelp. This report explains the successful running of the business of the Apple company. This shows the detail description of the factors influencing the future business, its internal analysis
and the reason of the success of the apple business.For more information, contact https://www.assignmentworkhelp.com/contact/
Day 7HEALTH COMMUNICATION EVALUATION RESEARCHEvOllieShoresna
Day 7
HEALTH COMMUNICATION
EVALUATION RESEARCH
Evaluation Research
Homework
AGENDA
PROGRAM
EVALUATION
ACTIVITIES....
USEFUL
FEASIBLE
ETHICAL
ACCURATE (CDC, 2010)
WHAT IT IS?
https://meera.snre.umich.edu/evaluation-what-it-and-why-do-it#should
How is it Done?
ID Program Elements to Monitor
Select Key Evaluation Questions
(CDC, 2010)
Determine How Info will be Gathered
Develop a Data Analysis & Reporting Plan
Develop a Timetable & Budget
ID Program Elements to Monitor
MONITORING /PROCESS
EVALUATION
REACH
FIDELITY
WHO , HOW , WHAT ,
WHETHER
(CDC , 2010)
WHAT DO SOME BASIC
EVALUATION QUESTIONS
INCLUDE?
WHAT SHOULD YOU FIND
OUT FROM
STAKEHOLDERS?
Select Key Evaluation Questions
(CDC, 2010)
Determine How Info will be Gathered
EXPERIMENTAL DESIGNS
CORRELATIONAL DESIGNS
QUASI-EXPERIMENTAL DESIGNS
CASE STUDY DESIGNS
QUANTITATIVE QUALITATIVE
(CDC, 2010)
DEVELOP A DATA ANALYSIS & REPORTING PLAN
INCLUDE HOW THE DATA FOR
EACH MONITORING &
EVALUATION QUESTION WILL BE
CODED , SUMMARIZED &
ANALYZED
DESCRIBE HOW MONITORING &
EVALUATION DATA WILL BE
REPORTED
(CDC, 2010)
DEVELOP A
TIMETABLE &
BUDGET
YOUR TIMELINE SHOULD
COVER . . . .
(CDC, 2010)
YOUR BUDGET SHOULD
INCLUDE . . . .
https://www.cdc.gov/eval/materials/index.htm
https://www.cdc.gov/eval/materials/index.htm
https://www.youtube.com/watch?v=XNR3KZzDoGQ
https://www.cdc.gov/healthcommunication/pdf/evaluationplanning.pdf
(Kreps , 2014)
EVALUATION RESEARCH CAN
ANSWER...
THE NEED FOR EVALUATION DATA
ID Problems
Guide design interventions
Examine costs & benefits
Advocate for needed support
(Kreps , 2014)
(Kreps , 2014)
THE NATURE FOR EVALUATION
DATA
Good evaluation data provides health COM program providers with critically
important information regarding the following...
VALIDITY OF EVALUATION RESEARCH
(KREPS , 2014 )
No research is better than research done poorly
Consider limitations of research
Internal validity
External validity
(Kreps , 2014)
FORMATIVE & SUMMATIVE
EVALUATION RESEARCH
"formative research looks at key parts of health communication interventions,
providing a microscopic analysis of individual components and influences of the
programs, summative research looks at the big picture of the overall influences of
health communication intervention programs."
METHODOLOGICAL ISSUES...
(KREPS , 2014 )
Cross-Sectional Data Self-Report Data
Tangential Variables Shallow Data
CH . 3 , PP . 85-98
CH . 7 , PP . 221-223
PERRAULT & CLARK
(2018 )
6
Comparison Between Microsoft Corporation and Apple Inc
Keenya Davis
South University
Comparison Between Microsoft Corporation and Apple Inc
Apple and Microsoft both provide top-of-the-line electronics, and both have operated in the market for many years now and are world-famous, so consumers continue to purchase goods. Many considerations are taken into account to de ...
General Environment, Forces of Competition, Future Improvement, Op.docxshericehewat
General Environment, Forces of Competition, Future Improvement, Opportunities, Strength and Weaknesses of Apple Inc.
Introduction
Apple Inc. is a multinational company that was found by Steve Jobs and Steve Wozniak in the year 1976. Since then, the company has able to produce mobile phones, iPads, personal computers and operating systems (Finkle, & Mallin, 2010). The company is successful under the current leadership of Timothy Donald. This paper will discuss the general environment, opportunities, threat, strength and capabilities of the company.
General Environment
The main segments of the general environment that affect Apple is the technology and social-cultural aspects. Technology has enabled the company to produce innovative and attractive products which attract customers. The socio-cultural segment of general environment involves values and attitude of people about products of the organization.
Technological Segment of the Environment
The technological segment of the environment influences how business operations are conducted—the segment use of advanced techs to design new and innovative products. Apple is ever-growing due to adoption of new and advanced technology. Advancement in technology has stiffened competition in the market. Apple uses better technologies such as wireless technology, cloud services and software to stay ahead in the competition.
Socio-Cultural Segment of the Environment
Social-Cultural segment refers to values and beliefs of people towards products and services of the organization. The positive interest and beliefs of people towards communication and entertainment results in the development of industries that deal with ICT. As a result, Apple incorporation continues to grow due to the interest of society towards its products and services. Similarly, the popularity of internet ad mobile phones leads to the success of the company. The company has prioritized to meet the demands of its customers by producing goods that are innovative and attractive.
Forces of Competition
The forces of competition are five. They include rivalry among competitors, threats of new entrants, threats of substitute commodities, bargaining power of suppliers and bargaining power of customers. In this assignment, rivalry among competitors and the bargaining power of suppliers is discussed.
Rivalry Among Competitors
Apple uses advanced technology and innovation to produce goods that are uniquely designed. The company make use of brand management to ensure its products are unique and innovative. The company has introduced produced products with a new feature, designs and performance to maintain market distinctness. All these changes have enabled Apple to stay ahead of the competition.
Apple should launch more products with unique design and features to stand out in the market. The company should also products other products and software to maintain market distinctness. The products should have new and updated features, version and ...
Full strategic case analysis for Apple incorporation including industry , competitor's and firm's self analysis. It covers all the strategic issues facing the industry and Apple inc. as well as the recommended solutions for these issues on business and corporate levels.
The study shows the development on the Apple Inc. mission& vision and the strategic objectives over time.
12 External and Internal Environments Mikia DixonBusiness BenitoSumpter862
1
2 External and Internal Environments
Mikia Dixon
Business Admin. Capstone BUS499
Professor Joseph Keller
November 11, 21
Apple corporation's general environment plays a significant role in influencing its working mechanisms both locally and internationally. External influences in the company distant or macro-environment have a direct impact on the company's performance. In the consumer electronics and information technology services industries, the company's performance is due to strategic management that exploits opportunities and defends the company from risks. Two of the most highly ranked general environment factors of the company include technology and economic environment factors.
Technology and technology breakthroughs are examined to identify company opportunities and dangers in the present and the future. Apple has a chance to grow by offering its technology services to a wider range of customers and institutions thanks to the growing importance of technology integration in business. For Apple to keep up with its competition, the company needs to release new goods more frequently. Apple's brand image and financial performance are negatively impacted by Apple's competitors' low-cost offerings of high-value technical products. Samsung, for example, has maintained its position in the PC market, whereas Apple has lost it. Competition from low-cost, high-tech rivals has contributed to this situation. Apple now has a big chance to take advantage of the growing demand for cloud computing services by establishing an extended cloud framework. The technological environment is likely to impact the future steps taken by the company because presently, this field is filled with numerous players who are all gearing towards competing with apple. With the new emerging trends in technology, the company is highly obligated to have working mechanisms that protect them from any threat from external sources such as competitors.
The economic environment impacts the working mechanisms of apple corporation in numerous significant ways. With the set-up of the modern global market dynamics, apple's success as a company relies on the sales made. For sales to be made, there must be markets that are dependent on good economies. According to MBA school Team (2021), Apple Corporation has numerous expansion opportunities. For instance, economic stability in industrialized countries, rapid economic growth in developing countries, and disposable income among target consumers. However, it is important to keep in mind all the competing factors in the worldwide marketplaces when investigating economic opportunities. In the context of major international corporations like Samsung and Huawei, these external strategic drivers represent growth opportunities for the company and its competitors.
Five forces of competition, also known as the Porter five forces analysis, are those elements that determine the success of a corporation through a comprehensive analysis of t ...
Similar to Writing Sample - Equity Research - AAPL (20)
12 External and Internal Environments Mikia DixonBusiness
Writing Sample - Equity Research - AAPL
1. Student Investment Management Report
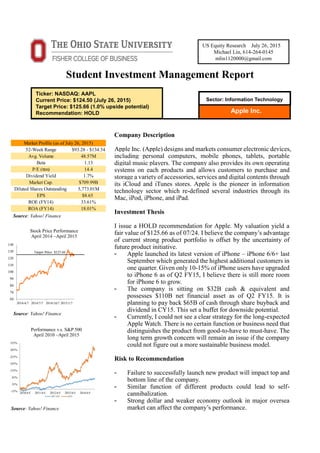
Company Description
Apple Inc. (Apple) designs and markets consumer electronic devices,
including personal computers, mobile phones, tablets, portable
digital music players. The company also provides its own operating
systems on each products and allows customers to purchase and
storage a variety of accessories, services and digital contents through
its iCloud and iTunes stores. Apple is the pioneer in information
technology sector which re-defined several industries through its
Mac, iPod, iPhone, and iPad.
Investment Thesis
I issue a HOLD recommendation for Apple. My valuation yield a
fair value of $125.66 as of 07/24. I believe the company’s advantage
of current strong product portfolio is offset by the uncertainty of
future product initiative.
- Apple launched its latest version of iPhone – iPhone 6/6+ last
September which generated the highest additional customers in
one quarter. Given only 10-15% of iPhone users have upgraded
to iPhone 6 as of Q2 FY15, I believe there is still more room
for iPhone 6 to grow.
- The company is sitting on $32B cash & equivalent and
possesses $110B net financial asset as of Q2 FY15. It is
planning to pay back $65B of cash through share buyback and
dividend in CY15. This set a buffet for downside potential.
- Currently, I could not see a clear strategy for the long-expected
Apple Watch. There is no certain function or business need that
distinguishes the product from good-to-have to must-have. The
long term growth concern will remain an issue if the company
could not figure out a more sustainable business model.
Risk to Recommendation
- Failure to successfully launch new product will impact top and
bottom line of the company.
- Similar function of different products could lead to self-
cannibalization.
- Strong dollar and weaker economy outlook in major oversea
market can affect the company’s performance.
Apple Inc.
US Equity Research July 26, 2015
Michael Lin, 614-264-0145
mlin1120000@gmail.com
Sector: Information Technology
Ticker: NASDAQ: AAPL
Current Price: $124.50 (July 26, 2015)
Target Price: $125.66 (1.0% upside potential)
Recommendation: HOLD
Stock Price Performance
April 2014 –April 2015
Performance v.s. S&P 500
April 2010 –April 2015
Source: Yahoo! Finance
Source: Yahoo! Finance
Source: Yahoo! Finance
52-Week Range $93.28 - $134.54
Avg. Volume 48.57M
Beta 1.13
P/E (ttm) 14.4
Dividend Yield 1.7%
Market Cap. $709.99B
Diluted Shares Outstanding 5,773.01M
EPS $8.65
ROE (FY14) 33.61%
ROA (FY14) 18.01%
Market Profile (as of July 26, 2015)
2. OSU Student Investment Management July 26, 2015
2
Table of Contents
Company Overview…………………………………………………………3
Business Segments………………………………………………………3
Business Model………………………………………………………….4
Industry Overview and Competition Positioning……………………......5
Current Issues…………………………………………………………....7
Business Trend…………………………………………………………..9
Investment Thesis………………………………………………….……....10
Economic Analysis…………………………………………………..…10
Financial Analysis…………………………………………………...…11
Risk…………………………………………………………........................12
Supply Chain Risk………………………………………………….......12
Competition Risk……………………………………………………….12
Currency Risk…………………………………………………………..12
Valuation…………………………………………………………...............12
DCF Valuation………………………………………………………….12
Relative Valuation…………………………………………...…………14
Risk to Target Price…………………………………………………….15
Conclusion…………………………………………………………............15
Appendices…………………………………………………………............16
Works Cited………………..………………………………………............20
3. OSU Student Investment Management July 26, 2015
3
Company Overview
Founded at 1977, the Cupertino, California based consumer electronic
provider is now the largest public company in the world with $710B market
cap at the end of Q3 FY15. The company’s revenue can be broken down
into six regions: Americas: 46.3%, Europe: 28.1%, Greater China: 21.0%,
Japan: 13.7%, Rest of the Asia Pacific: 6.9% and Retail: 8.9% (Figure 1).
Apple designs and markets its product and outsources the manufacturing
process. While most of its peers use Windows and Google’s operation
system and follow the open source strategy, Apple provides its own
operating system and leaves less room for programmers to adjust to its
system. Similarly the company put more control on the hardware; for
instance, instead of using Intel or Qualcomm’s processor, the company
design its own CPU. This strategy leads to better integration between
software and hardware which leads to the company’s 30% installed base
market share in premium smartphone market. Another obvious advantage of
the closed platform strategy is that there are less viruses on Apple’s platform.
Unlike its competitors, Apple operates its own retail stores that accounts for
28% of the company’s revenue. The company’s revenue and net income are
$182.8B and $39.5B in FY14; the growth rates are 7.1% and 6.8%
respectively (Figure 2).
Business Segments
Apple currently reports six product segments – iPhone, iPad, Mac, iPod,
Accessories, and iTunes, Software and Services (Figure 3). The new
products such as Apple Watch and Apple Pay will be discussed in Current
Issues.
iPhone
iPhone is the most important product for Apple which represents 55.8% of
revenue. This segment enjoyed 41.9% CAGR in sales for the past five years.
Thanks to constant upgrade of its product, the ASP remains constant. iPhone
is estimated to have 20% unit sales market share by Q4 CY14. The company
sold 169M units of iPhone in FY14 at an average price of $602 (Figure 5).
Macintosh (Mac)
This segment accounts for 13.2% of revenue. As a more mature product,
Mac segment saw more cyclical revenue growth with 8.3% CAGR for the
past five years. This segment is facing a decreasing ASP trend for the past
decade due to fierce competition and short product life cycle. The company
sold 18.9M units of Mac computer at an average price of $1,273 in FY14.
iPad
Since its debut in CY11, the iPad business had grown rapidly to become the
second largest revenue generator which contributes 16.6% of sales in FY14.
However, iPad’s market share dropped dramatically from 70% to 30%.
Furthermore, after three years of rapid growth, this segment faced a 4% sales
decline in FY14. The pale result of iPad is due to lack of innovation and
increasing competition. In addition, iPad mini could also be negatively
Figure 1: Revenue Breakdown by Region
Figure 3: Revenue Breakdown by Product
Figure 2: Revenue & Net Income/Growth
Figure 4: Tablet v.s. Phablet
Source: Company Data
Source: Company Data
Source: Company Data
Source: IDC, Company Data
4. OSU Student Investment Management July 26, 2015
4
impacted by the large iPhone 6+, which is similar to the mini tablet (Figure
4). In addition, the ASP declined constantly after its appearance. Unless the
company develop new function, iPad will stay as an accessory rather than a
necessity.
2010 2011 2012 2013 2014
ASP iPhone 629.6 636.3 629.3 607.5 602.7
ASP Mac 1279.4 1301.6 1278.8 1314.7 1273.6
ASP iPad 664.8 628.4 530.7 450.2 445.5
Services
Due to the well-established ecosystem the company built and the
comprehensive compliment application, Apple has a 13.1% sales from
services, which cannot be seen in other handset providers. The revenue of
this segment come from sales on iTunes, commission from application
developers and most recently, the fee from Apple Pay.
iPod
The portable digital music device Apple created was once a disruptive
innovation that, along with the iTunes platform, has shaken the music
industry. However, iPhone is now replacing iPod in every aspect; therefore,
this segment only contribute 1.3% of sales and experienced 48% and 21%
sales decline for FY14 and FY13. The company sold 14M units of iPod at
an average price of $159 during FY14.
Business Model
Apple achieves today’s success through constant innovation. However, the
fact that it needs to continuously bring in groundbreaking products also
shows the company’s dependent on unpredictable innovation to maintain
current size. For the growing segment such as iPhone, this drawback has not
affected current performance since the company only needs to upgrade and
add in more features to sell the product at a higher price. However, the short
product life cycle is hurting the mature businesses such as Mac and even
iPad. The company saw constant price drop and decline in units sold even
when it upgraded those products every year (Figure 6 & 8). This very
phenomenon is also due to pricing strategy, the premium consumer
electronic device providers usually set higher price on the debut of new
products to attract heavy users, lower the price when the product has become
less trendy, phase out the products when they cannot meet the new functions
that other products serve. Therefore, the assumption that the revenue or free
cash flow can grow in line with the economy is not suitable for this industry.
Figure 5: Product ASP (M)
Figure 6: Mac ASP
Source: Company Data
Source: Company Data
5. OSU Student Investment Management July 26, 2015
5
Although facing harsh environment, Apple is the best among its peers to
widen the moat. The self-built operating system not only differentiates itself
from its peers by delivering first class user experience but also increases the
switching cost and network externality. Users are inclined to stick with the
same operating system which they are familiar with to save time.
Furthermore, consumers are likely to choose the platform with more
applications. Currently, there are 1.2M applications for iOS and 1.3M for
Android. In contrast, there are only 0.3M application for the third largest
Window operating system’s users to download (Figure 7). Without many
popular applications in other operating systems, the current duopoly
situation in mobile OS is very likely to stay intact. Apple Watch is another
way to increase the network effect among devices; moreover, services such
as Apple Pay also aim at increasing customers’ stickiness through
memorizing users’ personal information.
Unlike many other mega-size corporations, Apple achieves today’s scale
through organic growth and in-house development of most of its important
products. The company has seldom acquired other companies to seek
growth. Figure 9 lists all the acquisitions larger than $100M Apple made
since 1997. The only large acquisition the company made is the $3B deal to
purchase Beats Audio to enhance Apple’s audio quality.
Industry Overview and Competitive Positioning
Personal Computer
An ally among Microsoft, Intel and their downstream customers such as HP,
Dell, Asus is the primary competitor of Apple in the personal computer
industry. The user base of Apple’s OS is still significantly lower than that of
the Window’s system – as of February 2014 the OS X market share is a mere
7.69% compare to Windows’ 90.62% (Figure 10); however, the ASP for
Mac is twice as much as that of its competitors. Mac has grown faster than
its peers and has reached its highest market share record of 13.4% in Q3
FY14 in the U.S. market.
Date Company
Price
(Millions)
Apple
Product
28-May-14
Beats Music &
Beats Electronics
$3,000 iTunes
2-Dec-13 Topsy $200
22-Nov-13 PrimeSense $345
26-Jul-12 AuthenTec $356 Touch ID
20-Dec-11 Anobit $500
14-Apr-10 Siri Inc $200 Siri
27-Apr-10 Intrinisty $121 A5
5-Jan-10 Quattro $275 iAds
7-Jul-08 PA Semi $270 A4, A5
2-Sep-97
Power Computing
Company
$110
7-Feb-97 NeXT $404 OS X
Figure 7: No. of App on each OS
Figure 9: Acquisition Larger than $100M
Figure 8: iPad Units Sold and ASP
Figure 10: PC OS Market Share
Source: Statisita
Source: Company Data, Wells Fargo Security
Source: Company Data
Source: Ars Technica
6. OSU Student Investment Management July 26, 2015
6
Smartphone
The competition landscape is similar for the smartphone business. Google
and Qualcomm provide the operating system and chips for Apple’s
competitors such as Samsung, HTC and LG, etc. Apple loses its ground in
terms of OS user base market share to Android for the past three years,
which has grown from 50% to 80%. However, Apple maintains a significant
higher ASP than it peers, which is around $600 compared to $300.
Samsung is the only significant threat of Apple in high end smartphone
business. Those two companies together have captured more than 93%
market share of high end (price > $500) smartphone market (Figure 13). The
high end market is growing faster than the low end market (Figure 15).
Those two companies have filed over 40 patent lawsuits against each other
in many major countries for the past 4 years. However, they dropped patent
disputes outside of the U.S. as of last August. The fact that Samsung
produces and sometimes controls the market of several key components
such as CPU manufacturing, memory chips, LCD panel, and AMOLED
panel, makes the Korean conglomerate a real threat of Apple. Apple and
Samsung are the only two companies that can turn sales into profit – Apple
dominates 81% of operating income of the whole smartphone industry while
Samsung takes the rest.
iPad
As the pioneer of tablet business, Apple once dominated this market;
however, without meaningful ways to bundle iPad with iPhone or Mac
together through exclusive function and low switching cost, the tablet
market has gradually become fragmented with many players fighting for the
market. Samsung is again the chief competitor in this field with other
traditional PC players such as Asus, Lenovo, and Hewlett Packard trying to
gain market share (Figure 14). However, the overall tablet market did not
see growth during CY14; moreover, with the market leader Apple setting its
iPad’s price in the range between $400 to $600, which is even lower than
that of its iPhone, this line of business is not lucrative for most players.
Figure 11: Mobile OS Market Share
Figure 12: Smartphone ASP
Figure 13: High End Phone Market Share
(>$500)
Figure 14: Tablet Market Share
Figure 15: Smartphone Growth Rate
Source: IDC
Source: BMO Capital Market, Company Data
Source: IDC, Credit Suisse
Source: Gartner, UBS
Source: IDC, Credit Suisse
7. OSU Student Investment Management July 26, 2015
7
Current Issues
Apple Pay
Apple announced its plan to penetrate into payment industry by providing
Apple Pay service through its iPhone 6/6+, Apple Watch-compatible devices
(iPhone 5 and later models), iPad Air 2, and iPad Mini 3. This service
enables users to make payment in both retail stores and online checkout.
Apple Pay adopts the near field communication (NFC) technology.
Different from Apple’s previous strategy of vertical integration and
unwillingness to collaborate, Apple Pay will join force with Visa's PayWave,
MasterCard's PayPass, and American Express's ExpressPay system. The
service was exclusive to the United States market initially with international
expansion plan in the future. Apple has entered into Canada in March 2015.
There was an estimated amount of 220,000 vendors participating in Apple
Pay at the service’s debut. Macy’s, Bloomingdale, Walgreen, Subway,
McDonald’s, Uber, Groupon, Panera Bread, Target, and Wholefoods are the
initial vendors to team up with Apple while Walmart and Best Buy stated
they will not accept Apple Pay. The need to upgrade the Point of Sale (POS
system) in order to accept Apple Pay and the fact that there are many
alternative ways of payment might lower some vendors’ interest to join.
Unlike the traditional credit card transaction, Apple Pay does not require
users to transfer personal information; instead, Apple borrowed Bitcoin’s
idea of creating a single-used token and transfer the token to finish the
transaction. The information of the token (or dynamic security code) will
stay between the customers, banks and the vendors, Apple stated that they
would not track the usage to gather customers’purchase habits. This method
is said to be safer than the tradition credit card.
Apple Watch
Apple Watch is the smart watch created by Apple, and announced by CEO
Tim Cook in September 2014. The main features that have been revealed
are health monitoring and fitness tracking. The smart watch is integrated
with iOS and other Apple’s services and products. Customers can perform
services such as Apple Pay, receiving phone call, sending iMessages and
SMS texts, map services and run third-party applications. Siri, the personal
assistant is also embedded on Apple Watch.
However, Apple Watch also depends on iPhone to conduct significant
functions. For instance, the Watch needs to pair up with iPhone to play the
music.
The screen of the watch is a pressure-sensitive touch screen that can detect
the difference between a tap and a press; only two buttons are designed on
the Watch. According to CEO Tim Cook, the Watch will be shower proof to
prevent water damage but water submersion is not recommended. All
versions of Apple Watch have 8GB of storage to store up to 2GB of music
and 75MB of photos. The device is also Wi-Fi and Bluetooth 4.0 connectible.
8. OSU Student Investment Management July 26, 2015
8
There are three collections for Apple Watch – Apple Watch Sport ($349 and
$399), Apple Watch ($549 and $1,049), and the 18-karat gold version Apple
Watch Edition ($10,000 and $17,000), each of them has two sizes (38mm
and 42mm) and two colors. Each collection has three to six bands for
customers to choose. The main problem for this product is the short battery
life, which is estimated to last for only 18 hours due to it needs to constantly
connect to iPhone and leading to battery drainage. Apple Watch is available
for sales online on April 24 in nine markets, including the United States,
Australia, Canada, China, France, Germany, Hong Kong, Japan and the
United Kingdom. This product is an indication to see whether the current
management team can take on revolution rather than evolution after the long
gone of its charismatic founder.
Several competitors, such as HTC, LG, Pebble and Huawei have also been
working on the smart watch product to compete with Apple (Appendix 1).
Without revolutionary functions (or even functions that could not be found
on iPhones), the future of the Watch is far from promising. Apple did not
disclose the shipment information during the latest earning release but since
CEO Tim Cook mentioned more than 100% of the growth in “Other”
segment is contributed by Apple Watch during Q3 FY15, we can estimate
the revenue from Apple Watch is somewhere above $900 million.
Apple TV
Apple TV is the unsuccessful product Apple has spent several years working
on. The first release of Apple TV was back in 2007; the company continued
on developing this product and launched the latest TV – Apple TV Rev A in
January 2013; the company attempted to connect consumers’ TVs and
enables them to access iTunes content for Streaming video and all online
services that was accessible on personal computers, such as Netflix,
YouTube, Flickr, Disney Channel, Hulu, HBO GO and WatchESPN.
However, the idea to revolutionize the TV industry as a cornerstone of the
company’s Internet of Things has not yet been realized.
Apple Auto
“Apple is said to have hired hundreds of engineers specializing in Human
Machine Interface, EV batteries and autonomous driving” from major auto
producers “including former head of Mercedes Benz’s R&D division”
(Financial Times, 14, Feb). Although this news has not been confirmed by
the company, it is reasonable for the largest public company to seek growth
in the $1.6 trillion automobile market, which dwarfs the smartphone
industry at $400B and PC industry at $266B. Without legitimate information,
this part of information is not included in the valuation; however, it is
important to note that Apple’s ability to continue innovation is the key to
future success.
9. OSU Student Investment Management July 26, 2015
9
Business Trend
Bring Your Own Devices (BYOD)
The rapid growth of cloud computing and the transformation to more
intellectual and information based working environment have made BYOD
possible. With the increase of cross devices interaction and more
personalized devices and software, employees are more inclined to use their
own devices. A survey done by Mckinsey shows that 44% of job seekers
view an organization more positively if it allows them to bring their own
device. According to industry estimates, the global market for BYOD
created $72B in revenue in 2013. This market is expected to have a 26%
CAGR during 2013 to 2019, which implies a $284B by 2019 (Figure 16).
This on-going trend is beneficial to Apple since the company has low
penetration rate in the corporate market, especially when massive purchases
from big corporation will probably hurt Apple’s high margins. The
popularity and the ecosystem of Apple’s products in consumers area is likely
to spill over into business world if the BYOD remains robust. Furthermore,
if the BYOD becomes a phenomenon, learning Windows system and related
products may no longer be required skills. This can lower PC’s network
effect that prevents Apple from getting more market share. To enhance its
corporate footprint, the company announced an exclusive partnership with
IBM to take advantage of IBM’s big data and analytics capabilities to
implement to iPhone and iPad.
Figure 16: BYOD Market Size and Growth
Rate
Source: Marketandmarket.com
10. OSU Student Investment Management July 26, 2015
10
Investment Thesis
Economy Analysis
Apple’s premium products are considered more luxurious than that of its
peers. As a result, Apple’s performance should be highly cyclical and
depends on the well-being of consumers.
The Consumer Confident Index (CCI) is the indicator to see how likely the
consumers are going to spend more in the future. Figure 18 shows the CCI
has raised dramatically from 20 to 90 from CY08 to CY14. This is a positive
sign for Apple since consumer are now more willing to pay for superior
products.
Another indicator is the U.S. unemployment rate, which has dropped from
10% to 5.5% from CY09 to CY14 (Figure 19). Since 46% of Apple’s
revenue are generated from the Americas, the improvement of the job
market in the United States will have positive impact on Apple’s customer
base. The macro economic factors send positive signal which provide a
tailwind for Apple.
Nevertheless, since Apple is still in its growth stage (for its main product
and future products), and involved in an ever-changing industry, the
innovation is still the single most important driver of growth. For instance,
during the financial crisis in CY08, Apple still grew its revenue thanks to
the launch of its iPhone. R&D is a barometer to see the company’s
willingness to innovate. Figure 17 shows the company has increased its
R&D over revenue from 1.5% to 2.6% from FY12 to FY14. It’s a signal that
even after giving back shareholders tremendous amount of cash, the
company still invested a lot on innovation.
Figure 17: R&D/Revenue
Figure 18: Consumer Confidence Index Figure 19: U.S. Unemployment Rate
Source: Company Data
Source: Conference Board Source: Conference Board
11. OSU Student Investment Management July 26, 2015
11
Financial Analysis
Superior Gross Margin
Apple created significantly higher gross margin through its popular products.
The company’s average gross margin of 40% is twice as high as that of
competitors’ average of 23% (Figure 20). There is also a trend that the
company earn a slightly lower margin on an “s” year, which the company
only upgrades the previous product and has less new product launches
(iPhone 4S, 5C).
Du Pont Analysis
The company keeps a trailing twelve months ROE of 33.61%, compared to
peers’ 11.64%. The astonishing return to equity could be contributed to its
six-time-higher-than-average net income margin, which is at 21.61%. On
the other hand, the company’s leverage remains low – the asset over equity
ratio is a healthy 2.078 times whereas its peers have an average of 3.06 times.
Increasing Leverage and Cash Payback
Through its premium products and rapid sales growth, the company now
possesses $32B of cash and equivalent and $110B of net financial assets by
the end of Q2 FY15. On top of that, as current management took over, the
company has been more willing to increase its leverage and payback the
cash to shareholders. As Figure 22 shows, the company has increased its
debt over asset ratio from 36.4% to 51.9% during the past five years. Apple
is planning to sell another $6.5B corporate bond for FY15. The company
has already paid back $33B and $56B to shareholders in CY13 and CY14
and has started paying dividend since FY12. In April 2014, the management
team decided to increase the company’s cash return program. The company
expects to return over $130B of its cash by the end of CY15 under the
expanded program, with $40B in dividend and $90B in share repurchases.
The company started payback shareholder since CY12. Figure 23 shows
Apple is returning 73% and 112% of its free cash flow to shareholders
mainly through share buyback in CY13 and CY14.
One concern for Apple’s ability to payback shareholders is the repatriation
taxes, which is 30% by now. Since only 11% of the company’s cash are in
the United States, the company will face the huge tax bill if they send the
money back.
AAPL Peers
ROE 35.34% 11.64%
ROA 18.01% 4.11%
Asset/Equity 2.078 3.06
Turnover 0.788 1.45
NI Margin 21.61% 3.41%
Figure 20: Gross Margin Comparison
Figure 21: Du Pont Analysis
Figure 22: Debt/Asset Ratio
Figure 23: Cash Distribution
Source: Bloomberg
Source: Bloomberg
Source: Capital IQ
($ in millions) 2011 2012 2013 2014 2015 2016E
Net Income $25,922 $41,733 $37,037 $39,510 $49,064 $52,149
FCF $33,269 $42,561 $45,501 $50,142 $66,567 $72,999
FCF% of NI 128% 102% 123% 127% 136% 140%
Buybacks $0 $0 $22,860 $45,000 $49,925 $54,749
% FCF for Buybacks 0% 0% 50% 90% 75% 75%
Dividends $0 $2,488 $10,564 $11,126 $16,642 $18,250
% FCF for Dividends 0% 6% 23% 22% 25% 25%
Total FCF Returned $0 $2,488 $33,424 $56,126 $66,567 $72,999
% of Total FCF Returned 0% 6% 73% 112% 100% 100%
Source: RBC Capital Market and Company Data
12. OSU Student Investment Management July 26, 2015
12
Risk
Supply Chain Risk
Apple outsources most of its components and manufacturing process to third
party Asian suppliers. For instance, four Taiwanese companies namely Hon
Hai Precision, Pegaton, Compal and Quanta together assemble most of
Apple’s products. For the company’s state-of-art CPU, only Taiwan
Semiconductor Manufacturing Corporation and Samsung Electronic are
capable of producing the cutting-edge chips. The high definition camera lens
is largely provided by Largen, yet another Taiwanese company. The flash
and other memory chips are mainly from its main competitors Samsung. The
concentration on few providers in same region and the reliance on certain
competitor to provide key components can lead to supply chain risk if any
political or economic uncertainty were to happen.
Competition Risk
Apple faces fierce competition in each product segment. The premium price
the company charges position itself in a riskier situation if an economy
downturn were to happen. The closed platform strategy also puts more risk
on Apple. For instance, if Google stops providing all the services such as
Google map, YouTube, Chrome and its search engine, Apple’s user might
find difficulties in sticking with Apple without those services.
Currency Risk
The on-going strong dollar could be a potential threat to Apple. As EU and
BoJ planning to launch massive quantitative easing, and People’s Bank of
China lowered its prime rate and is also likely to start a quantitative easing
program, the U.S. dollar becomes the strongest currency in the world.
Moreover, Fed’s intention to raise the interest rate almost promises a further
appreciation of dollar. Under this premise, Apple’s oversea revenue, which
is more than 60% of its total revenue could be hurt badly. Although Apple
is involved in currency forward to hedge the currency risk, it is hard for the
company to hedge the risk if the dollar appreciate significantly and stay at
the relatively high level for a long period of time.
Valuation
DCF Model
Although the future cash flow for Apple is more difficult to capture, the DCF
model is still the best and theoretically correct model to forecast the
company’s value. I use a five year forecast period due to the fast-changing
nature of Apple’s business and difficulty to quantify innovation that has not
taken place. Each business segment’s revenue are forecasted separately. The
followings are the assumptions behind the model.
Revenue
Mac: The CAGR of this segment is 8.3% for the past five years, given that
personal computer is a more mature market and competitors keep competing
on price and features, I give this segment a 6% revenue growth for the
13. OSU Student Investment Management July 26, 2015
13
following three years and 4% for the other two.
iPad: Without significant breakthrough in developing new function, the
market size for tablet is relatively limited. The sales for iPad grew at a mere
3% in FY13 and encountered a decline of 5% in FY14. Furthermore, the
larger phone is likely to be the mainstream in the future. This might sabotage
iPad mini’s sells, which accounts for 41% of total iPad sales. Thus, I give a
sharp decline for the forecast period for this segment.
iPhone: iPhone will still be the main driver of Apple’s growth in the
foreseeable future. Based on the company’s past record to publish a new
phone every two years, and launch similar but upgraded version in between
(such as iPhone 4S and iPhone 5C), there is an obvious 2 to 2.5 year cycle.
Moreover, by adding more feature (larger screen), Apple raised its selling
price significantly and received best sales record in respond. However, I
expect its pricing power will deteriorate as the market mature. I forecast the
revenue growth will be 50%, 6%, 15% 6% and 8% for FY15 to FY19. The
huge increase in FY15 is justifiable since Apple sold 76M iPhone 6 during
Q2 FY15 yet only 10% to 15% of iPhone installed base had upgraded to
iPhone 6.Not to mention the company announced the highest additional user
in Q2 FY15. The iPhone 6/6+ is expected to have extremely high penetration
in the growing Asian market where larger screen is popular among
customers. The increase in shipment and price are both factored in to reach
the revenue growth numbers.
Apple Watch: Since the Watch has to pair with iPhone for significant
functionality, I use iPhone installed base (past two years’ shipment unit) to
estimate the Apple Watch’s unit sales. The all-in cost I used for this product
is $450, which is higher than the retail price of $350 since users will need
two wrist straps to work with the watch, which will cost $100 extra. Without
too many wow-factors from the previous product announcement, and the
idea that this product can hardly be a necessity like mobile phones, I use
only 1%, 2%, 3%, 2%, and 2% of iPhone’s forecast installment as Apple
Watch’s penetration into iPhone installed base for the forecast period.
Apple Pay: This segment plays a role to increase customers’ reliance and
would not be a major revenue driver in the near future. However, it could be
a more stable stream of revenue with extremely high margin business for
Apple. Apple charges a 15bps per transaction for interchange fee from banks.
The plastic card transaction volume (including both debit and credit card) is
estimated to be 200B and will grow to 240B by CY18. According to Cowen
and Company’s survey, over 35% of iPhone 6/6+ owners used Apple Pay
service, and among them, 65% use it several times a week. Based on the
positive number, I use a 2% increase of non-cash transaction market share
each year for Apple Pay for the forecast period (exclude online payment
system), starts from a 2% at CY15. After CY19, I assume Apple will change
to a percentage fee of 0.3% commission for each transaction and have a
stable 10% market share of the non-cash transaction.
Services: The services sector includes all the revenue from application,
software and other service excluding the payment service (in my model). As
14. OSU Student Investment Management July 26, 2015
14
a healthier stream of revenue, this segment grew by 13% and 25% for FY14
and FY13. An 8% revenue growth is expected for the following five years.
Others: This segment includes iPod and other accessories. Due to the sharp
decline of iPod’s sales has already taken place – a 48% and 25% decrease
for FY14 and FY13, this segment is forecasted to decline by 2% each year
for the forecast period.
Operating Margin
Apple has the highest customer loyalty in the industry, thus the company’s
ability to maintain margins is better than most competitors. Furthermore, the
increasing revenue from high margin segment such as Apple App store and
Apple Pay can offset the declining ASP for iPad segment. Therefore, I
estimate the company will have operating margin around 28% to 29.5%, and
maintain a 29.5% operating margin which is slightly lower than the past five
years average of 30.7%, at the end of forecast period.
Terminal Growth
As mentioned earlier, the consumer electronic products tend to have short
product life cycle and thus face price decrease; therefore the terminal growth
of these companies should be lower than average. As a result, I choose a 2%
terminal growth rate of free cash flow after the forecast period.
Net Financial Asset
Unlike most other firms which have to borrow money to sustain their
operation, Apple possessed an astonishing $110B net financial asset as of
Q2 FY15. The company can keep running without most of those financial
assets; furthermore, the management team is willing to pay back the excess
cash to shareholders. Therefore, I take $100B of net financial asset into
consideration and reduce the interest income the company will have going
forward.
Discount Rate
The industry Apple is involved in has less durable competitive advantage
and the players face rapid change constantly, which leads to higher business
risk. Companies such as, Nokia, Motorola, Sony and even Apple itself, have
once dominated the market but failed nevertheless; therefore, I believe the
discount rate for most companies in this industry should be higher than
average. Therefore, I use an 11.0% discount rate for Apple.
The model I built yield a target price of $124.88 with a price range from
$118.63 to $131.65.
Relative Valuation
For the relative valuation, I choose Microsoft, Lenovo and Asustek to
compare their operating system, laptop and mobile phone business with
Apple. I do not include Apple’s chief competitor – Samsung in the
comparison since Samsung is involved in other businesses such as
semiconductors, which generates a substantial amount of profit for Samsung.
Price over earing (P/E) and enterprise over EBITDA (EV/EBITDA) method
15. OSU Student Investment Management July 26, 2015
15
are used in the valuation. On the other hand, the price over book (P/B)
method is excluded, since this method fails to measure the enormous brand
name value Apple possess. The target price under this method will be
$128.77, ranging from $92.0 to $154.17
I weight 80% to the DCF and 20% to relative valuation since there are no
close comparison for Apple in the relative valuation model. Furthermore,
the relative valuation model also fails to capture Apple’s wider moat and
higher customers’ loyalty.
Risk to Target Price
The effectiveness of the DCF valuation depends on my forecast on the
company’s revenue, margins, terminal income growth and cost of capital.
The assumption are made given my best knowledge of the company at this
stage. My estimated discount rate is higher than Bloomberg’s WACC.
Should my estimation fail to capture the company’s fundamentals, Apple’s
shares could underperform or outperform.
Conclusion
I believe the current market price of AAPL reflects the company’s intrinsic
value and thus I recommend a HOLD on AAPL with a target price of
$125.66.
- The latest iPhone 6/6+ is expected to generate significant revenue
growth for the company by attracting more new users and retaining the
old customers with a meaningful price increase.
- I believe Apple Pay can increase its popularity and provide high margin
revenue for Apple. This service also increase users’stickiness to iPhone
and its ecosystem.
- Without irreplaceable function, I am not bullish on the long-expected
Apple Watch and assume it will become another expensive leisure
product.
- The company’s dependence on revolutionary innovation for significant
growth is the risk factor for investors.
- The management looks to return $65B of cash to investors in CY15,
the frequent share buyback hedges the downside potential for near term.
19. OSU Student Investment Management July 26, 2015
19
Appendix 4: Relative Valuation
Source: Bloomberg, Analyst Estimate
Price Multiples
Mkt Cap
(USD)
Price-to-earnings (P/E) EV/EBITDA
Apple (AAPL) 711.20B 17.04 7.43
Microsoft (MSFT) 369.40B 15.99 8.39
Lenovo (0992) 12.98B 18.29 9.1
Asustek (2357) 7.23B 12.4 7.14
Competitors Average 15.56 8.21
Target Price 115.4552 142.080315
% chg from Current Price -7.9% 13.4%
20. OSU Student Investment Management July 26, 2015
20
1. Apple Q2 FY15 Earning Call
2. Apple, Larger base, longer cycle, Credit Suisse, Kulbinder Garcha, Achal Sultania, Vlad Rom, William
Chu, Ji Park
3. Apple, Sizing Up The Next Capital Allocation, RBC Capital Market, Amit Daryanani, Mark Sue, Mitch
Steves
4. Autos & Auto-Related, Apple Auto: World’s Most Valuable Company Meets Most Disruptable Industry,
Adam Jonas, Katy Huberty, Ravi Shanker, Jerry Liu, Neel Mehta, Paresh Jain
5. Apple, Big and Loyal Installed Baes Helps, Keith Bachman, Jung Pal
6. Apple, Prolong Product Cycle at Play, Credit Suisse, Kulbinder Garcha, Achal Sultania, Vlad Rom,
William Chu, Ji Park
7. Apple, UBS, Steven Milunovich, Peter Christiansen
8. Lisa Ellis, Jeffrey Saret, and Peter Weed (2012)
9. Marketline, Datamonitor Independent Research 03/18/15
10. Financial Times, 14, Feb.
11. Apple, New Global Survey Says Set-Up Still Favorable; Target to $135, Cowen and Company, Timothy
Arcuri, Bryan Prohm, Karl Ackerman, Wayne Loeb
Work Cited