Download to read offline

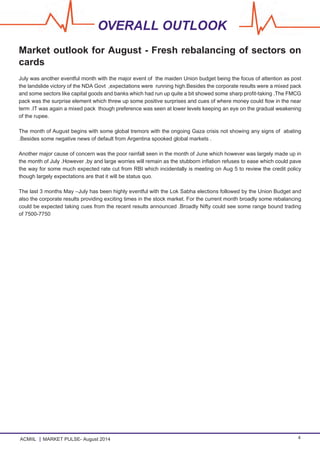
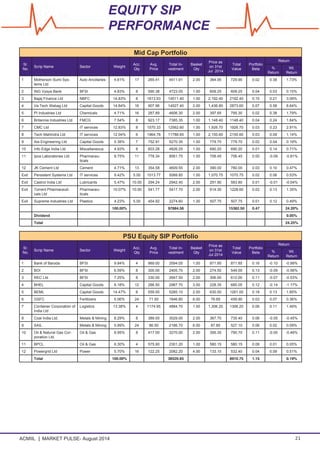


The ACMil Market Pulse for August 2014 provides insights on various market segments including equity, debt, derivatives, forex, commodities, and money markets, along with stock recommendations and market expectations. The report highlights a mixed outlook following significant events like the union budget and corporate results, predicting cautious market rebalancing and sector shifts, particularly towards infrastructure and telecom. It details company analyses such as Finolex Cables, noting strong financials and growth potential, while outlining debt market influences and technical trading perspectives.


