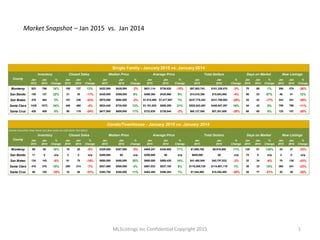
The document provides a market snapshot comparing real estate data from January 2015 to January 2014 and from January 2015 to December 2014 for several counties in California. It shows changes in inventory, closed sales, median and average prices, total sales dollars, days on market, and new listings for both single family homes and condos/townhouses. Overall, inventory increased or decreased slightly across most counties from the previous year while closed sales, median prices, and total sales dollars generally decreased compared to January 2014 and December 2014.
Market Indicators - General Overview - February 2015MLSListings Inc
The document provides market snapshot data comparing real estate metrics in February 2015 to prior periods. It shows changes in inventory, closed sales, median/average prices, total dollar volume, and other figures for single-family homes and condos/townhomes across several counties in February 2015 versus February 2014 and January 2015. Line graphs depict trends over time for inventory levels, closed sales, and new listings in the counties dating back to 2003.
July 2015 - Market Snapshot - General OverviewMLSListings Inc
This document contains market data comparing July 2015 to previous months and years for several counties in California. The key points are:
- Single family and condo/townhouse inventory increased in July 2015 compared to July 2014 across most counties. Santa Clara county saw the largest year-over-year inventory growth at 31%.
- Closed sales were up in July 2015 compared to the previous year for most counties. Santa Clara county again saw the largest increase, with closed sales rising 31% from July 2014 to July 2015.
- Median and average sales prices rose from July 2014 to July 2015 in most counties, with increases ranging from 3% to 14% depending on the county and property type.
May 2015 - Market Snapshot - General OverviewMLSListings Inc
The document provides market data for May 2015 compared to May 2014 and April 2015 for single family homes and condos/townhomes across several counties. Inventory was down or flat year-over-year across most counties. Median and average sale prices were up significantly (12-23%) year-over-year for single family homes. Closed sales were down or flat for single family homes but up for condos/townhomes. Months of inventory exceeded historical averages in most counties.
September 2015 - Market Snapshot - General OvervewMLSListings Inc
- The document provides market snapshot data for single family homes and condos/townhomes in several California counties (Monterey, San Benito, San Mateo, Santa Clara, Santa Cruz) comparing September 2015 to August 2015 and September 2014.
- For single family homes, inventory decreased or remained flat month-over-month but increased year-over-year for most counties. Median and average prices increased for most counties both month-over-month and year-over-year.
- For condos/townhomes, inventory increased month-over-month for most counties while closed sales were mixed; median and average prices generally increased.
This document provides a market snapshot comparing real estate data from June 2015 to June 2014 and May 2015 across several counties. Overall, inventory decreased slightly or remained stable year-over-year in most counties. Closed sales increased in most counties compared to both prior periods. Median and average prices generally increased from the previous June but decreased or remained flat month-over-month in some counties. Total dollar volume of closed sales increased substantially in many counties compared to June 2014.
Market Indicators - General Overview - October 2014MLSListings Inc
The document provides a market snapshot comparing real estate data from October 2014 to October 2013 and from October 2014 to September 2014 for single family homes and condo/townhouses across several counties. The data includes inventory levels, closed sales, median and average prices, total dollar volume, days on market, and new listings. Charts also show historical housing market trends from 2003 through 2014.
April 2015 - Market Snapshot - General Overview MLSListings Inc
This document provides market data for single family homes and condos/townhouses in several counties in California for April 2015 compared to April 2014 and March 2015. The data shows that for April 2015 compared to the previous year, inventory increased for most counties while median and average prices, total dollar volume, and new listings decreased for many counties. Compared to March 2015, closed sales increased for most counties while other metrics like median price and days on market decreased for some counties.
December 2015 - Market Snapshot - General OverviewMLSListings Inc
This document provides a market snapshot comparing real estate data from December 2015 to December 2014 and November 2015 in five California counties. The key findings are:
- Total inventory decreased from December 2014 to December 2015 in most counties, with the largest decreases in Santa Clara and Santa Cruz counties.
- Median home prices increased year-over-year in December 2015 in all counties except Santa Cruz. The largest price increases were in Monterey and San Benito counties.
- Closed home sales increased from November to December 2015 in most counties, with the largest percentage gains in Monterey and San Benito counties.
- Overall the data indicates that while total homes listings have declined, home prices have risen and
August 2015 - Market snapshot - General OverviewMLSListings Inc
- Inventory of single family homes and condominiums increased slightly in August 2015 compared to August 2014 across the major home counties analyzed, with the largest increases in Santa Clara County (38% increase) and San Mateo County (33% increase).
- Closed sales decreased across most counties between August 2015 and August 2014, with the largest drops in Monterey County (22% decrease) and San Benito County (26% decrease).
- Median home prices rose in some counties like Monterey County (4% increase) and San Benito County (7% increase) but fell slightly in others such as San Mateo County (4% decrease) between August 2015 and August 2014.
Market Indicators - General Overview - November 2014MLSListings Inc
The document contains charts and tables analyzing housing market trends in various counties from 2003-2014. It shows statistics on inventory levels, sales, new listings, and median home prices. Inventory levels were down in 2014 compared to previous years. Closed home sales in November 2014 were down 7.4% from November 2013. New listings in November 2014 were down 43.3% from November 2005 levels.
October 2015 - Market Snapshot - General OvervewMLSListings Inc
The document provides a market snapshot comparing real estate data from October 2015 to October 2014 for several counties in California. It shows changes in key metrics like inventory levels, closed sales, median and average home prices. For most counties, inventory increased while closed sales decreased from the previous year. Median and average home prices rose between 4-14% across the counties. The remainder of the document provides additional charts and graphs depicting housing market trends over time for these counties.
February 2016 - Market Snapshot - General OverviewMLSListings Inc
The document provides a market snapshot comparing housing data from February 2016 to February 2015 and January 2016 for several counties in Northern California. It shows that in February 2016 compared to the previous year, inventory increased or was stable in most counties while closed sales and total sales dollars generally increased. Median prices increased year-over-year for single family homes in most counties. The multi-year charts show historical housing inventory, sales, price and days on market trends from 2004 to 2016.
Market Indicators - General Overview - December 2014MLSListings Inc
The document provides housing inventory and sales data for several counties in California from 2004 to 2014. It shows that in December 2014 compared to prior years, total home inventory was down 0.8% in the home counties, with single family inventory increasing in some counties like Monterey but decreasing in others. Home sales were down 24.3% in December 2014 compared to December 2013, with new listings declining by 63.5% over the same period.
January 2016 - Market Snapshot - General OverviewMLSListings Inc
The document provides a market snapshot comparing January 2016 real estate data to January 2015 and December 2015 data across several counties. For single-family homes, inventory increased or remained stable in most counties compared to the previous year while closed sales were up in some counties and down in others. Median and average home prices rose between 3-18% compared to January 2015 across the counties. Total sales dollars increased between 10-69% year-over-year depending on the county.
Market Indicators - General Overview - March 2015MLSListings Inc
The document provides market snapshot data comparing March 2015 to March 2014 and February 2015 for several counties in California. It shows changes in inventory levels, closed sales, median and average prices, total dollar volume, days on market, and new listings for both single-family homes and condos/townhouses. Charts are also included showing historical trends in inventory levels, closed sales, and months of inventory for the counties.
November 2015 - Market Snapshot - General OverviewMLSListings Inc
The document provides a market snapshot comparing housing market statistics from November 2015 to November 2014 and October 2015 for several counties in California. It shows that in November 2015 compared to the previous year, inventory increased for most counties while closed sales decreased. Median and average home prices generally increased between 5-20% year-over-year.
March 2016 - Market Snapshot - General OverviewMLSListings Inc
The document provides market snapshot data comparing March 2016 to March 2015 and February 2016 for several counties in California. It shows that in March 2016 compared to the previous year, inventory increased while closed sales, median prices, and total sales dollars decreased for most counties. Days on market also increased for most counties. Comparing to February 2016, closed sales and new listings increased substantially for all counties while total sales dollars increased over 40% for some counties.
Fraser Valley Real Estate Board Statistics Package Jan 2021Vicky Aulakh
The Fraser Valley real estate market saw record-breaking home sales in January 2021, with 1,718 total sales representing a 76% increase from January 2020. While new listings rose 26% year-over-year, total active inventory was still down 18% from January 2020. The average number of days to sell a single-family detached home dropped to 35 days compared to 60 days in January 2020.
Residential real estate activity in San Francisco decreased in October 2016 compared to the previous year. The median sales price increased 11% for single family homes but only 4.5% for condos. New listings and pending sales declined over 22% and 15% respectively for single family properties, and 16% and 14% for condos. Inventory levels rose for both market segments as demand softened amid low housing supply.
Residential real estate activity in San Francisco County saw encouraging signs in November 2013, though some metrics moderated from multiyear highs. New listings and pending sales decreased month-over-month for both single family homes and condos/co-ops. However, median sales prices continued rising sharply with a 20.4% increase for single family homes and 6.5% for condos/co-ops compared to November 2012. Strong economic data and job growth are supporting the housing recovery. Watch for further tapering of the Federal Reserve's stimulus program in March 2014.
The document provides a monthly snapshot of real estate activity in San Francisco for July 2015. Some key points:
- Median home sale prices increased 18.8% year-over-year for single family homes and 6.3% for condos.
- New property listings declined 17.7% for single family homes and 32.9% for condos compared to the previous year.
- Pending home sales decreased 9.7% for single family homes and 13.5% for condos over the same period.
- The housing market showed signs of stability and strength despite a continued low national homeownership rate near 50-year lows.
Residential real estate activity in San Francisco decreased in August 2016. New listings and pending sales declined for both single family homes and condos/co-ops compared to the previous year. The median sales price increased slightly for single family homes but decreased for condos/co-ops. Low inventory continued to be a challenge, putting upward pressure on home prices.
The Woodlands Homes Sales Report - February 2016Ken Brand
281.367.3531
Fax: 281.292.7272
www.garygreene.com
The Woodlands Texas Real Estate Market Report
February 2016
Listing Inventory
The number of active listings in The Woodlands was 809 in February 2016, up slightly from 788 in January. Compared to a year ago, inventory is up 6.4% from 759 listings in February 2015.
Home Sales
There were 160 homes sold in February 2016, down slightly from 186 homes sold in January. Compared to a year ago, sales were up 19.4% from 134 homes sold in February 2015.
Average Sold Price & Median Sold Price
The average sold price in February 2016 was $
This report shows the market activity for home sales in the Dallas/Ft. Worth area including number of sales, list price and county averages and adjustments.
The real estate market in San Francisco remained strong in April 2016, with several key metrics showing year-over-year increases. The median sales price rose 7.1% for single family homes to $1,400,000, and increased 6.6% for condos to $1,149,000. Meanwhile, new listings declined slightly while inventory levels were up. Overall the market conditions were described as predictable with low interest rates and steady price increases in desirable areas.
- Residential real estate activity in San Francisco saw median home sale prices increase 5.4% year-over-year for single family homes but decrease 2.6% for condos from September 2015 to September 2016.
- New listings were down slightly while pending sales decreased more significantly, and months of inventory increased, indicating a softening market.
- Demand has remained high through 2016 due to factors like millennials buying homes and low interest rates, but lower inventory and months of supply point to a cooling real estate market.
The document summarizes residential real estate activity in San Francisco County for July 2016. It reports that the median sales price increased 6.4% year-over-year for single family homes and 1.0% for condos. New listings were down 23.0% for single family homes and 26.5% for condos year-over-year. Pending sales decreased 20.1% for single family homes but increased 0.4% for condos. Low housing supply has prevented further sales growth despite low mortgage rates and unemployment, as inventory constraints are limiting buyer options and contributing to price increases.
Fraser Valley Real Estate Board Statistics Package January 2020 Vicky Aulakh
- Home sales in the Fraser Valley region of BC were 6% above the 10-year average for January while new listings were 11% below average.
- 974 total property sales occurred in January, down 22% from December 2019 but up 24% from January 2019.
- Benchmark home prices increased slightly for detached homes, townhomes, and apartments compared to December 2019.
April 2015 - Market Snapshot - San Mateo CountyMLSListings Inc
This document contains 14 sections analyzing real estate market trends in San Mateo County, California from January 1998 to April 2015, including statistics on inventory levels, closed sales, new listings, median and average home prices, percentage of sale price to listing price, months of inventory, and average days on market for both single family homes and condominiums/townhomes. The sections provide data on a monthly and yearly basis with comparisons to the same month and time period in previous years.
January 2016 - Market Snapshot - San Benito CountyMLSListings Inc
The document contains 12 sections summarizing real estate trends in San Benito County, California from 1998 to 2016, including housing inventory levels, home sales, median and average home prices, percentage of sale price to listing price, months of inventory, and average days on the market for single family homes and condos. The data was compiled by MLSListings Inc and covers a 18-year period to provide a longitudinal view of the local real estate market.
Market Indicators - San Benito County - March 2015MLSListings Inc
The document contains 14 sections analyzing real estate market trends in San Benito County, California from 1998 to 2015, including statistics on inventory levels, sales prices, months of inventory, and days on market for single family homes and condos/townhouses. The sections provide historical data and comparisons over time on housing supply and demand, pricing, sales volume, and how quickly properties are selling in the local property market.
The document provides market snapshot data comparing March 2015 to March 2014 and February 2015 for several counties in California. It shows changes in inventory levels, closed sales, median and average prices, total dollar volume, days on market, and new listings for both single-family homes and condos/townhouses. Charts are also included showing historical trends in inventory levels, closed sales, and months of inventory for the counties.
April 2015 - Market Snapshot - Santa Clara CountyMLSListings Inc
This document contains 14 pages of charts and graphs analyzing real estate market trends in Santa Clara County, California from 1998 to 2015. The charts examine inventory levels, closed sales, new listings, median and average home prices, percentage of sale price to list price, months of inventory, and days on market for both single family homes and condominiums/townhomes over time. The data provides a historical overview of housing market performance in Santa Clara County.
Market Indicators - San Benito County - December 2014MLSListings Inc
This document contains 14 sections of real estate market data and trends for San Benito County, including statistics on inventory levels, closed home sales, new listings, median and average home prices, percentage of sale price to listing price, months of inventory, and average days on market for single family homes and condos from January 1998 to December 2014.
April 2015 - Market Snapshot - Santa Cruz CountyMLSListings Inc
The document is a report from MLSListings Inc on real estate market trends in Santa Cruz County from January 1998 to April 2015. It includes data on inventory levels, closed sales, new listings, median and average prices, percentage of sale price to list price, months of inventory, and days on market for both single family homes and condominiums/townhouses in the region over this time period. The report contains 14 pages of charts and graphs analyzing key indicators of the local real estate market.
January 2016 - Market Snapshot - Monterey CountyMLSListings Inc
The document contains 12 sections of data reports from MLSListings Inc on real estate trends in Monterey County, California from January 1998 to January 2016, including statistics on housing inventory levels, closed housing sales, new property listings, median and average home prices, percentage of sale price to listing price, months of inventory, and average days on the market for single family homes and condominiums/townhouses.
May 2015 - Single Family Outlook - Monterey CountyMLSListings Inc
This document contains a real estate market report for Monterey County covering the period from January 1998 to May 2015. It includes data on inventory levels, closed sales, new listings, median and average home prices, percentage of sale price to list price, months of inventory, and days on market for both single family homes and condominiums/townhomes in the region. The report contains 14 sections analyzing trends for the housing market in Monterey County over recent years.
Market Indicators - Santa Cruz County - March 2015MLSListings Inc
The document is a report from MLSListings Inc on real estate market trends in Santa Cruz County from January 1998 to March 2015. It includes data on inventory levels, closed sales, new listings, median and average prices, percentage of sale price to list price, months of inventory, and days on market for both single family homes and condominiums/townhomes over the 17-year period. The report contains 14 pages of charts and graphs analyzing changes in the Santa Cruz County real estate market over time.
Market Indicators - Santa Clara County - December 2014MLSListings Inc
The document contains 14 pages of real estate market data and trends for Santa Clara County, California from 1998 to 2014. It includes statistics on inventory levels, closed sales, new listings, median and average home prices, percentage of sale price to list price, months of inventory, and average days on market for both single family homes and condominiums/townhomes in the county over the time period. All data is from the MLSListings Inc database and copyrighted in 2014.
May 2015 - Market Snapshot - Santa Clara CountyMLSListings Inc
This document contains 14 pages of real estate market data and trends for Santa Clara County, including statistics on inventory levels, closed sales, new listings, median and average home prices, percentage of sale price to list price, months of inventory, and average days on market for single family homes and condos from January 1998 to May 2015. The data provides an overview and analysis of the Santa Clara County real estate market over the past 17 years.
April 2016 - Market Snapshot - San Mateo CountyMLSListings Inc
The document contains 12 sections summarizing real estate data for San Mateo County from January 1998 to April 2016, including trends in inventory, closed sales, median and average home prices, percentage of sale price to list price, months of inventory, and average days on market for single family homes and condos/townhouses. The data is from the Multiple Listing Service and was compiled by MLSListings Inc.
April 2016 - Market Snapshot - Santa Cruz CountyMLSListings Inc
The document contains 12 sections analyzing real estate trends in Santa Cruz County, California from 1998 to 2016, including housing inventory levels, closed housing sales, new property listings, median and average home prices, percentage of sale price to listing price, months of inventory, and average days on the market for single family homes and condominiums/townhomes. Each section contains a brief title and source statement from the MLSListings organization.
April 2016 - Market Snapshot - General OverviewMLSListings Inc
This document provides a market snapshot comparing real estate data from April 2016 to April 2015 and March 2016 in five California counties: Monterey, San Benito, San Mateo, Santa Clara, and Santa Cruz. It summarizes key metrics such as inventory levels, closed sales, median and average prices, total sales dollars, and days on market for both single-family homes and condominium/townhomes. Line graphs are also included showing historical data for various metrics from 2004 to 2016. Overall, the data shows increases over the prior year in inventory levels, closed sales, median and average prices, and total sales dollars across most counties and property types.
For the week ending April 19th:
- New listings decreased 2.8% to 1,571.
- Pending sales decreased 5.3% to 1,227.
- Inventory decreased 0.5% to 14,148.
For the month of March:
- Median sales price increased 7.6% to $189,950.
- Days on market decreased 12% to 95.
- Months supply of inventory decreased 6.1% to 3.1.
The document is a real estate report for The Woodlands, Texas that provides monthly data from 2009 to 2014 on listing inventory, homes sold, average and median sold prices, average price per square foot, and average days on market. It also includes charts showing trends in these metrics over time.
The Woodlands Real Estate Home Sales Report - August/September 2014Ken Brand
The document is a real estate report for The Woodlands, Texas that provides monthly data from 2009 to 2014 on listing inventory, homes sold, average and median sold prices, average price per square foot, and average days on market. It also includes charts showing trends in these metrics over time.
Residential real estate activity in San Francisco saw increases in median sales prices and pending sales in March 2015 compared to the previous year. The median sales price for single family homes rose 27.6% to $1,250,000, while the median price for condos increased 14% to $1,100,000. Pending sales for single family homes were up 6%, though pending sales for condos fell slightly by 0.7%. New listings declined for both single family homes and condos. Overall the real estate market in San Francisco remained strong with higher prices and sales activity despite reductions in inventory.
This document provides real estate market data for several counties in North and South Carolina for the third quarter of 2015. It includes metrics such as median sales price, percentage of original price received, days on market, inventory of homes for sale, months supply, closed sales, and historical median sales prices for each county from 2006 to the present. Counties included are Alexander, Anson, Cabarrus, Gaston, Iredell, Lincoln, Mecklenburg, Montgomery, Stanly, and Union in North Carolina as well as several counties in South Carolina. ZIP code level data is also provided for some counties.
"We are on track for record home sales reported through TREB's MLS® System this year. Barring a drastic shift in the economy over the next three months, total transactions reported by TREB Members in 2015 are expected to be at or near the 100,000 mark. This is a testament to the importance that GTA households put on home ownership as a long-term investment," said Mr. McLean.
The document provides residential real estate statistics for San Francisco for April 2015. It summarizes that new listings decreased 14.1% for single family homes and 15.8% for condos from the previous year. Median sales prices increased substantially, up 20.6% for single family homes to $1,326,500 and 21.7% for condos to $1,101,000. Months of inventory decreased for both single family homes and condos compared to the previous year.
The Woodlands Home Sales Report - November 2015 Ken Brand
This document provides real estate market data and statistics for The Woodlands, Texas for the period of October 2013 through November 2015. It includes information on listing inventory levels, homes sold, average and median home prices, average price per square foot, and average days on market. The data is presented on a monthly basis for comparisons over time. Key metrics such as average home price and inventory levels are shown to have fluctuated over the two year period.
The woodlands homes sales report november 2015Mary J Feece
This document provides real estate market data and statistics for The Woodlands, Texas for the period of October 2013 through November 2015. It includes information on listing inventory levels, homes sold, average and median home prices, average price per square foot, and average days on market. The data is presented on a monthly basis for comparisons over time. Key metrics such as average home price and inventory levels are also shown to have increased from one year to the next over the period studied.
This report summarizes home sales data for a real estate brokerage in the Woodlands, Texas area over a two year period from January 2013 to January 2015. It includes statistics on average and median sold prices, average price per square foot, and average days on market each month. It also shows the monthly supply of homes for sale and those under contract. The data aims to provide insights into the dynamics and trends of the local housing market.
Record Homes Sales Again for July 2015! As was the case in June, Dane County home sales in July reached an all-time high for the month. Year-to-date sales are also setting a record pace – exceeding the previous high recorded in 2005. New listings are keeping pace with recent years yet the active inventory continues to fall. This year has been positive as well for the primary market* served by the SCWMLS. Last month we stated that demand is expected to remain high for the second half of the year and nothing has happened to change our mind. As a result, inventories will remain low – below the 6 month figure generally considered to be the market balance between buyers and sellers. Prices (and interest rates) will likely continue to rise. For both buyers and sellers, strategic advice and knowledge of the market from your real estate professional will be valuable assets.
January 2015 Greater Boston Real Estate Market Trends ReportUnit Realty Group
Here’s January 2015’s Monthly Indicators report from the Greater Boston Association of Realtors®
Boston Real Estate Market Trends:
January home sales closed lower compared to last year as low inventory and end of month snow pushed off some closings. Median prices continued to go up as supply continues to be down. Sellers are waiting out Mother Nature to add their homes to the market keeping new listings down in January.
• January single-family home sales – UP +0.3% over last year and median prices UP +8.4% at $493,000
• January condo sales DOWN -18.5% and median prices UP +9.9% at $454,750
• Inventory in January DOWN -15.6% to 1,714 and condominiums DOWN -27.6% to 991
• SF listings added to the market in January DOWN -0.8% over last year. (753 from 759 in 2014)
• Condo listings added to the market DOWN -10.5% over last year. (674 from 753 in 2014)
Residential real estate activity in San Francisco saw increases in median sales prices in May 2015 compared to the previous year. The median sales price for single family homes rose 28.4% to $1,400,000, while the median price for condos rose 19.7% to $1,125,000. New listings and pending sales declined compared to the previous year, falling 22.9% and 4.2% respectively for single family homes.
September home sales report the woodlands 2015Deb Stirling
This document contains real estate market data and statistics for The Woodlands, Texas for the months of August and September 2015. It includes information on listing inventory levels month-to-month from 2015 to 2014. It also provides data on properties placed under contract, average and median sold prices, average price per square foot, and average days on market for both August 2015 and prior year periods. Additional statistics given are the months supply of inventory and listing inventory details as of September 1, 2015.
September 2014 The Woodlands market reportDebra Wymore
The document provides data on housing inventory and demand in The Woodlands for September 2014. It shows the number of homes available for sale by price range, with the lowest inventory below $200,000 and highest over $1,000,001. The months of supply indicates sellers' market conditions below 3 months for most lower price ranges. Data on home buying demand shows the number of contracts initiated by month by price range, with the highest demand between $200,001-$300,000 and $300,001-$400,000. The list to sales price ratio was steady at 98% for the year.
- Record home sales were reported in the Greater Toronto Area (GTA) in April 2015, with 11,303 sales representing a 17% increase from April 2014.
- The average home price in the GTA rose 10% year-over-year to $635,932 in April 2015. Price growth was strongest for low-rise homes but condominium prices also increased above the rate of inflation.
- Demand continued to outpace new listings, and annual home price growth is expected to remain strong until listings grow at a faster pace than sales.
The document discusses the economic impacts of hurricanes and shows that while hurricanes initially cause job and home sales losses, the affected areas typically see strong job growth and rising home sales 6-12 months later as rebuilding efforts take place. Graphs and data show examples of this pattern for New Orleans after Hurricane Katrina and Punta Gorda, Florida after Hurricane Charlie, with both areas experiencing higher employment within a few years. Additional charts track broader economic indicators like national job and home sales growth after 2004's Hurricane Charlie.
- The median sales price for single family homes increased 6.2% year-over-year to $1,115,000, while the median sales price for condos increased 17.4% to $1,100,000.
- New listings decreased for both single family homes and condos compared to February 2014. Pending sales also decreased for both property types compared to the previous year.
- The number of sold properties decreased for both single family homes and condos in February 2015 versus February 2014.
Similar to Market Indicators - General Overview - January 2015 (19)
April 2016 - Market Snapshot - Santa Clara CountyMLSListings Inc
The document contains 12 sections analyzing real estate trends in Santa Clara County, California from January 1998 to April 2016, including housing inventory levels, closed home sales, median and average home prices, percentage of homes selling at or above list price, months of inventory, and average days on market for single family homes and condo/townhouses. The data was compiled by MLSListings Inc and covers a 18+ year period.
April 2016 - Market Snapshot - San Benito CountyMLSListings Inc
The document contains 12 sections analyzing real estate trends in San Benito County, California from January 1998 to April 2016, including housing inventory levels, home sales, median and average home prices, percentage of sale price to listing price, months of inventory, and average days on market for single family homes and condo/townhouses. The data was compiled by MLSListings Inc and covers a period of 18+ years.
April 2016 - Market Snapshot - Monterey CountyMLSListings Inc
The document contains 12 sections that provide real estate data and trends for Monterey County, California from January 1998 to April 2016, including statistics on housing inventory levels, closed housing sales, median and average home prices, percentage of sale price versus list price, months of inventory, and average days on the market for single family homes and condominiums/townhomes. The data was compiled by MLSListings Inc and covers a 18+ year period.
March 2016 - Market Snapshot - Santa Cruz CountyMLSListings Inc
The document contains 12 sections analyzing real estate trends in Santa Cruz County, California from 1998 to 2016, including housing inventory levels, closed housing sales, median and average home prices, percentage of sale price to listing price, months of inventory, and average days on market for single family homes and condominiums/townhomes. The data was compiled by MLSListings Inc and covers a 18-year period.
March 2016 - Market Snapshot - Santa Clara CountyMLSListings Inc
The document contains 12 sections that provide real estate data and trends for Santa Clara County from January 1998 to March 2016, including housing inventory levels, closed home sales, median and average home prices, percentage of sale price to listing price, months of inventory, and average days on market for single family homes and condo/townhouses. The data was compiled by MLSListings Inc and covers a 18-year period.
March 2016 - Market Snapshot - San Mateo CountyMLSListings Inc
The document contains 12 sections analyzing real estate trends in San Mateo County, California from January 1998 to March 2016, including housing inventory levels, closed housing sales, median and average home prices, percentage of sale price versus listing price, months of inventory, and average days on the market for single family homes and condo/townhouses. The data was compiled by MLSListings Inc and covers a 18-year period.
March 2016 - Market Snapshot - San Benito CountyMLSListings Inc
The document contains 12 sections analyzing real estate trends in San Benito County, California from January 1998 to March 2016, including housing inventory levels, home sales, median and average home prices, percentage of sale price to listing price, months of inventory, and average days on the market for single family homes and condo/townhouses. The data was compiled by MLSListings Inc and covers a 18-year period.
March 2016 - Market Snapshot - Monterey CountyMLSListings Inc
The document contains 12 sections analyzing real estate trends in Monterey County, California from January 1998 to March 2016, including housing inventory levels, closed housing sales, new property listings, median and average home prices, percentage of sale price to listing price, months of inventory, and average days on market for single family homes and condominiums/townhomes. The data was compiled by MLSListings Inc and covers an 18-year period.
February 2016 - Market Snapshot - Santa Cruz County MLSListings Inc
The document contains 12 sections analyzing real estate trends in Santa Cruz County, California from 1998 to 2016, including housing inventory levels, closed housing sales, median and average home prices, percentage of sale price to listing price, months of inventory, and average days on the market for single family homes and condominiums/townhomes. Each section contains a brief title and citation for housing data provided by MLSListings Inc.
February 2016 - Market Snapshot - Santa Clara County MLSListings Inc
The document reports on real estate trends in Santa Clara County, California from January 1998 to February 2016, including statistics on housing inventory levels, closed housing sales, median and average home prices, percentage of sale price to listing price, months of inventory, and average days on market for single family homes and condo/townhouses. The data is provided by MLSListings Inc and covers a period of 18 years.
February 2016 - Market Snapshot - San Mateo County MLSListings Inc
The document contains 12 sections analyzing real estate trends in San Mateo County, California from January 1998 to February 2016, including housing inventory levels, closed housing sales, median and average home prices, percentage of sale price versus listing price, months of inventory, and average days on the market for single family homes and condo/townhouses. The data was compiled by MLSListings Inc and covers a period of 18 years.
February 2016 - Market Snapshot - San Benito County MLSListings Inc
The document contains 12 sections analyzing real estate trends in San Benito County, California from January 1998 to February 2016, including housing inventory levels, home sales, median and average home prices, percentage of homes selling at or below asking price, months of inventory, and average days on market for single family homes and condos. The data was compiled by MLSListings Inc and examines key real estate market indicators over the 18-year period.
February 2016 - Market Snapshot - Monterey CountyMLSListings Inc
The document contains 12 sections analyzing real estate trends in Monterey County, California from January 1998 to February 2016, including charts on housing inventory levels, closed housing sales, median and average home prices, percentage of sale price versus listing price, months of inventory, and average days on the market for single family homes and condominiums/townhomes. The data was compiled by MLSListings Inc and covers a 18-year period.
January 2016 - Market Snapshot - Santa Cruz CountyMLSListings Inc
The document contains 12 sections analyzing real estate trends in Santa Cruz County, California from 1998 to 2016, including housing inventory levels, closed housing sales, new property listings, median and average home prices, percentage of sale price to listing price, months of inventory, and average days on market for single family homes and condominiums/townhomes. Each section contains a brief title and source statement from the MLSListings Inc.
January 2016 - Market Snapshot - Santa Clara CountyMLSListings Inc
The document contains 12 sections analyzing real estate inventory, sales, listings, pricing trends, and days on market from January 1998 to January 2016 for Santa Clara County, California. Each section is attributed to MLSListings Inc and focuses on a different metric for analyzing the Santa Clara County housing market over the past 18+ years.
January 2016 - Market Snapshot - San Mateo CountyMLSListings Inc
The document contains 12 sections analyzing real estate trends in San Mateo County, California from 1998 to 2016, including housing inventory levels, closed housing sales, new property listings, median and average home prices, percentage of sale price versus listing price, months of inventory, and average days on market for single family homes and condo/townhouses. The data was compiled by MLSListings Inc and covers a period of almost 20 years.
December 2015 - Market Snapshot - Santa Cruz CountyMLSListings Inc
The document contains 14 sections analyzing real estate market trends in Santa Cruz County, California from 1998 to 2015, including statistics on housing inventory levels, closed housing sales, new housing listings, median and average home prices, percentage of sale price to listing price, and days on market for single family homes and condos/townhouses.
December 2015 - Market Snapshot - Santa Clara CountyMLSListings Inc
The document contains 14 sections analyzing real estate market trends in Santa Clara County, California from 1998 to 2015, including statistics on housing inventory levels, closed housing sales, new housing listings, median and average home prices, percentage of sale price to listing price, months of inventory, and average days on market for both single family homes and condominiums/townhomes. The data is sourced from MLSListings Inc and provided to summarize the performance of the Santa Clara County housing market over the past 17 years.
December 2015 - Market Snapshot - San Mateo CountyMLSListings Inc
The document contains 14 sections of real estate market data reports from MLSListings Inc for San Mateo County, including trends for inventory levels, closed home sales, new listings, median and average home prices, percentage of sale price to listing price, months of inventory, and days on market for both single family homes and condos from 1998 to 2015.
December 2015 - Market Snapshot - San Benito CountyMLSListings Inc
The document contains 14 sections analyzing real estate market trends in San Benito County, California from 1998 to 2015, including statistics on housing inventory levels, closed housing sales, new housing listings, median and average home prices, percentage of sale price versus listing price, months of inventory, and average days on the market for single family homes and condominiums/townhomes. The analysis is provided by MLSListings Inc and draws on real estate listing data from over 17 years.
Discover Yeni Eyup Evleri 2, nestled among the rising values of Eyupsultan, offering the epitome of modern living in Istanbul.
With its spacious living areas, contemporary architecture, and meticulous details, Yeni Eyup Evleri 2 is poised to be the star of your happiest moments. Situated in the new favorite district of Eyupsultan, claim your spot and unlock the doors to a peaceful life alongside your loved ones. Nestled next to the historical and natural beauties of Eyupsultan, embrace the comfort of modern living and rediscover life.
Social Amenities:
Yeni Eyup 2 offers a life filled with joy with its green landscaping areas, gym, sauna, children’s play areas, café, outdoor pool, and basketball court. Reserve your place for unforgettable moments!
Reliable Structure:
With 1+1, 2+1, and 3+1 apartment options, Yeni Eyup Evleri 2 is designed with first-class materials and craftsmanship. The doors to a safe and comfortable life are here! Choose the option that suits you best and step into your dream home.
Project:
Yeni Eyup 2 is conveniently located, with Istanbul Airport just 26 minutes away, the Mecidiyeköy Metro Line 4 minutes away, and the Tram Stop 5 minutes away, making your life easier with its central location.
Location:
Your home is positioned in a privileged location, providing easy access to the city center, shopping malls, restaurants, schools, and other important places.
Yeni Eyup 2 offers 1+1, 2+1, and 3+1 apartment options designed to meet different needs. Find an option suitable for every lifestyle and open the doors to a comfortable life in your dream home.
https://listingturkey.com/property/yeni-eyup-evleri-2/
Recent Trends Fueling The Surge in Farmhouse Demand in IndiaFarmland Bazaar
Embarking on the journey to acquire a farmhouse for sale is just the beginning; the real investment lies in crafting an environment that contributes to our mental and physical well-being while satisfying the soul. At Farmlandbazaar.com, India’s leading online marketplace dedicated to farm land, farmhouses, and agricultural lands, we understand the importance of transforming a humble farmland into a warm and inviting sanctuary. Let's explore the fundamental aspects that can elevate your farmhouse into a tranquil haven.
The SVN® organization shares a portion of their new weekly listings via their SVN Live® Weekly Property Broadcast. Visit https://svn.com/svn-live/ if you would like to attend our weekly call, which we open up to the brokerage community.
BEST FARMLAND FOR SALE | FARM PLOTS NEAR BANGALORE | KANAKAPURA | CHICKKABALP...knox groups real estate
welcome to knox groups real estate company in Bangalore. best farm land for sale near Bangalore and madhugiri . Managed farmland near Kanakapura and Chickkabalapur get know more details about the projects .Knox groups is a leading real estate company dedicated to helping individuals and businesses navigate the dynamic real estate market. With our extensive knowledge, experience, and commitment to excellence, we deliver exceptional results for our clients. Discover the perfect foundation for your agricultural aspirations with KNOX Groups' prime farm lands. These aren't just plots; they're the fertile grounds where vibrant crops flourish, livestock thrives, and unique agricultural ventures come to life. At KNOX, we go beyond selling land we curate sustainable ecosystems, ensuring that your journey toward agricultural success is seamless and prosperous.
Serviced Apartment Ho Chi Minh For RentalGVRenting
GVRenting is the leading rental real estate company in Vietnam. We help you to find a serviced apartment for rent in Ho Chi Minh & Saigon. Discover our broad range of rental properties in Vietnam.
For more details https://gvrenting.com/
AVRUPA KONUTLARI ESENTEPE - ENGLISH - Listing TurkeyListing Turkey
Looking for a new home in Istanbul? Look no further than Avrupa Konutlari Esentepe! Our beautifully designed homes provide the perfect blend of luxury and comfort, making them the perfect choice for anyone looking for a high-quality home in the city.
With a wide range of apartment types available, from 1+1 to 4+1, we have something to suit every need and budget. Each apartment is designed with attention to detail and features spacious and bright living areas, making them the perfect place to relax and unwind after a long day.
One of the things that sets Avrupa Konutlari Esentepe apart from other developments is our focus on creating a community that is both comfortable and convenient. Our homes are surrounded by lush green spaces, perfect for enjoying a peaceful stroll or having a picnic with friends and family. Additionally, our complex includes a variety of social and recreational amenities, such as swimming pools, sports fields, and playgrounds, making it easy for residents to stay active and socialize with their neighbors.
https://listingturkey.com/property/avrupa-konutlari-esentepe/
8. MLSListings Inc Confidential Copyright 2015 8
8
Single Family Inventory - Home Counties
Jan (2004 – 2015)
Monterey
County
San Benito
County
San Mateo
County
Santa Clara
County
Santa Cruz
County
Jan '04 872 5.8% 207 -25.1% 785 -39.4% 2324 -38.1% 565 -24.2%
Jan '05 852 8.3% 139 11.5% 530 -10.2% 1547 -7.0% 425 0.7%
Jan '06 1705 -45.9% 237 -34.6% 839 -43.3% 2229 -35.5% 758 -43.5%
Jan '07 1987 -53.5% 352 -56.0% 926 -48.6% 2648 -45.7% 813 -47.4%
Jan '08 2480 -62.8% 466 -66.7% 1448 -67.1% 4563 -68.5% 965 -55.6%
Jan '09 2431 -62.0% 356 -56.5% 1452 -67.2% 4787 -70.0% 963 -55.6%
Jan '10 1433 -35.6% 237 -34.6% 1156 -58.8% 2939 -51.1% 691 -38.1%
Jan '11 1602 -42.4% 300 -48.3% 1400 -66.0% 3589 -59.9% 765 -44.1%
Jan '12 1320 -30.1% 229 -32.3% 1188 -59.9% 2715 -47.0% 738 -42.0%
Jan '13 882 4.6% 123 26.0% 545 -12.7% 1169 23.0% 460 -7.0%
Jan '14 796 16.0% 127 22.0% 464 2.6% 1072 34.1% 409 4.6%
Jan '15 923 155 476 1438 428
Home Counties - Single Family Inventory (2015 vs. Prior Years)
9. MLSListings Inc Confidential Copyright 2015 9
9
Single Family + Condo/Townhouse Inventory - Home Counties
Jan ’05 – Jan ’15
2005 2006 2007 2008 2009 2010 2011 2012 2013 2014 2015
Jan 4223 7295 8588 12447 12693 8558 10330 8140 3179 3578 4175
Feb 4839 8023 9184 13528 13079 9650 10803 8231 4296 3924
Mar 5502 8827 10357 14355 13240 10910 11127 7991 4286 4322
Apr 6434 9722 11812 15513 12806 11773 11506 7630 4765 4776
May 7020 10819 12923 15787 11749 11903 11730 7712 5222 3520
Jun 7189 11493 13287 15802 11104 12691 11740 7570 5616 5322
Jul 7878 12317 13910 15948 10763 13016 11372 7306 5950 4389
Aug 8030 12122 14275 15356 10044 13072 11201 7116 5850 5378
Sep 8798 12239 13943 15192 9823 13294 10944 6523 5806 5290
Oct 8946 11490 14020 15070 9295 12440 10241 6173 5384 4863
Nov 8252 9968 13308 13849 8724 11500 9482 5292 4592 3925
Dec 6372 7874 11420 12221 7778 9825 7790 3901 3198 3174
Jan '05 4223
Jan '06 7295
Jan '07 8588
Jan '08 12447
Jan '09 12693
Jan '10 8558
Jan '11 10330
Jan '12 8140
Jan '13 3179
Jan '14 3578
Jan '15 4175
Variance to
prior Years
Home Counties
Inventory
-1.1%
-42.8%
-51.4%
-66.5%
-67.1%
-51.2%
-59.6%
-48.7%
31.3%
16.7%
Home Counties - Single Family + Condo/Townhouse Inventory
0
2000
4000
6000
8000
10000
12000
14000
Jan
'05
Jan
'06
Jan
'07
Jan
'08
Jan
'09
Jan
'10
Jan
'11
Jan
'12
Jan
'13
Jan
'14
Jan
'15
12693
4175
10. MLSListings Inc Confidential Copyright 2015 10
10
Single Family Months of Inventory – San Mateo, Santa Clara, Santa Cruz
Mar ’03 – Jan ’15 (Rolling Three Month Average)
11. MLSListings Inc Confidential Copyright 2015 11
11
Single Family Months of Inventory – Monterey and San Benito Counties
Mar ’03 – Jan ’15 (Rolling Three Month Average)
12. MLSListings Inc Confidential Copyright 2015 12
12
Single Family + Condo/Townhouse Closed Sales – Home Counties
Jan ’03 – Jan ’15
28. MLSListings Inc Confidential Copyright 2015 28
28
Single Family Average Price - Home Counties
Jan (2004 – 2015)
Monterey
County
San Benito
County
San Mateo
County
Santa Clara
County
Santa Cruz
County
Jan '04 $657,979 -4.1% $461,078 1.6% $864,479 75.2% $691,319 68.1% $652,712 10.9%
Jan '05 $907,408 -30.4% $612,572 -23.5% $1,043,069 45.2% $822,123 41.3% $798,524 -9.4%
Jan '06 $988,407 -36.1% $670,531 -30.2% $1,081,979 40.0% $903,022 28.7% $814,467 -11.2%
Jan '07 $1,119,968 -43.6% $666,608 -29.7% $1,109,303 36.5% $952,098 22.0% $795,108 -9.0%
Jan '08 $1,139,519 -44.6% $515,218 -9.1% $1,206,153 25.6% $1,005,253 15.6% $729,145 -0.8%
Jan '09 $312,385 102.0% $297,801 57.3% $638,900 137.0% $561,711 106.9% $528,190 37.0%
Jan '10 $390,863 61.5% $361,476 29.6% $840,235 80.2% $666,729 74.3% $569,544 27.1%
Jan '11 $483,925 30.4% $295,046 58.7% $786,509 92.6% $661,400 75.7% $502,330 44.1%
Jan '12 $474,642 33.0% $298,165 57.1% $792,147 91.2% $648,238 79.2% $460,735 57.1%
Jan '13 $552,185 14.3% $361,215 29.7% $950,843 59.3% $825,689 40.7% $548,101 32.0%
Jan '14 $739,620 -14.7% $430,968 8.7% $1,417,897 6.8% $959,289 21.1% $739,844 -2.2%
Jan '15 $631,114 $468,364 $1,514,498 $1,161,925 $723,639
Home Counties - Single Family Average Price (2015 vs. Prior Years)
29. MLSListings Inc Confidential Copyright 2015 29
29
Condo/Townhouse Business Outlook – Home Counties
Jan ’14 vs. Jan ’15
30. MLSListings Inc Confidential Copyright 2014 30
30
Condo/Townhouse Months of Inventory – San Mateo, Santa Clara, Santa Cruz
Mar ’03 – Jan ’15 (Rolling Three Month Average)
31. MLSListings Inc Confidential Copyright 2015 31
31
Condo/Townhouse Months of Inventory – Monterey and San Benito Counties
Mar ’03 – Jan ’15 (Rolling Three Month Average)