Download to read offline


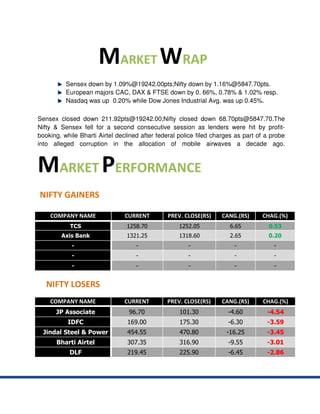
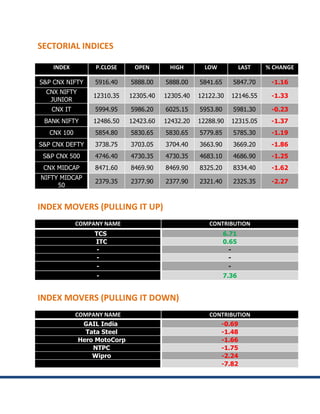
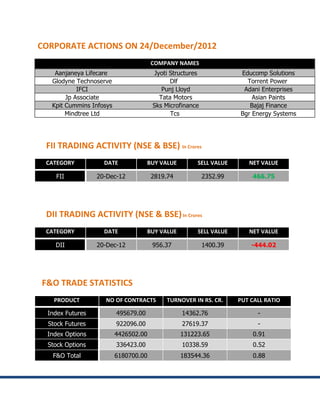
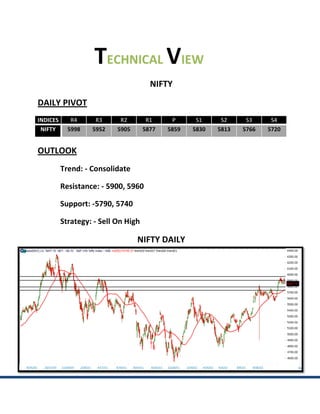
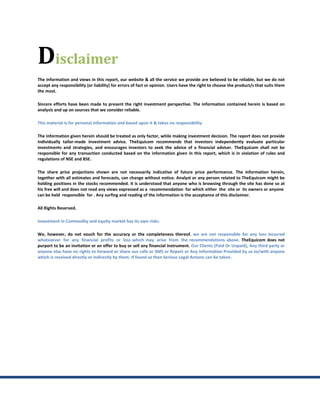

- The Sensex closed down 211 points at 19,242 and the Nifty closed down 69 points at 5,847 as banks fell due to profit-taking and Bharti Airtel declined after corruption charges. - TCS and Axis Bank were the top gainers on the Nifty while JP Associates, IDFC, and Jindal Steel saw the largest losses. - Most sectoral indices closed down over 1% including the Bank Nifty which fell 1.37% while selling by FIIs exceeded buying.


